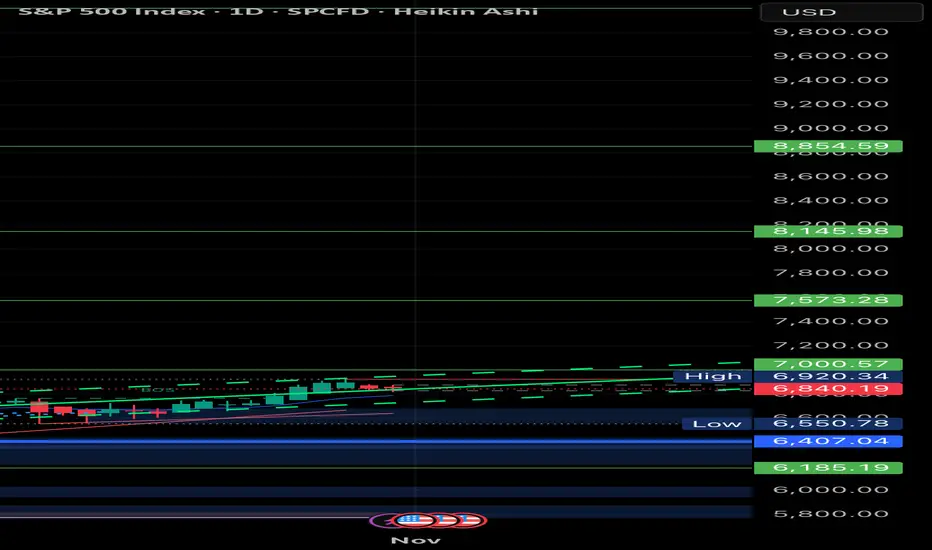
SPX moneyPrice make a foundation low then pullback creating short term uptrend eventually coming to an end. Following price fell and make a new external low. Waited for price to come back to the last time buyers were in control and in discount to take us to the external low. Same play... continuation.
Trade ideas

Monthly CloseS&P500 Timeframe H6 - Since the open this week we have been hovering around the 6,000 mark which is currently acting as a psychological level. Is there more upside to come before the end of the monthly candle close or are we going to see another bounce lower from this zone like we did last week?

SPX500 longMarket Structure
Overall trend on higher timeframes (H1–H4) remains bearish — you can see a strong impulse down, then a current range/consolidation phase.
The lower low was formed near the 6 730s (bottom gray zone).
Price is now consolidating just above that liquidity zone — showing accumulation before a possible short-term correction upward.
🔹 Key Zones
Demand zone (orange + gray lower area)
→ This is where the previous bearish leg ended.
→ Several candle rejections show liquidity absorption from sellers.
Internal Range
Equal highs marked by green line — liquidity built up for potential sweep.
Equal lows marked by orange line — base of current accumulation.
Supply zone (gray upper area)
Between 6 795 – 6 815.
This zone was the origin of the last strong bearish displacement, so it’s your target zone for a possible pullback or continuation rejection.

SPX updated for November 5thTrying to bounce.Plenty of resistance
Bulls will want to keep it above 6700
November 5th a big day over here in the UK.420 years ago Guy Fawkes tried to blow up our parliament.He and his gang were caugh ton 5th Novemeb3r 1605
Key Pillars of Global Market SuccessKey Pillars of Global Market Success
In the modern interconnected world, success in the global market depends on much more than simply exporting products or services across borders. It involves mastering an ecosystem of strategies, competencies, and adaptability that allows businesses to thrive amid fierce competition, diverse consumer preferences, evolving technology, and changing regulations. Understanding the key pillars of global market success is crucial for any organization that aims to expand internationally, build a sustainable brand, and maintain long-term growth.
Below are the fundamental pillars that support success in the global marketplace.
1. Strong Market Research and Cultural Understanding
Before entering any foreign market, businesses must conduct thorough market research to understand the local culture, consumer behavior, economic environment, and regulatory structure. This goes beyond studying demographics or income levels; it involves understanding cultural nuances, preferences, and purchasing habits.
For instance, a marketing strategy that works in the United States may fail in Japan or India because of differences in communication style, color symbolism, and social norms. Companies like McDonald’s and Coca-Cola have succeeded globally because they localize their products — offering the McPaneer burger in India or tea-based beverages in China.
Effective market research also helps identify:
Consumer trends and unmet needs
Competitor strategies
Pricing expectations
Distribution challenges
Ultimately, cultural intelligence — the ability to adapt to local customs while maintaining a global identity — is one of the strongest foundations for global market success.
2. Product Innovation and Adaptability
Innovation is the lifeblood of global competitiveness. Successful global companies are those that continuously innovate to meet diverse consumer demands and rapidly changing technologies.
However, innovation must be combined with adaptability. A product that dominates one region may need to be redesigned for another. For example, automobile manufacturers often modify car designs for local road conditions, fuel quality, and climate. Similarly, software companies translate and localize their user interfaces for different languages and legal frameworks.
The key is to build a balance between standardization and customization. Standardization offers economies of scale and a unified brand identity, while customization ensures relevance in local markets.
Innovative adaptability also includes:
Sustainable product design
Integration of digital technologies
Customer-centric product development
Innovation and adaptability ensure that companies remain competitive, responsive, and resilient to global shifts in demand.
3. Effective Global Strategy and Vision
Every successful international business is built upon a clear strategic vision. This vision outlines why the company is expanding globally, where it intends to grow, and how it plans to achieve that growth.
A global strategy must align with the company’s core competencies while considering:
Market entry modes (exporting, franchising, joint ventures, acquisitions)
Localization vs. standardization decisions
Long-term investment and operational models
Supply chain and logistics networks
For instance, companies like Apple and Toyota have achieved success because of their well-defined global strategies that focus on efficiency, innovation, and customer experience.
Strategic clarity allows companies to avoid costly mistakes — such as entering markets without understanding local regulations or underestimating cultural resistance. It ensures that every move supports the company’s broader vision of global growth and brand leadership.
4. Strong Brand Identity and Reputation
A strong brand transcends borders. Global market success depends heavily on how consumers perceive and trust a brand. Reputation, once built, becomes a key competitive advantage that drives loyalty and market expansion.
Companies that consistently deliver quality, ethical practices, and transparency earn the trust of global customers. Apple, Nike, and Samsung are examples of brands that represent innovation, quality, and status — values that resonate worldwide.
Brand success in the global market also depends on:
Consistent brand messaging across cultures
Localized marketing campaigns that reflect local values
Corporate social responsibility (CSR) initiatives that enhance goodwill
Emotional connection through storytelling and authenticity
A powerful global brand acts as a bridge across cultures and markets, allowing companies to command premium prices and sustain long-term relationships.
5. Efficient Supply Chain and Operations Management
Operational efficiency and a resilient supply chain are vital for global competitiveness. The ability to source materials globally, manufacture efficiently, and deliver products on time defines a company’s success in international markets.
A robust supply chain ensures:
Cost optimization through global sourcing
Speed and flexibility in responding to market changes
Risk mitigation against disruptions such as geopolitical tensions or pandemics
Technological integration — such as blockchain for transparency or AI for demand forecasting — has revolutionized global supply chain management.
Companies like Amazon and Unilever have mastered this pillar by building logistics networks that span continents, supported by data analytics and automation. These efficiencies not only improve profitability but also enhance customer satisfaction and competitiveness.
6. Financial Strength and Risk Management
Global expansion requires significant financial resources. Success depends not only on investment capacity but also on the ability to manage risks such as currency fluctuations, inflation, political instability, and trade policy changes.
Companies must establish:
Hedging strategies for currency and interest rate volatility
Diversified revenue streams to offset regional downturns
Robust financial planning for taxation, compliance, and cost management
Financial resilience allows businesses to withstand global shocks, like the COVID-19 pandemic or trade wars, while continuing operations and maintaining investor confidence.
Additionally, access to global financing options — such as international bonds, venture capital, and foreign direct investments (FDIs) — strengthens a company’s ability to scale operations and explore new markets.
7. Talent Management and Cross-Cultural Leadership
Human capital is one of the most valuable assets in global success. Managing a diverse, cross-cultural workforce requires leadership that understands different values, work ethics, and communication styles.
Successful global firms emphasize:
Cross-cultural training for employees
Inclusive leadership that values diversity
Decentralized decision-making for regional responsiveness
Talent mobility programs to develop global leaders
For example, multinational companies like Google and IBM encourage internal global mobility, allowing employees to experience different cultures and bring innovative ideas to their roles.
Building global teams also enhances creativity, problem-solving, and adaptability — qualities essential for sustained success in international markets.
8. Technology Integration and Digital Transformation
Digital transformation is no longer optional; it is the backbone of modern global business success. Companies that leverage technology for marketing, operations, analytics, and customer engagement gain a massive advantage.
Key technological enablers include:
Artificial Intelligence (AI) for predictive analytics and automation
Big Data for consumer insight and personalized marketing
Cloud computing for scalable operations
E-commerce platforms for global reach
Digitalization allows even small and medium enterprises (SMEs) to compete internationally without the need for large physical infrastructure.
For instance, Shopify and Alibaba have enabled countless businesses to access global markets through online stores, while advanced logistics and digital payment systems simplify global trade transactions.
Thus, technology acts as both a driver of innovation and an equalizer that lowers barriers to global market entry.
9. Legal and Ethical Compliance
Operating globally requires strict adherence to international laws, trade agreements, and ethical standards. Failure to comply can lead to heavy penalties, brand damage, or even market bans.
Key compliance areas include:
Trade regulations and import/export duties
Data protection and privacy laws (e.g., GDPR in Europe)
Environmental sustainability standards
Anti-corruption and fair competition laws
Ethical conduct, corporate transparency, and sustainability practices are now essential for brand reputation and investor trust. Companies that integrate Environmental, Social, and Governance (ESG) principles attract more customers and long-term investors.
A responsible global business does not merely chase profit; it contributes to global well-being and sustainable development.
10. Customer-Centric Approach and Relationship Building
At the heart of global market success lies one universal truth — the customer is king. Businesses that place customers at the center of their strategy are more likely to succeed globally.
This involves:
Listening to customer feedback from diverse markets
Offering localized support and services
Using data analytics to personalize offerings
Building long-term trust rather than focusing solely on short-term sales
Companies like Amazon, Netflix, and Starbucks excel because they continuously adapt their customer experience using data-driven insights. A strong customer relationship not only drives loyalty but also builds powerful word-of-mouth reputation in new markets.
11. Sustainability and Social Responsibility
Modern consumers, investors, and regulators increasingly expect businesses to operate sustainably. Environmental and social responsibility is no longer a marketing choice but a business imperative.
Sustainability includes:
Reducing carbon footprint and waste
Ethical sourcing of raw materials
Supporting community development
Transparent ESG reporting
Brands that align their operations with global sustainability goals (like the UN Sustainable Development Goals) not only attract conscious consumers but also secure long-term stability by reducing regulatory risks.
Companies like Tesla, Patagonia, and Unilever have demonstrated how sustainability can be integrated into the business model while maintaining profitability.
12. Continuous Learning and Adaptation
The global market is dynamic — what works today may not work tomorrow. Continuous learning, innovation, and adaptation are the final and most enduring pillars of success.
Businesses must stay alert to:
Technological disruptions (AI, automation, blockchain)
Changing trade policies and tariffs
Evolving consumer expectations
Economic and geopolitical shifts
Agile companies that embrace change, experiment, and learn from failures can sustain success in the ever-evolving global landscape.
Conclusion
Global market success is not built overnight. It requires a combination of strategic clarity, cultural understanding, innovation, and resilience. The twelve pillars discussed above — from research and adaptability to sustainability and learning — form an integrated framework that helps businesses expand internationally while maintaining a strong competitive edge.
The global marketplace rewards those who can balance local relevance with global vision. Companies that invest in people, technology, ethics, and innovation not only achieve profitability but also become agents of positive global change.
In essence, the true measure of global market success lies in creating lasting value — for customers, employees, communities, and the planet — while navigating an ever-changing world with agility and integrity.


Maximum profit: Top 5 indices of OctoberIn October, client activity peaked around #SP500, #NQ100, #DAX30, #FTSE100, and #NIKKEI . These five indices not only showed the highest share of profitable trades but also delivered the best returns across all index instruments. Strong corporate earnings, steady demand, and a positive news backdrop continue to support their growth potential.
Growth outlook for key indices through the end of 2025:
• #SP500: New record highs, solid earnings from major players, and expectations of a Fed rate cut support buying the dip with moderate risk.
• #NQ100: Tech demand remains strong as firms invest in data centers and AI infrastructure. If earnings stay on track, there’s still room to grow.
• #DAX30: After hitting new all-time highs in 2025, the German index benefits from improved global trade sentiment and stable EU data. Exporters thrive on robust external demand.
• #FTSE100: The UK market remains near its highs, supported by strong performance in key sectors and commodities. Year-end liquidity may further reinforce the uptrend.
• #NIKKEI: Japan’s index keeps climbing, helped by a weak yen boosting exports and a predictable monetary environment. Further gains are possible if global conditions remain calm.
FreshForex analysts believe short-term index performance hinges on three main factors: current earnings season results, inflation trends, and central bank decisions. Risk management and awareness of the macro calendar remain essential.

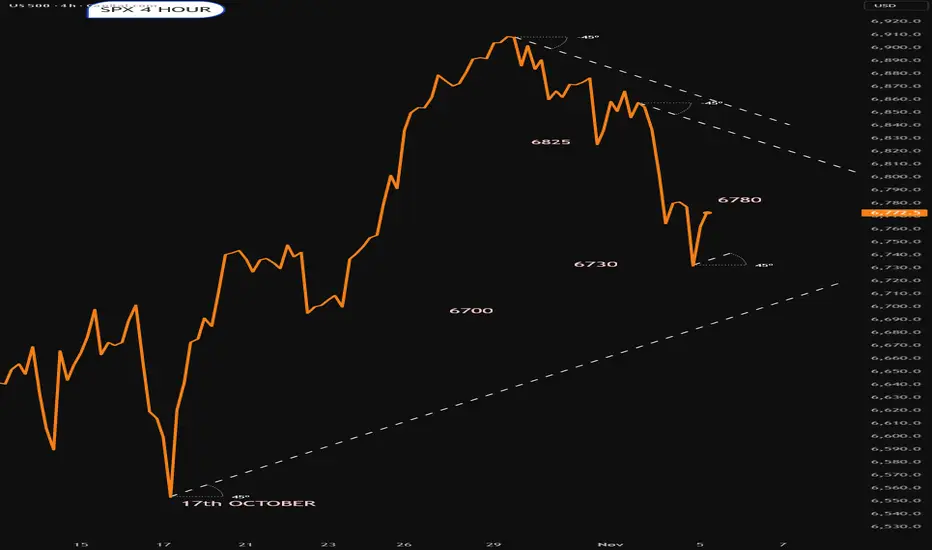
SPX into the open 4th NovemberPossible support areas marked
Resistance...Not really clear
Will it get bought.?
S&P Daily ChartDaily chart S&P With trend lines and view for near future trading where to expect the Low

SPX updated for 4th NovemeberComing into a support area 6750-6780
Will that hold.?
Lets see what happens

Risks and Opportunities in the Global Market1. Introduction: The Global Market Landscape
The global market is a dynamic system where goods, services, and capital flow freely across national borders. This system thrives on globalization — the process of increasing interdependence among nations through trade, investment, technology, and finance. Over the last few decades, international trade agreements, technological advancements, and digital transformation have made global markets more accessible.
However, with this increased connectivity comes vulnerability. A crisis in one country can ripple across continents, as seen during the 2008 financial crisis or the COVID-19 pandemic. Thus, participants in the global market must constantly balance risk management and opportunity recognition.
2. Major Risks in the Global Market
a. Economic and Financial Risks
Economic fluctuations, inflation, and interest rate volatility are among the biggest risks in the global market. For instance, a sudden rise in U.S. interest rates can trigger capital outflows from emerging markets, leading to currency depreciation and financial instability.
Global recessions or slowdowns also reduce demand for exports, affecting developing economies reliant on trade. Moreover, the interconnected nature of financial markets means that a crisis in one major economy often spreads rapidly worldwide.
b. Geopolitical Risks
Political instability, trade wars, sanctions, and conflicts can disrupt global supply chains and impact investor sentiment. Recent examples include the Russia-Ukraine war and tensions in the Middle East, both of which caused oil price volatility and uncertainty in global energy markets.
Geopolitical risks can also lead to protectionism — where countries impose tariffs or restrict trade to protect domestic industries, slowing global commerce and increasing costs.
c. Currency and Exchange Rate Risks
In global business, currency fluctuations can significantly affect profits. When a company operates across multiple countries, it earns revenue in different currencies. If one currency weakens, it can reduce the company’s overall earnings when converted back to the home currency.
For instance, exporters from Japan or Europe often face profit declines when their local currency strengthens against the U.S. dollar. Managing this risk often requires complex hedging strategies.
d. Supply Chain Disruptions
Global supply chains have become more fragile due to over-dependence on certain regions for manufacturing and raw materials. Events like natural disasters, pandemics, or geopolitical tensions can halt production and raise costs. The COVID-19 pandemic exposed how vulnerable global supply networks are, leading many companies to rethink their sourcing strategies and focus on supply chain diversification.
e. Technological and Cybersecurity Risks
While technology drives globalization, it also introduces cyber threats and data privacy issues. Hackers and cybercriminals target multinational companies, leading to financial losses and reputational damage.
Moreover, as automation and artificial intelligence (AI) reshape industries, there’s a risk of job displacement and unequal technological adoption between countries, which can widen global inequality.
f. Environmental and Regulatory Risks
Climate change and environmental degradation are becoming major global concerns. Governments worldwide are enforcing stricter environmental laws and carbon regulations. Businesses that fail to adopt sustainable practices face penalties, reputational harm, or exclusion from eco-conscious markets.
At the same time, frequent natural disasters and changing weather patterns threaten agricultural output, infrastructure, and supply stability.
3. Key Opportunities in the Global Market
a. Expansion of Emerging Markets
Emerging economies like India, Indonesia, Vietnam, and several African nations are projected to lead global growth in the coming decades. These regions have young populations, expanding middle classes, and growing consumer demand.
For investors and multinational companies, emerging markets offer new avenues for trade, infrastructure development, and technology adoption. Global brands can tap into these markets by offering affordable, localized products and services.
b. Technological Innovation and Digital Transformation
Digital technologies — from AI to blockchain and 5G — are revolutionizing how businesses operate globally. E-commerce, fintech, and cloud computing have reduced entry barriers for small and medium enterprises (SMEs) to reach international customers.
Companies that embrace digital transformation gain efficiency, lower costs, and can compete globally. Moreover, digital finance and cryptocurrencies are opening new frontiers for cross-border transactions.
c. Sustainability and Green Investments
The global shift toward sustainability presents enormous opportunities. Clean energy, electric vehicles, and carbon-neutral products are attracting massive investment. Governments and institutions are pushing for green finance and environmental, social, and governance (ESG) compliance.
Investors who focus on sustainable assets are likely to benefit as the world transitions to a low-carbon economy. This creates new markets in renewable energy, waste management, and sustainable agriculture.
d. Diversification and Strategic Alliances
Globalization allows companies to diversify their production, investment, and sourcing strategies. Instead of depending on a single region, businesses can build strategic alliances and joint ventures across countries.
For example, technology partnerships between Western and Asian firms allow access to new technologies and talent pools, enhancing innovation and competitiveness.
e. Global Talent and Knowledge Sharing
The digital era has made it possible for organizations to tap into global talent pools. Remote work and cross-border collaboration have become common, allowing firms to recruit the best minds from anywhere in the world.
Knowledge sharing across borders fosters innovation, research, and cultural exchange, enriching global productivity and creativity.
f. Rising Global Consumer Base
The global middle class is expanding rapidly — especially in Asia and Africa. This surge in purchasing power offers companies a vast consumer market. Industries like e-commerce, entertainment, finance, and healthcare are seeing strong growth due to changing lifestyles and increasing digital adoption.
4. Balancing Risks and Opportunities
To succeed in the global market, companies and investors must skillfully balance risk management with opportunity pursuit.
Some effective strategies include:
Diversification: Investing across countries, sectors, and currencies to reduce exposure to regional risks.
Hedging: Using financial instruments like futures, options, and swaps to mitigate currency and interest rate risks.
Scenario Planning: Preparing for multiple future possibilities by forecasting economic, political, and technological shifts.
Sustainability Integration: Adopting green practices not only reduces risk but also attracts conscious investors and customers.
Agile Operations: Building flexible supply chains and digital infrastructure to adapt quickly to global disruptions.
5. Conclusion
The global market is a double-edged sword — filled with unprecedented opportunities but also heightened risks. Businesses that understand this balance and adapt proactively are best positioned to thrive.
While risks such as economic volatility, geopolitical conflicts, and regulatory challenges cannot be fully eliminated, they can be managed through strategic planning and diversification.
At the same time, opportunities arising from digital transformation, sustainability, and emerging markets provide pathways to long-term growth and profitability.
In the evolving global landscape, success will depend not just on expansion but on resilience, adaptability, and foresight — the ability to navigate uncertainty while seizing the immense potential the global market offers.

SPX | Daily Analysis #10 - 3 November 2025Hello and Welcome Back to DP,
Review & News Coverage:
Since our last SPX analysis, we mentioned that a broken trendline could open the door for downside movement. As we can see on the chart, the index fell toward the 1.68 Fibonacci zone before bouncing back.
This drop created about $44 of volatility — hopefully, you managed to catch that move! We had highlighted the 6811 area as a potential buy zone, and indeed, that level opened an opportunity for entries (I personally missed it since I needed more confirmation, but I hope some of you caught it).
From both the economic and political sides, several developments could shape SPX sentiment and direction:
Economic Calendar:
Monday: ISM Manufacturing PMI
Wednesday: ADP Non-Farm Employment Change & ISM Services PMI
Friday: Tentative Unemployment Rate
Stronger-than-expected data could strengthen the dollar and weigh on equities, while weaker readings may support a rebound if markets price in potential rate relief.
Political Landscape:
Watch for new announcements on funding negotiations or relief measures — any progress (or setback) in the government-shutdown talks could move markets.
The U.S. government shutdown remains a risk factor, with pressure building from expiring healthcare tax credits and food assistance programs.
And most importantly — keep an eye on “Trump’s Indicator” (his posts or tweets). His remarks often create sharp, short-term volatility across indices and sectors.
1H - 4H Technical Analysis:
On the charts, the SPX is struggling to regain upward momentum.
If price breaks the intraday trendline, room opens for a move down toward 6844 and 6829.
If those zones show strong volume and bullish candle patterns, we could look for buy entries around that range.
The key is to wait for confirmation — volume support and candle behavior will guide whether the market finds its footing or continues to slide.
Summary:
Short-term tone remains cautiously bullish while above 6811, but pressure remains from macro and political uncertainty.
Watch mid-week data and political headlines for volatility spikes.
Technical zones: Support 6829–6811, Resistance 6895–6920 (potential retest if sentiment turns).
Disclaimer:
This content is for informational purposes only and does not constitute financial or investment advice. © DIBAPRISM
Amir D.Kohn


US500How to become successful in forex and stock trading:
1.Master fundamentals and technical analysis.
2.Build and follow a solid trading plan.
3.Apply strict risk management (4–6% rule).
4.Stay disciplined—control fear and greed.
5.Record and analyze every trade.
6.Focus on high-quality setups only.
7.Diversify across assets and markets.
8.Keep evolving—study, adapt, and grow daily.
S&P 500 still holding From the weekly; this monster is still printing money. Stay in spot and you will see results. The green lines are my very likely Fibs. NFA so at the same time invest what you can afford to lose. Drop me a line later and request whatever long/shory macro/micro extensive analysis.
EURUSD - GBPUSD - BTC - AUDCAD - S&P500This weekly insights has a great possibility for a clear directions for

S&P 500 INDEX | Institutional Technical Analysis Masterpiece🔥 US500 S&P 500 INDEX | Institutional Technical Analysis Masterpiece | 6,843.7 🔥
📈 ELITE MULTI-TIMEFRAME BREAKDOWN | NOVEMBER 3-7, 2025 TRADING ROADMAP 📈
Current Level: 6,843.7 | Analysis Date: November 1, 2025, 00:54 UTC+4
Hello, TradingView community! 👋 The S&P 500 has been on an absolute tear, closing the week at a staggering 6,843.7 . The big question on everyone's mind is: Are we witnessing a final euphoric push before a correction, or is this simply a pause before the next leg up? This week, from November 3rd to 7th, will be critical.
Let's break down the multi-timeframe picture, blending classic theories with modern indicators to build a comprehensive trading plan for both intraday and swing traders. 🧠
═══════════════════════════════════════════════════════════════════
🎯 MARKET INTELLIGENCE EXECUTIVE SUMMARY
The S&P 500 stands at 6,843.7 , navigating a historic technical confluence zone that will determine the market's trajectory through year-end 2025. Our algorithmic and classical analysis fusion reveals bullish continuation potential with measured risk parameters. This week presents asymmetric opportunities as institutional positioning, technical patterns, and macro catalysts align for potentially explosive moves.
Critical Support Infrastructure: 🛡️
Immediate Floor: 6,820 - 6,830 (Algorithmic bid zone)
Secondary Base: 6,800 - 6,810 (Institutional accumulation)
Major Support: 6,750 - 6,770 (Weekly pivot nexus)
Ultimate Defense: 6,700 - 6,720 (Psychological fortress)
Resistance & Target Architecture: 🎯
First Ceiling: 6,860 - 6,870 (Intraday supply)
Secondary Wall: 6,900 - 6,910 (Round number magnet)
Breakout Zone: 6,950 - 6,970 (Pattern objective)
Major Extension: 7,000 - 7,020 (Psychological milestone)
═══════════════════════════════════════════════════════════════════
📊 WEEKLY TIMEFRAME (1W) - MACRO MARKET STRUCTURE
Elliott Wave Grand Architecture: 🌊
We're positioned in Minor Wave 3 of Intermediate Wave (5) within the secular bull market. The impulsive structure projects targets at 7,100-7,200 based on Fibonacci extensions. Critical validation: maintaining above 6,720 preserves the bullish count.
Primary Count: Wave 3 of (5) targeting 7,100
Alternative: Wave B of expanded flat, risk below 6,650
Invalidation: Weekly close below 6,600
Time projection: Completion by late November
Wyckoff Accumulation Schematic: 📚
Phase D - Markup Beginning
- Preliminary Supply (PSY): 6,920 tested
- Buying Climax (BC): 6,950 rejection
- Automatic Reaction (AR): 6,750 hold
- Last Point of Support (LPS): Current 6,843
- Sign of Strength (SOS): Pending above 6,870
Ichimoku Cloud Mastery: ☁️
Tenkan-sen: 6,815 (9-period support)
Kijun-sen: 6,780 (26-period base)
Senkou A: 6,850 (cloud top resistance)
Senkou B: 6,720 (cloud bottom support)
Chikou Span: Clear above price (bullish)
Cloud status: Thick and ascending
Advanced Harmonic Patterns: 🦋
Developing Bullish Gartley with precision ratios:
- XA leg: 6,500 to 6,950 (450 points)
- AB retracement: 0.618 at 6,672 ✅
- BC extension: Testing 0.786 at 6,845 (current)
- D completion: 0.786 XA at 6,850-6,870
- Target upon completion: 7,050-7,100
═══════════════════════════════════════════════════════════════════
📉 DAILY TIMEFRAME (1D) - SWING TRADING COMMAND CENTER
Japanese Candlestick Mastery: 🕯️
Yesterday's Doji Star at resistance signals equilibrium. Today's action critical:
- Close above 6,860 = Three White Soldiers continuation
- Close below 6,820 = Evening Star reversal warning
- Current bias: Neutral-bullish pending confirmation
Master Pattern Recognition:
Cup and Handle formation nearing completion:
- Cup low: 6,650 (October)
- Cup high: 6,920 (Recent peak)
- Handle forming: 6,820-6,870 range
- Breakout target: 7,190 (270-point measured move)
- Volume requirement: 25% above 20-day average
Bollinger Bands Configuration: 📊
Upper Band: 6,875 (immediate resistance)
Middle Band (20-SMA): 6,810 (dynamic support)
Lower Band: 6,745 (oversold boundary)
Band Width: Expanding (volatility increasing)
%B Indicator: 0.68 (upper half, bullish bias)
RSI Multi-Timeframe Analysis:
Daily RSI: 59 (room for upside)
Hidden bullish divergence vs price action
Support trend line from September intact
Resistance at 70 provides 11-point runway
═══════════════════════════════════════════════════════════════════
⚡ 4-HOUR TIMEFRAME (4H) - TACTICAL EXECUTION FRAMEWORK
Gann Theory Application: 📐
Current Gann Angles:
1x1: 6,825 (45-degree support)
2x1: 6,850 (current resistance)
1x2: 6,790 (major support)
Square of 9: 6,889 (next target)
Gann Box: 6,750-6,950 range
Time cycles: Nov 5 critical date
Dow Theory Confirmation Checklist: ✅
Primary Trend: Bullish (new highs achieved)
Secondary Trend: Consolidation/Correction
Volume Confirmation: Accumulation on dips
Breadth Analysis: 65% stocks above 50-DMA
Sector Rotation: Technology leading (bullish)
Transportation Confirmation: Pending
Moving Average Symphony:
- EMA 8: 6,838 (ultra-short support)
- EMA 21: 6,825 (short-term support)
- EMA 50: 6,810 (medium support)
- SMA 100: 6,785 (strong support)
- SMA 200: 6,750 (major trend support)
Pattern Alert: 🚨
Ascending Triangle resolution imminent:
- Horizontal resistance: 6,860-6,870
- Rising support: 6,820-6,830
- Apex convergence: November 4
- Breakout projection: 6,950+
═══════════════════════════════════════════════════════════════════
🎪 1-HOUR TIMEFRAME (1H) - PRECISION TRADING LABORATORY
Micro Pattern Development: 🔬
Double Bottom forming at 6,825:
- First bottom: 6,823 (10:00 UTC)
- Second bottom: 6,826 (14:00 UTC)
- Neckline resistance: 6,855
- Pattern target: 6,885 (30-point move)
VWAP Trading Matrix:
Daily VWAP: 6,841
Weekly VWAP: 6,825
Monthly VWAP: 6,795
Upper Band 1: 6,858 (first resistance)
Upper Band 2: 6,875 (second resistance)
Lower Band 1: 6,824 (first support)
Lower Band 2: 6,807 (second support)
Support & Resistance Precision Grid:
R4: 6,890 (Major resistance)
R3: 6,875 (Daily upper BB)
R2: 6,860 (Pattern neckline)
R1: 6,850 (Immediate resistance)
PIVOT: 6,843.7 (Current Price)
S1: 6,835 (Micro support)
S2: 6,825 (VWAP support)
S3: 6,810 (Major support)
S4: 6,795 (Monthly VWAP)
═══════════════════════════════════════════════════════════════════
⚡ 30-MINUTE TIMEFRAME (30M) - SCALPING COMMAND POST
Microstructure Analysis: 🎯
Bull Flag pattern developing:
- Pole: 6,810 to 6,855 (45 points)
- Flag consolidation: 6,835-6,845
- Breakout trigger: 6,846
- Target: 6,890 (45-point measured move)
Volume Profile Intelligence: 📊
POC (Point of Control): 6,837
VAH (Value Area High): 6,848
VAL (Value Area Low): 6,828
HVN (High Volume Node): 6,835-6,840
LVN (Low Volume Node): 6,855-6,860 (breakout zone)
Scalping Execution Zones:
Buy Zones:
• Zone 1: 6,835-6,838 (POC test)
• Zone 2: 6,828-6,831 (VAL support)
• Zone 3: 6,820-6,823 (Strong bid)
Sell Zones:
• Zone 1: 6,848-6,851 (VAH resistance)
• Zone 2: 6,858-6,861 (Supply zone)
• Zone 3: 6,868-6,871 (Major resistance)
═══════════════════════════════════════════════════════════════════
🏃 15-MINUTE & 5-MINUTE HYPERSPEED SCALPING
15-Minute Lightning Analysis: ⚡
Wedge pattern near apex:
- Upper trendline: 6,847
- Lower trendline: 6,839
- Breakout direction: 70% probability upward
- Quick target: 6,855 (+12 points)
- Stop: 6,835 (-8 points)
5-Minute Algorithmic Signals:
Long Entry Conditions:
RSI(5) < 30 AND Price > VWAP = BUY
MACD crossover AND Volume > Average = BUY
Price touches EMA(20) from above = BUY
Short Entry Conditions:
RSI(5) > 70 AND Price < VWAP = SELL
MACD crossunder AND High volume = SELL
Price rejected at resistance = SELL
Exit Rules:
Take profit: 8-10 points
Stop loss: 5-6 points
Time stop: 15 minutes max hold
Session Volatility Map: 🕐
Asian: 10-15 point range (quiet)
London Open: 20-30 point expansion
NY Premarket: 25-35 point volatility
NY Open: 40-50 point moves
NY Afternoon: 20-30 point consolidation
═══════════════════════════════════════════════════════════════════
📅 WEEKLY STRATEGIC FORECAST (NOVEMBER 3-7, 2025)
Monday, November 3: 🚀
Opening gap probability: 60% bullish
Strategy: Buy weakness to 6,830, target 6,870
Key levels: Support 6,820, Resistance 6,880
Expected range: 50 points
Tuesday, November 4: 🗳️
Election Day - Extreme volatility expected
Strategy: Straddle/strangle positions
Potential range: 6,750-6,920 (170 points!)
VIX spike likely above 25
Wednesday, November 5: 💥
Post-election directional resolution
Strategy: Trade the breakout aggressively
Bullish above 6,880 → Target 6,950
Bearish below 6,800 → Target 6,720
Thursday, November 6: 📊
FOMC minutes and economic data
Strategy: Fade first move, trade reversal
Expected consolidation: 6,850-6,900
Options gamma concentration: 6,875
Friday, November 7: 🎯
Weekly options expiration dynamics
Strategy: Theta decay trades around 6,850
Pin risk: 6,850 strike concentration
Weekly close above 6,870 = Bullish next week
═══════════════════════════════════════════════════════════════════
⚖️ INSTITUTIONAL RISK MANAGEMENT PROTOCOLS
Intraday Risk Framework: 🛡️
Position sizing: 0.5-1% risk per trade
Risk-Reward: Minimum 1:2.5 ratio
Daily loss limit: -2% portfolio max
Consecutive losses: 3 max, then pause
Profit trailing: 60% of maximum gain
Breakeven stop: At 10-point profit
Scaling strategy: 3 entries maximum
Swing Position Architecture: 💼
Core position: 50% at 6,820-6,830
Add-on levels: 25% at 6,800, 25% at 6,780
Stop loss: Below 6,750 (all positions)
Target 1: 6,900 (25% exit)
Target 2: 6,950 (35% exit)
Target 3: 7,000 (25% exit)
Runner: 7,050+ (15% hold)
═══════════════════════════════════════════════════════════════════
🔴 RISK SCENARIOS & CIRCUIT BREAKERS
Bearish Invalidation Levels: 🐻
15-min close below 6,835 = Micro caution
Hourly close below 6,820 = Intraday bearish
4H close below 6,800 = Swing bearish shift
Daily close below 6,750 = Trend reversal risk
Weekly close below 6,700 = Major bear signal
Tail Risk Considerations: 🦢
• Geopolitical shock (100+ point gap risk)
• Fed policy surprise (2-3% moves)
• Tech earnings disasters (sector rotation)
• Credit event contagion (systemic risk)
• AI bubble concerns (valuation reset)
═══════════════════════════════════════════════════════════════════
💎 ELITE CONFLUENCE TRADING ZONES
Premium Buy Zone: ✅
6,820-6,830
(Multi-timeframe support + Fibonacci 61.8% + VWAP + Moving average cluster)
Optimal Sell Zone: ❌
6,870-6,880
(Resistance confluence + Pattern targets + Round number + Options barrier)
Breakout Trigger: 🚀
6,870-6,875
(Triangle apex + Bollinger Band + Volume breakout zone)
═══════════════════════════════════════════════════════════════════
🏆 MASTER TRADER'S FINAL VERDICT
The S&P 500 at 6,843.7 presents a high-conviction bullish opportunity with exceptional risk-reward dynamics. Technical confluence across multiple timeframes, combined with constructive market internals and seasonal factors, supports upside continuation toward 6,900-6,950 initially, with 7,000+ potential.
Top 3 Highest Probability Trades: 🎯
Swing Long: 6,820-6,830 → Target: 6,950 (RR 1:4)
Breakout Long: Above 6,870 → Target: 6,920 (RR 1:3)
Scalp Long: VWAP 6,841 → Target: 6,855 (RR 1:2.5)
Trading Wisdom: 🧠
Position for probability, not possibility. Size for survival, not home runs. The best traders are risk managers who happen to trade.
"Markets can remain irrational longer than you can remain solvent. Trade the chart, not the opinion!" 💡
═══════════════════════════════════════════════════════════════════
📍 ACTIONABLE INTELLIGENCE SUMMARY
Bull market intact above 6,750. Accumulate dips toward 6,820. Target 7,000 by month-end. Risk management is paramount during election week volatility.
Trade with discipline. Prosper with patience. 💰
═══════════════════════════════════════════════════════════════════
#SPX #SP500 #US500 #TechnicalAnalysis #Trading #StockMarket #Indices #DayTrading #SwingTrading #ElliottWave #Wyckoff #HarmonicPatterns #OptionsTrading #VIX #MarketStructure #OrderFlow #InstitutionalTrading #AlgorithmicTrading #TradingView #MarketForecast #SPY #ES_F
🔔 Follow for Institutional-Grade Analysis | Precision • Discipline • Profits 📊
Disclaimer: This analysis is educational only. Trading carries substantial risk of loss. Past performance does not guarantee future results. Always conduct independent research and employ proper risk management.

Understanding the Concept of Exotic OptionsIntroduction: Beyond the Vanilla Options
In the world of derivatives trading, options are among the most powerful instruments available to investors. Traditional or “vanilla” options—such as calls and puts—are already versatile tools for hedging and speculation. However, as financial markets evolved, traders and institutions began to seek more sophisticated instruments that could offer customized payoffs, align with complex risk management needs, or exploit specific market views. This need gave birth to a more advanced class of derivatives known as exotic options.
Exotic options go beyond the standard payoff structure of vanilla options. They can depend on multiple underlying assets, trigger conditions, time periods, or paths that prices follow. These options have become integral in structured products, risk management, and tailored investment strategies, particularly in global forex, commodity, and equity-linked markets.
This essay explores the concept, types, valuation, applications, advantages, and risks of exotic options—providing a comprehensive understanding of how these instruments work in modern finance.
1. What Are Exotic Options?
Exotic options are non-standard derivative contracts that have complex features differentiating them from traditional options. While vanilla options grant the right to buy (call) or sell (put) an asset at a predetermined strike price before or at expiration, exotic options can alter how and when payoffs are determined.
They may:
Depend on the path of the underlying asset’s price, not just its final value.
Have multiple exercise or settlement dates.
Involve different underlying assets or currencies.
Include barriers, averages, or digital features that modify payouts.
For instance, a barrier option may only become active (“knock-in”) or inactive (“knock-out”) if the underlying price crosses a specified level. Similarly, an Asian option’s payoff depends on the average price of the underlying over time, reducing volatility effects.
Exotic options are thus tailored to specific investor needs—allowing hedgers or speculators to fine-tune their exposure to price movements, volatility, and time decay.
2. Evolution and Market Use
The development of exotic options traces back to the late 1970s and 1980s, when financial innovation surged alongside advances in computing and quantitative finance. Early forms appeared in the foreign exchange and commodity markets, where traders needed customized hedging tools to manage complex exposures.
By the 1990s, exotic options became a cornerstone of structured finance, used by investment banks to create tailor-made products for corporate clients and high-net-worth investors.
Today, exotic options are found across:
Currency markets (FX options): Commonly used for hedging exchange rate risks.
Commodity markets: To manage exposure to volatile prices.
Equity-linked notes and structured products: For customized return profiles tied to indices or stock baskets.
Interest rate and credit derivatives: To hedge rate movements or credit events.
Exotic options have thus evolved from niche instruments into mainstream financial engineering tools—allowing traders to achieve precise risk-return outcomes that vanilla options cannot offer.
3. Key Characteristics of Exotic Options
Exotic options differ from vanilla options through unique features such as:
a. Path Dependency
In vanilla options, only the final price of the underlying asset matters. In exotic options, however, the entire price path may influence the payoff.
Example: In an Asian option, the payoff depends on the average price over time, not the terminal price at expiration.
b. Conditional Payoffs
Many exotic options include “if-and-only-if” conditions. For instance:
Barrier options activate or deactivate based on price thresholds.
Lookback options depend on the maximum or minimum price achieved during the option’s life.
c. Multi-Asset Dependence
Some exotic options depend on more than one underlying, such as currency pairs, indices, or stock baskets.
Example: A basket option may be based on the average performance of multiple assets.
d. Complex Exercise Rules
Unlike American or European options, some exotics allow customized exercise schedules or partial exercises tied to specific market events.
e. Tailored Payout Structures
Payoffs can be linear, binary, capped, or floored—allowing unique risk-reward combinations suited to specific strategies.
4. Major Types of Exotic Options
There are numerous exotic options, but the following categories are among the most common and important:
a. Barrier Options
Barrier options are activated or extinguished when the underlying asset hits a certain level.
Types include:
Knock-in options: Become active only if the price crosses the barrier.
Knock-out options: Become void if the barrier is breached.
Double-barrier options: Have both upper and lower thresholds.
These are popular in currency and commodity markets due to their cost-effectiveness and targeted exposure.
b. Asian Options
Also known as average options, these derive their value from the average price of the underlying over a period.
They are used to smooth out volatility and reduce the impact of short-term price swings—ideal for commodities or volatile assets.
c. Lookback Options
Lookback options allow the holder to “look back” over the life of the option to determine the optimal strike or payoff.
For instance, the holder of a lookback call can buy at the lowest price observed during the option period.
These are valuable for volatility trading and performance-linked bonuses, but are more expensive due to the flexibility they provide.
d. Binary (Digital) Options
Binary options provide all-or-nothing payouts. If a condition is met (for example, the asset price exceeds the strike), a fixed amount is paid; otherwise, nothing is received.
They are used in speculative trading and hedging against specific events (like rate announcements or price thresholds).
e. Compound Options
A compound option is an option on another option. There can be four variants—call on call, call on put, put on call, and put on put.
These are primarily used by institutional investors managing portfolios of options or structured exposures.
f. Chooser Options
These allow the holder to decide, at a future date, whether the option will be a call or put.
They are ideal for hedging uncertainty, especially in situations where the future direction of prices is unclear.
g. Rainbow or Basket Options
These depend on multiple underlying assets. The payoff may be linked to the best or worst performer, or an average of all.
Used widely in equity-linked structured products to diversify exposure.
h. Barrier-Rebate and Range Options
In these, the payoff depends on whether the price stays within a certain range or hits a barrier, sometimes offering a rebate if deactivated.
5. Pricing and Valuation Challenges
Pricing exotic options is more complex than pricing vanilla ones because of path dependency and non-linear payoffs. Traditional Black-Scholes models are insufficient for many exotics. Instead, advanced methods such as:
Monte Carlo simulation (for path-dependent options),
Binomial or trinomial tree models (for barrier options),
Finite difference methods (for solving partial differential equations),
are used for accurate valuation.
Moreover, the valuation must incorporate:
Volatility skew and smile effects,
Interest rate differentials (especially in FX exotics),
Time decay and path volatility, and
Counterparty credit risks.
Due to these complexities, exotic option trading is typically limited to institutional investors and quantitative traders with access to robust pricing models and computing power.
6. Strategic Applications in Markets
Exotic options play several strategic roles in modern finance:
a. Risk Management
Corporations use them to hedge specific exposures that vanilla options cannot cover efficiently. For example:
A company importing oil may use an Asian call to hedge against the average price rather than the spot price.
Exporters use barrier options to hedge currency risks only if extreme price movements occur.
b. Yield Enhancement
Investors seeking higher returns may purchase structured products embedding exotic options (like range accrual notes) that provide enhanced coupons tied to certain price conditions.
c. Speculation and Arbitrage
Traders exploit exotic options to speculate on volatility, correlations, or price ranges rather than pure direction.
For instance, digital options allow bets on whether a price will surpass a level by expiration.
d. Structured Product Design
Exotic options form the building blocks of many structured investment products—such as equity-linked notes, autocallables, and principal-protected instruments—allowing issuers to customize payoffs.
7. Advantages of Exotic Options
Customization: Can be precisely structured to match unique market views or hedge specific risks.
Cost Efficiency: Often cheaper than vanilla options offering similar exposures due to conditional triggers.
Strategic Flexibility: Allow exposure to volatility, time, or correlation rather than simple price direction.
Diversification: Multi-asset or path-based structures provide diversification benefits.
Creative Payoffs: Enable innovative investment products appealing to both retail and institutional investors.
8. Risks and Limitations
While attractive, exotic options carry significant risks:
a. Complexity Risk
The intricate payoff structures make them hard to value or understand, leading to potential mispricing.
b. Liquidity Risk
Most exotic options are over-the-counter (OTC) products, not exchange-traded, hence low liquidity and wider bid-ask spreads.
c. Counterparty Risk
Since many trades are bilateral, there is always the possibility of default by the counterparty.
d. Model Risk
Valuation depends on complex models and assumptions about volatility, correlation, and interest rates. Incorrect assumptions can lead to misestimation of fair value.
e. Regulatory and Transparency Issues
Post-2008, regulators have tightened rules around complex derivatives, requiring greater disclosure and collateralization. Yet, transparency remains limited compared to exchange-traded instruments.
9. Real-World Examples
Currency Knock-Out Options: Commonly used by multinational corporations to hedge FX exposure cost-effectively.
Asian Options in Oil Markets: Used by airlines to manage jet fuel price volatility.
Autocallable Notes: Retail structured products embedding digital and barrier options that offer enhanced coupons but risk early termination.
These examples show how exotic options have integrated into mainstream hedging and investment frameworks, providing flexibility and innovation.
10. The Future of Exotic Options
With the rise of AI, quantitative finance, and data-driven analytics, the design and pricing of exotic options are becoming increasingly sophisticated. Innovations in machine learning, stochastic volatility models, and blockchain-based smart derivatives promise to make exotic options more transparent and accessible.
However, the challenge remains balancing complexity with clarity. Regulators and financial educators are emphasizing the need for greater transparency and investor awareness to prevent misuse or misunderstanding of such instruments.
Conclusion
Exotic options represent the pinnacle of financial innovation—a class of derivatives that blend mathematics, creativity, and risk management into one. They extend beyond the simplicity of vanilla options, allowing investors to capture nuanced market scenarios, hedge complex exposures, or design innovative return profiles.
However, their sophistication also brings inherent risks—especially in valuation, liquidity, and counterparty exposure. As global markets evolve, the role of exotic options continues to expand, bridging the gap between customized investment strategies and advanced financial engineering.
In essence, understanding exotic options is not merely about mastering a financial product—it’s about appreciating how modern finance tailors risk, reward, and imagination into instruments that shape the dynamics of the global derivatives market.
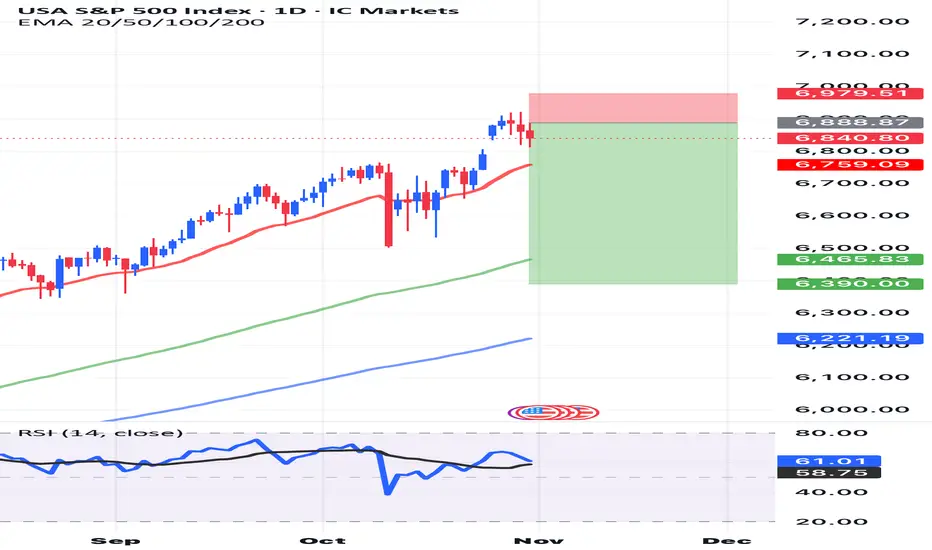
US500 Strong Bullish MomentumFundamental Analysis
The current bullish trajectory of the US500, is overwhelmingly earnings driven. Robust Q3 corporate results, notably massive beats from tech and consumer giants like Apple with record iPhone sales and services, Amazon’s cloud revenue surge , have provided a decisive fundamental lift. This resilient performance has overshadowed macro uncertainties around Fed policy caution, trade tensions and cemented investor confidence in double digit earnings growth projections for 2026. The rally is characterized by solid breadth, extending beyond mega caps to sectors like Energy, suggesting a durable economic foundation.
Technical Analysis
The US500 exhibits strong bullish momentum, on track for its best monthly streak in years. The index is testing a critical resistance zone between 6,885 and 6,890, formed by the convergence of long-term trend lines. A confirmed weekly close decisively above 6,900 is necessary to validate a powerful breakout toward the psychological 7,000 level and signal an acceleration in the uptrend. Short term downside is currently contained by strong support levels, indicating that pullbacks are likely to be met with active dip buying.
Outlook
The overall outlook for the US500 is constructively bullish into year end. As positive earnings guidance reinforces investor sentiment, the path of least resistance remains higher. However, given the proximity to all time highs and critical technical resistance, short-term volatility and consolidation are likely as the market digests the risk of stretched valuations e.g. (Nvidia's high GDP ratio is a notable concern) before attempting a sustainable move toward the 7,000 mark.
Analysis is by Terence Hove, Senior Financial Markets Strategist at Exness


What Is CPI and Why It Matters GloballyIntroduction: The Pulse of the Global Economy
In the complex world of economics, few indicators hold as much influence and significance as the Consumer Price Index (CPI). Whether it’s a policymaker setting interest rates, an investor predicting market movements, or an ordinary consumer noticing rising grocery bills, CPI plays a role in everyone’s financial life. It acts as a mirror reflecting changes in the cost of living and inflation, shaping everything from global monetary policies to household budgets.
Simply put, CPI measures how much prices have increased or decreased for a basket of goods and services that consumers typically buy. However, behind this simple concept lies a powerful tool that helps nations assess economic stability, business competitiveness, and the real purchasing power of their citizens.
Understanding CPI: The Basics
The Consumer Price Index (CPI) is an economic indicator that measures the average change in prices of a fixed basket of goods and services over time. This basket includes everyday items such as food, housing, clothing, healthcare, transportation, and education — essentially capturing the spending habits of urban consumers.
CPI as a Measure of Inflation
CPI is the most widely used tool to measure inflation — the general increase in prices and fall in the purchasing power of money.
When CPI rises steadily, it indicates inflation; when it falls, it suggests deflation.
Inflation can be both a sign of growth and a warning signal. Moderate inflation encourages spending and investment, as people prefer to buy now rather than later. But excessive inflation — as seen in countries like Argentina or Turkey in recent years — erodes savings, raises borrowing costs, and destabilizes economies.
Conversely, deflation (a sustained drop in prices) might sound appealing but can trigger economic stagnation. Falling prices reduce business revenues and wages, discouraging spending and investment.
Thus, tracking CPI helps governments strike a delicate balance between economic growth and price stability.
Types of CPI
Economists often use different versions of CPI to capture varied aspects of price changes:
Headline CPI:
This is the broadest measure, including all goods and services in the consumer basket. It reflects the overall inflation rate but can be volatile due to changes in food and energy prices.
Core CPI:
Excludes food and energy components, as they are prone to short-term fluctuations. Core CPI gives a clearer picture of long-term inflation trends.
CPI-W and CPI-U (in the U.S.):
CPI-W tracks the spending habits of urban wage earners and clerical workers.
CPI-U includes all urban consumers and is considered the official measure of inflation.
HICP (Harmonized Index of Consumer Prices):
Used by the European Union, this version allows for consistent inflation comparisons across member states.
Each variation of CPI serves a specific policy or analytical purpose, allowing economists to monitor inflation more accurately across different sectors and regions.
CPI and Global Monetary Policy
CPI plays a central role in shaping global monetary policy.
Central banks like the Federal Reserve (U.S.), European Central Bank (ECB), Bank of England, and the Reserve Bank of India (RBI) rely on CPI trends to make key decisions about interest rates and money supply.
When CPI shows rising inflation, central banks often raise interest rates to cool down spending and borrowing.
When CPI indicates deflation or weak inflation, they lower rates to stimulate economic activity.
For instance, during the COVID-19 pandemic, global CPI levels dropped as demand collapsed. Central banks responded with historically low interest rates and massive stimulus packages.
However, post-pandemic supply chain disruptions and energy shortages sent CPI soaring globally — prompting rapid interest rate hikes in 2022–2023.
These fluctuations show how closely CPI data influences global financial stability, currency values, and investment decisions.
CPI and Purchasing Power
CPI also helps determine changes in purchasing power — how much goods and services a unit of currency can buy.
If wages rise slower than CPI, real income effectively decreases, meaning consumers can buy less with the same money.
For example:
If CPI rises by 6%, but wages increase by only 3%, then real wages have fallen by 3%.
This erosion in purchasing power can reduce consumer confidence and spending — key drivers of economic growth.
Governments and labor unions often use CPI data to adjust wages, pensions, and social benefits (a process called indexation) to maintain people’s living standards.
CPI as a Global Benchmark
CPI data is not just a domestic concern — it has international ramifications.
Global investors, financial institutions, and multinational corporations all monitor CPI across different countries to assess economic health and currency risks.
Here’s how:
Exchange Rates:
High inflation (rising CPI) typically weakens a nation’s currency because it erodes purchasing power. Investors may move money to countries with lower inflation and higher returns, affecting foreign exchange markets.
Investment Flows:
CPI trends help guide foreign direct investment (FDI) and portfolio investment decisions. For instance, a stable CPI and moderate inflation attract investors seeking predictable returns.
Trade Competitiveness:
Countries with lower inflation maintain price stability in exports, making their goods more competitive globally. Conversely, high CPI growth can make exports expensive and hurt trade balances.
Thus, CPI serves as a universal barometer for comparing economic conditions across nations.
CPI and the Financial Markets
The stock market, bond market, and commodity markets react strongly to CPI reports.
Traders and investors treat CPI announcements as key economic events because they directly influence interest rate expectations and corporate profitability.
Equity Markets:
Rising CPI may hurt company profits by increasing input costs. However, certain sectors — like energy, commodities, and consumer staples — often benefit during inflationary periods.
Bond Markets:
Bonds are highly sensitive to inflation. When CPI rises, bond yields increase because investors demand higher returns to offset the loss of purchasing power. This inversely affects bond prices.
Commodity Markets:
Commodities such as gold and crude oil often act as inflation hedges. A high CPI can push investors toward tangible assets that retain value when currencies lose purchasing power.
Thus, CPI data can trigger short-term volatility and long-term investment strategy shifts across asset classes.
Limitations of CPI
While CPI is an essential tool, it’s not without flaws. Economists often debate its accuracy and representativeness due to several factors:
Substitution Bias:
Consumers tend to switch to cheaper alternatives when prices rise, but CPI assumes a fixed basket — overstating inflation.
Quality Adjustments:
Technological improvements often increase product quality (e.g., smartphones), but CPI may not fully capture this added value.
Geographical Variations:
Price changes differ between regions. Urban CPI may not accurately reflect rural cost-of-living changes.
Lagging Indicator:
CPI measures inflation after it has occurred, meaning policymakers are often reacting to past data.
Exclusion of Certain Costs:
CPI may exclude investment assets like real estate or stocks, even though they significantly affect household wealth.
Despite these limitations, CPI remains the most reliable and widely accepted inflation measure because of its consistency and comparability.
Case Studies: CPI in Action
1. United States: Inflation and Federal Reserve Policy
In 2022, U.S. CPI surged above 9%, the highest in four decades. Rising food, fuel, and housing costs prompted the Federal Reserve to raise interest rates aggressively throughout 2022–2023. This decision cooled inflation but also slowed economic growth and rattled stock markets.
It showcased how CPI data can reshape monetary strategy and ripple through global markets.
2. India: Balancing Growth and Inflation
India’s CPI basket is heavily weighted toward food and housing. When food prices rise due to poor monsoon or supply shortages, CPI spikes quickly.
The RBI uses CPI as its main inflation target, aiming to keep it between 2–6%. By adjusting repo rates based on CPI trends, the RBI manages both growth and price stability.
3. Eurozone: The Battle with Deflation and Energy Prices
For years, the Eurozone struggled with low inflation and deflation risks, prompting the ECB to maintain ultra-low interest rates. However, after the Ukraine conflict in 2022, energy-driven CPI spikes forced the ECB to tighten policy sharply.
This swing illustrated CPI’s impact on regional economic integration and fiscal coordination.
CPI in the Context of Global Challenges
Today’s world faces unprecedented inflationary pressures due to factors like:
Geopolitical conflicts (e.g., Russia–Ukraine)
Supply chain disruptions
Energy market volatility
Climate change impacting agriculture
Post-pandemic demand surges
As a result, global CPI data has become a critical early warning system for potential recessions, stagflation, or monetary tightening cycles.
International institutions such as the IMF and World Bank rely on CPI trends to forecast global growth and recommend policy adjustments.
Future of CPI: Adapting to a Changing Economy
As consumption habits evolve, CPI calculations must also adapt. The rise of digital goods, subscription services, and AI-driven economies is reshaping how statisticians define the “consumer basket.”
Future CPI methodologies may include:
Real-time price tracking using big data and AI
Regional CPI dashboards for urban and rural contrasts
Inclusion of environmental costs and green inflation (the impact of climate policies on prices)
Better adjustments for technological improvements
Such innovations will make CPI a more accurate, dynamic, and inclusive measure of global inflation.
Conclusion: The Global Significance of CPI
The Consumer Price Index is more than just a number; it is the heartbeat of the world economy. It influences how central banks set interest rates, how investors allocate capital, how governments plan budgets, and how families manage their daily expenses.
Understanding CPI is crucial not only for economists but for anyone navigating an interconnected global economy. Whether inflation is surging or stabilizing, CPI tells the story of how value, consumption, and confidence move together in shaping our economic future.
In a world of shifting trade patterns, volatile energy markets, and evolving digital economies, CPI remains the compass that helps policymakers, businesses, and citizens alike find direction amid economic uncertainty.
