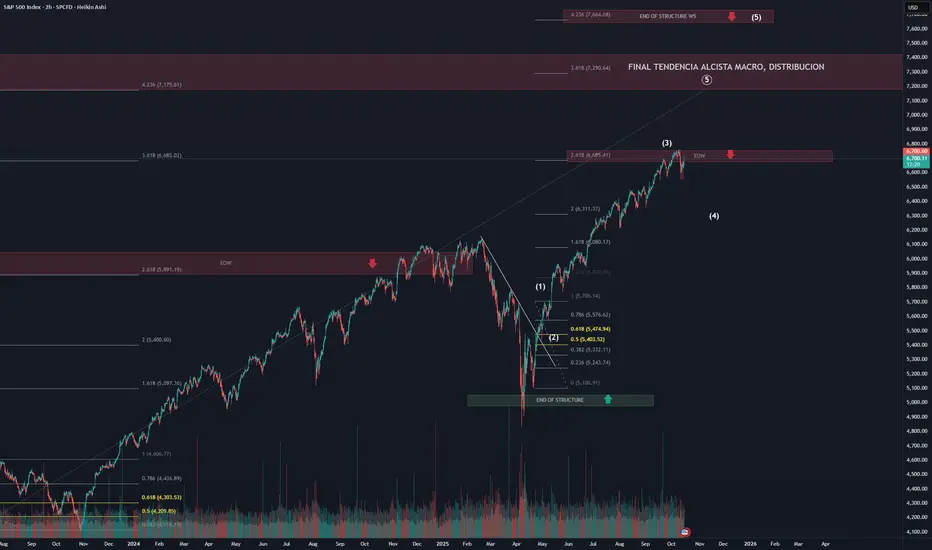
SPX Bullish Trend / Elliot analysisOur analysis of this index suggests that we are currently in the development of a Wave 4 (W4) within the last bullish substructure of the macro fifth wave, where, in the long term, we could potentially see the end of the trend between the 7100 and 7600 levels.
At the moment, the price appears to be moving within the final substructure, which seems about to begin a Wave 4 (W4) correction.
💡 This is just my opinion — always remember to do your own analysis!
Trade ideas
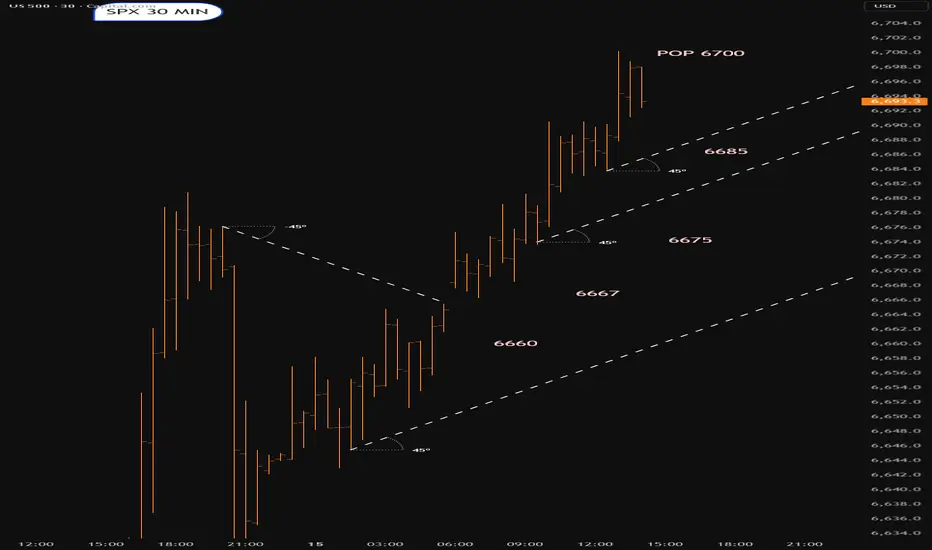
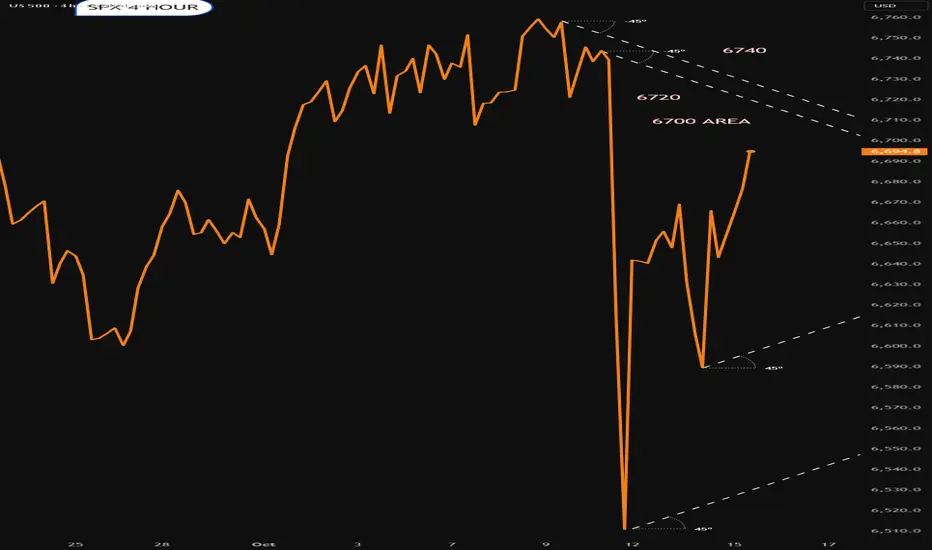
Less bars ...More tequilaGo up a timeframe.Much clearer.I have ignored a spike downwards.6700 to pop.?
S{X looking a tad over stretched/ short termCareful...Looks a tad over stretched.Could still pump though.Lets see what happens


SPX500USD | Daily Analysis #3**Yesterday Review**
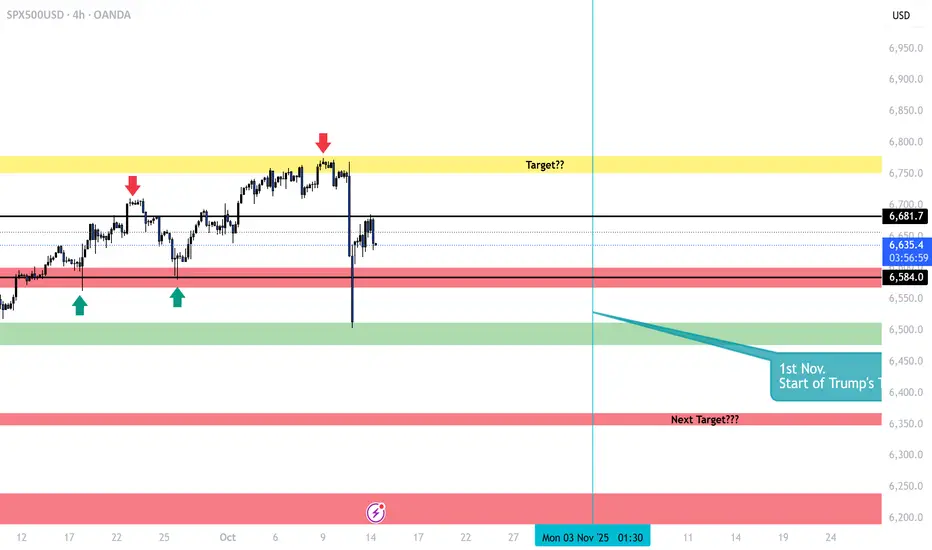
As observed, the index reacted to the 6682 zone, and news from China stating, "China will maintain tariffs until the end," fueled the market with sellers, pushing the price to the lower zone at 6584. In the morning of the New York session, it appeared that Trump realized the importance of offering a positive signal or message, or the index would suffer significantly. After a strong battle between buyers and sellers on the 1-hour timeframe, the price began to rise, driven by buying pressure.
During the middle of the New York session, Trump found an opportunity to provide some optimism, announcing a scheduled meeting with Chinese President Xi in South Korea on November 1st to discuss trade matters. (This could be a significant day.) This news contributed to a bounce, pushing the price back up to 6682.
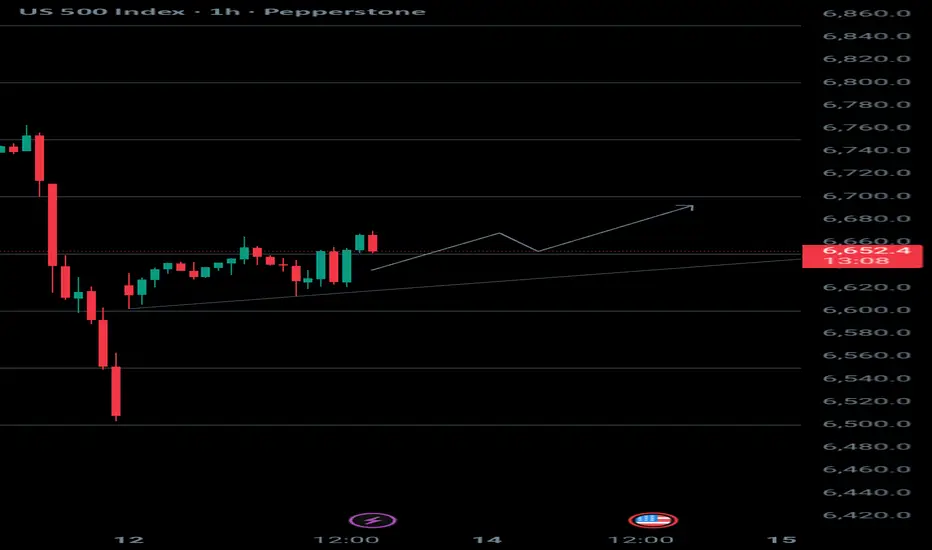
**1-Hour & 4-Hour Timeframes**
On the 1-hour timeframe, two potential patterns are forming. One is a box range between 6682 and 6585, and the other is an upward trend channel. However, neither pattern is fully respected due to limited confirmation.
On the 4-hour timeframe (although I cannot share an image here), if you draw two lines—one starting from February 25, 2025, and the other from August 12, 2025—and extend them to the right, you'll notice a clear respect and relationship between these lines.
**Current Situation**
As of the time I am posting this analysis, the price is currently testing below the trendline, and we are awaiting a reaction. If the index, with or without further news, breaks the 6682 zone or the trendline strongly, we could expect the price to reach the 6672 zone. On the other hand, if the price respects the box or the upward trend channel, the index may find support and rise toward the 6604 area.

How Spot Forex Trading Works1. Understanding the Concept of Spot Forex Trading
Spot Forex trading, also known as spot FX, refers to the direct exchange of one currency for another at the current market rate, known as the spot price. Unlike futures or options contracts, where settlement happens at a later date, a spot transaction is settled “on the spot”, typically within two business days (T+2) for most currency pairs.
The Forex market is the largest and most liquid financial market globally, with a daily trading volume exceeding $7 trillion. It operates 24 hours a day, five days a week, allowing traders from around the world to speculate on currency price movements. Spot Forex trading forms the foundation of global currency trading, providing real-time exchange of currencies between participants such as banks, corporations, investors, and retail traders.
2. The Participants in the Spot Forex Market
The Spot Forex market involves multiple participants who trade for different purposes:
Central Banks – Manage currency reserves, stabilize exchange rates, and implement monetary policies.
Commercial Banks and Financial Institutions – Facilitate interbank trading and currency exchange for clients.
Multinational Corporations – Exchange currencies for international trade and investment purposes.
Hedge Funds and Investment Firms – Engage in speculative trading to profit from currency fluctuations.
Retail Traders – Individuals using online platforms to speculate on short-term price movements.
Each participant contributes to market liquidity, influencing price dynamics based on supply and demand.
3. Currency Pairs and Price Quotation
In the Forex market, currencies are always traded in pairs, such as EUR/USD, GBP/JPY, or USD/INR. The first currency is the base currency, and the second is the quote currency.
The price quote represents how much of the quote currency is required to buy one unit of the base currency. For example, if EUR/USD = 1.0900, it means 1 Euro = 1.09 US Dollars.
Each pair has:
Bid Price – The price at which the market (or broker) is willing to buy the base currency.
Ask Price – The price at which the market (or broker) is willing to sell the base currency.
The difference between these two is called the spread, which represents the broker’s commission or transaction cost.
4. How Spot Forex Transactions Are Executed
Spot Forex trading operates through over-the-counter (OTC) networks rather than centralized exchanges. When a trader places a buy or sell order on a trading platform, the broker executes it through liquidity providers or the interbank market.
For instance, if a trader buys EUR/USD, they are effectively buying Euros while selling US Dollars at the current spot rate. The transaction is typically settled within T+2 days, though in practice, many brokers offer rolling spot contracts, which are automatically extended daily for speculative purposes.
Execution types include:
Market Orders – Executed instantly at the best available price.
Limit Orders – Executed when the market reaches a specified price level.
Stop Orders – Triggered when the price crosses a set threshold to limit losses or capture breakouts.
5. The Role of Leverage in Spot Forex Trading
Leverage is one of the most distinctive features of the Forex market. It allows traders to control large positions with relatively small amounts of capital. For example, a 1:100 leverage ratio means that a trader can control a $100,000 position with only $1,000 of margin.
While leverage amplifies potential profits, it also magnifies losses, making risk management essential. Professional traders typically use moderate leverage and implement stop-loss mechanisms to protect against adverse movements.
Regulators in different regions impose varying limits on leverage — for example, 1:30 in the EU (ESMA regulations) and 1:50 in the US.
6. Determinants of Spot Forex Prices
Spot exchange rates are influenced by numerous macroeconomic, geopolitical, and technical factors:
Interest Rate Differentials: Higher interest rates attract foreign capital, boosting demand for the currency.
Economic Indicators: GDP growth, employment data, inflation, and trade balances affect currency valuation.
Central Bank Policies: Monetary tightening or loosening directly impacts currency strength.
Political Stability: Political risk or uncertainty weakens investor confidence, depreciating the currency.
Market Sentiment and Speculation: Traders’ collective expectations drive short-term fluctuations.
Global Events: Wars, pandemics, and natural disasters can trigger volatility across the Forex market.
In short, Forex prices are a reflection of global economic health and investor confidence.
7. Profit and Loss Calculation in Spot Forex
The profit or loss in a spot Forex trade is determined by the change in exchange rate between the time the position is opened and closed.
For example, if a trader buys EUR/USD at 1.0900 and sells it later at 1.1000, they gain 100 pips (the fourth decimal point represents a pip in most pairs).
Profit calculation formula:
Profit (USD)
=
Pip Movement
×
Lot Size
×
Pip Value
Profit (USD)=Pip Movement×Lot Size×Pip Value
For a standard lot (100,000 units), one pip in EUR/USD equals $10. Thus, a 100-pip move equals $1,000 profit.
Conversely, if the trade moves against the trader, losses occur at the same rate. Hence, understanding position sizing and pip value is crucial for effective risk management.
8. Settlement and Delivery in Spot Forex
While traditional spot Forex transactions involve physical delivery of currencies within two business days, retail traders rarely take delivery. Instead, brokers provide contract-based trading that simulates real exchange but is settled through cash differences in profit or loss.
For institutional participants, however, settlement occurs through systems like CLS (Continuous Linked Settlement), which eliminates settlement risk by synchronizing payments between major financial institutions globally.
Thus, while the spot market technically implies immediate delivery, in practice, most participants engage for speculative or hedging purposes without currency delivery.
9. Risk Management in Spot Forex Trading
Spot Forex trading carries inherent risks due to volatility, leverage, and unpredictable global events. To mitigate these, traders adopt structured risk management strategies:
Stop-Loss and Take-Profit Orders – Automatically close positions at predefined levels to control losses or lock in profits.
Position Sizing – Limiting trade size relative to account equity, often 1–2% per trade.
Diversification – Avoiding concentration in one currency pair or region.
Economic Calendar Monitoring – Tracking major events like central bank meetings and GDP releases to anticipate volatility.
Technical and Fundamental Analysis – Combining chart patterns with macroeconomic insights to make informed decisions.
Effective risk management ensures long-term sustainability and consistent returns in the Forex market.
10. Advantages and Challenges of Spot Forex Trading
Advantages:
High Liquidity: Tight spreads and minimal slippage due to massive global participation.
24/5 Availability: Traders can operate across global time zones without limitation.
Low Entry Barriers: Retail traders can start with small capital using micro or mini accounts.
Leverage Access: Enables higher market exposure with limited funds.
No Centralized Exchange: Global accessibility through OTC trading networks.
Challenges:
High Volatility: Sharp fluctuations can trigger significant losses.
Leverage Risk: Over-leveraging can wipe out accounts quickly.
Information Overload: Constant economic updates require active monitoring.
Broker Reliability: Unregulated brokers pose counterparty risks.
Psychological Pressure: Emotional control is essential for success in a fast-paced market.
Despite these challenges, spot Forex trading remains one of the most popular avenues for both institutional and retail investors due to its liquidity, flexibility, and potential for profit.
Conclusion
Spot Forex trading represents the core of the global currency market, enabling participants to exchange currencies directly at real-time rates. Its structure—comprising major participants, dynamic pricing, leverage, and decentralized execution—creates immense opportunities and risks alike. Understanding how the market functions, the economic forces behind exchange rates, and effective risk management techniques is crucial for success. Whether used for speculation, hedging, or international trade, the Spot Forex market remains a cornerstone of global finance, reflecting the heartbeat of the world’s economic and political landscape.
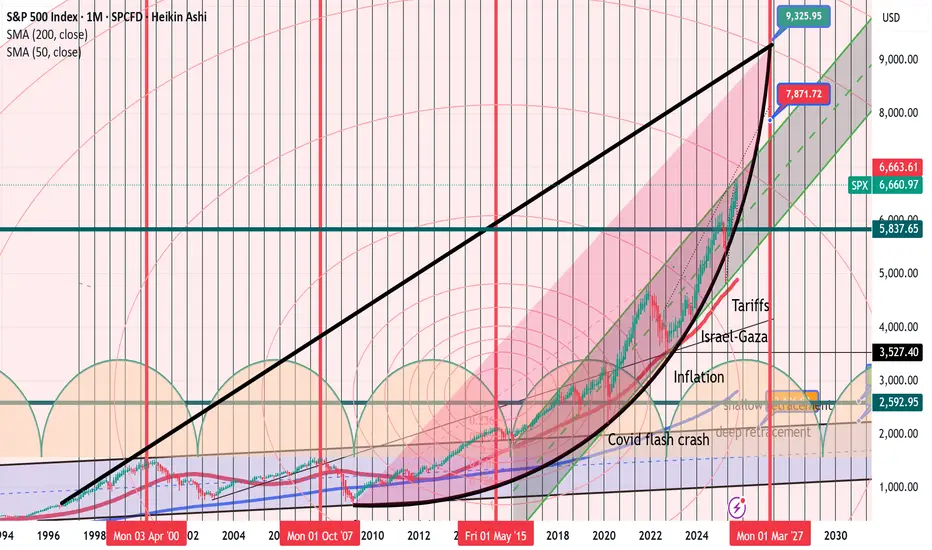
Small fish follow the streamUpdate: My best case scenario. 9000 points in a massive bull run that started in 2009. Hyperbolic move since then.
Top in March 2027
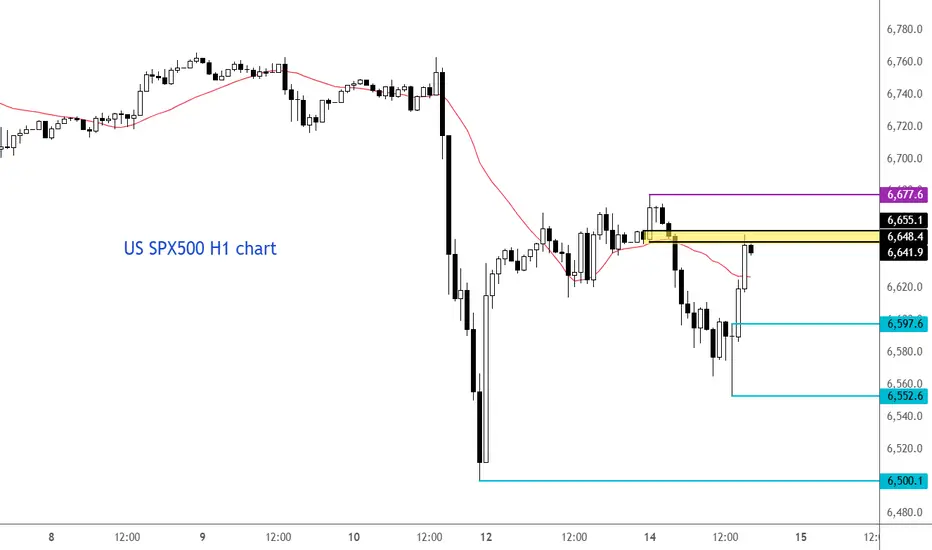
S&P 500 testing resistance after bouncing off lowsMarkets recovered sharply from their earlier lows on the back of comments from US Trade Representative Jamieson Greer, who told CNBC that Donald Trump was still set to meet Chinese premier Xi Jinping. But it remains to be seen whether the US and China will come to some sort of an agreement, perhaps an extension of the tariff truce. That scenario looks more likely than a complete breakdown into a full-blown trade war. However, the risks are undeniably rising.
Anyway, the SPX500 is now testing key resistance here between 6648 to 6655, marked in yellow on the chart. Unless it goes on to make a higher high above 6677 on this hourly chart, and hold above it, there is still the risk we could see another dip as we head deeper in the US session.
By Fawad Razaqzada, market analyst with FOREX.com
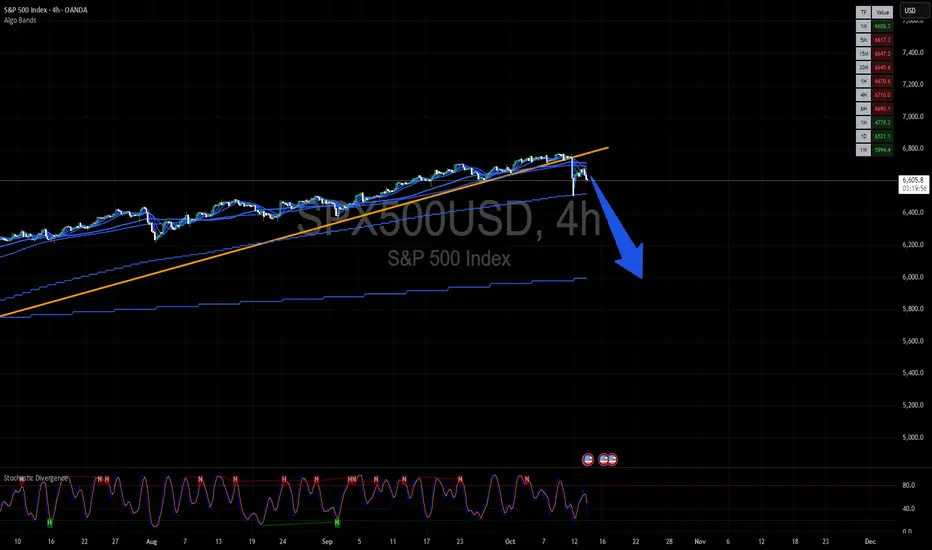
S&P 500 The Bull Run Is Over. Watch the Yellow Level.The S&P 500 rally looks exhausted.
Over the past week, momentum has clearly faded, lower highs, weaker daily closes, and stronger selling pressure on each bounce.
Technically, the market shows early signs of a shift from bullish to corrective or bearish.
The Yellow Level acts as a divider between a mildly bullish market and the start of a medium-term bearish phase.
Above the Yellow Level: price may hold short-term strength or consolidation.
Below the Yellow Level: structure breaks down and downside potential expands.
A daily close below the Yellow Level would confirm the beginning of a broader bearish move.
In my view i suggest all the Trader/Investor which they are reading this to stay AT LEAST 80/90% IN CASH. something is about to happen... stay safe!

SPX – Correction Scenarios#SPX – Correction Scenarios
The S&P 500 is entering a corrective phase after completing a full 5-wave impulse.
Current price: 6,654
Main focus: potential retracement between 6,350–6,150 pts
Technical Context
• The index reached the 2.618 Fibonacci extension (≈6,520) — typical for the final wave 5.
• RSI divergence + trendline break confirm exhaustion.
• Structure now shifts into ABC correction, possibly extending into wave (4) or a larger degree A-wave.
Correction Scenarios
1️⃣ Shallow pullback (yellow path)
• Target: 6,600–6,530 (0.236 Fib)
• Structure: quick ABC with limited downside — “wave 4 inside 5.”
• Bias: short-term profit-taking only.
• Probability: High, if Fed remains neutral and earnings stay solid.
2️⃣ Standard correction (purple path)
• Target: 6,350 (0.382 Fib / Pivot)
• Structure: classic A-B-C retracement after trend extension.
• Represents healthy market cooling without trend reversal.
• Probability: Base case / Most likely.
3️⃣ Deeper correction (white path)
• Target: 6,150 (0.5 Fib / EMA 200 zone)
• Structure: larger A-B-C completing wave (4).
• Often precedes a strong new impulse (wave 5 of higher degree).
• Probability: Moderate, triggered by weaker Q3 data or tighter Fed tone.
4️⃣ Extended correction (cyan path)
• Target: 6,030–5,800 (0.618–0.786 Fib)
• Structure: deeper W-X-Y or expanded flat, washing out late longs.
• Long-term accumulation zone.
• Probability: Low, but key for long-term investors.
📌 Summary
• SPX likely transitions into a corrective ABC structure.
• Primary support area: 6,350–6,150.
• Only a break below 6,000 would confirm a broader trend reversal.
• Until then, overall bias stays medium-term bullish — correction before continuation.

S&P500 Can the 1D MA50 save the day?The S&P500 index (SPX) has been trading within a 5-month Channel Up and last Friday's flash crash touched its bottom making a new Higher Low. At the same time, it hit its 1D MA50 (blue trend-line) for the first time May 01 2025.
As long as the market keeps closing the daily candles inside the Channel Up, we expect the new Bullish Leg to start and as the shortest ones did within the pattern, target at least the 1.382 Fibonacci extension level at 6850.
If a 1D candle closes below the Channel Up though, there are higher probabilities to see a stronger dip to the 1D MA100 (green trend-line) a 6400.
On a sidenote, the 1D RSI hit and rebounded on Friday on its Lower Lows trend-line, favoring at the moment a bullish continuation.
-------------------------------------------------------------------------------
** Please LIKE 👍, FOLLOW ✅, SHARE 🙌 and COMMENT ✍ if you enjoy this idea! Also share your ideas and charts in the comments section below! This is best way to keep it relevant, support us, keep the content here free and allow the idea to reach as many people as possible. **
-------------------------------------------------------------------------------
💸💸💸💸💸💸
👇 👇 👇 👇 👇 👇

SPX500 Slips Below Pivot as Sellers Regain ControlSPX500 – Overview | Bearish Bias Below 6,609
The index reversed lower from resistance around 6,672 and has now stabilized below the pivot line at 6,609, signaling a continuation of bearish momentum.
As long as price trades below 6,609, the trend remains bearish, targeting 6,577 → 6,550, with further downside potential toward 6,507.
A 1H close above 6,609 would negate the bearish setup and shift momentum bullish toward 6,635 → 6,672 → 6,700.
Pivot: 6,609
Support: 6,577 – 6,550 – 6,507
Resistance: 6,635 – 6,672 – 6,700

S&P500 Volatility remains elevated, ahead of earnings resultsMonday’s Rally Recap:
The S&P 500 rebounded strongly, recovering over half of Friday’s losses. The main driver was more positive trade rhetoric, with signs the US is open to compromise—softening the tone from Friday’s comments.
A secondary boost came from AI optimism, as OpenAI signed a major chip deal with Broadcom (+9.88%), lifting tech sentiment.
Current Market Setup:
Despite Monday’s gains, S&P 500 futures are down -0.38% this morning, as:
US-China tensions escalated again—China sanctioned US units of a Korean shipping giant, a counter to US trade pressure.
Market volatility persists, with the dollar and Treasuries rising, and oil pulling back.
Government shutdown enters Day 14, disrupting IPO timelines and withholding macroeconomic data, adding uncertainty.
Focus Ahead:
The start of US earnings season today is crucial: JPMorgan, Goldman Sachs, Wells Fargo, BlackRock, Citigroup, and Johnson & Johnson all report. Their results will likely set the tone for Q4 expectations and influence near-term direction.
Underneath market movements, there's a sense of longer-term repricing as investors hedge against policy uncertainty and inflation ("debasement trade").
Bottom Line for S&P 500:
Volatility remains elevated. Monday’s rebound was fueled by sentiment, but renewed geopolitical risk, lack of macro data, and earnings uncertainty are keeping futures under pressure today. Market likely to trade cautiously until earnings results provide clearer direction.
Key Support and Resistance Levels
Resistance Level 1: 6680
Resistance Level 2: 6703
Resistance Level 3: 6728
Support Level 1: 6547
Support Level 2: 6522
Support Level 3: 6487
This communication is for informational purposes only and should not be viewed as any form of recommendation as to a particular course of action or as investment advice. It is not intended as an offer or solicitation for the purchase or sale of any financial instrument or as an official confirmation of any transaction. Opinions, estimates and assumptions expressed herein are made as of the date of this communication and are subject to change without notice. This communication has been prepared based upon information, including market prices, data and other information, believed to be reliable; however, Trade Nation does not warrant its completeness or accuracy. All market prices and market data contained in or attached to this communication are indicative and subject to change without notice.

$SPX Sell is not over yetHuge down move on Friday on Trump's tweet. And a gap up yesterday and market was sideways. So we are going up from here? It was a super bearish candle on Friday and technical points to further downside.
Indeed, my call at 840pm EST timestamped was followed by a 80 pts sell down. I could be wrong but I see 6000 or so; confluence of support, and even down to 5800 (50 Fib) before a huge rally towards end of year.
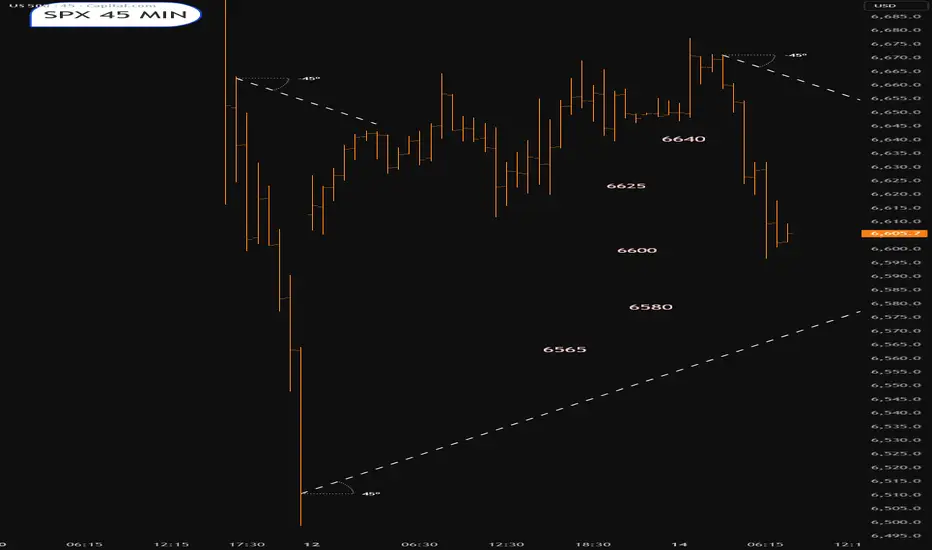
SPX into the Euro open.Tuesday 14th OctoberPoss supp area 6565-6600 looming
66400 seems to be some swearing and fighting
From 'pullbacks' to a 'correction' (S&P 500)Setup
Still Bullish. Be patient for entry near end of the corrective move lower
Evidence..
-Trend is up, no top pattern
-No longer 'dips' to 50 DMA, now into a 'correction' with possible move towards 100 DMA
-Large bearish engulfing weekly candle
-The 4 month old trendline has broken.
-RSI has dropped under support - but not yet characteristic of bearish trend by going oversold
-Price has landed at a demand zone under 6500 (could rebound from here)
Signal
Looking to go long on another test of the demand zone OR
at next supports found at matching lows of 6350 then 6200

SPX | Daily Analysis #2Hello and welcome back to DP,
**Review and News**
Yesterday, at the start of the week, the SPX opened with a significant upside gap, largely driven by a tweet from former President Trump on Friday. His statement—"Don’t worry about China and Xi, they don’t want a recession for their economy, and neither do we"—helped restore investor confidence, pushing them back into the market, particularly into this index. However, shortly after, Trump reiterated that tariffs would still be implemented on November 1st, which is expected to have a considerable impact.
This morning, President Xi reaffirmed his stance, saying, "China will fight to the end, but the doors for negotiation are always open." As seen on the chart, the price has moved within a range between $6,681 and $6,584.
**4-Hour Price Action**
As indicated by the chart, the price range between $6,681 and $6,584 seems to be holding steady for now. One scenario suggests the market is in a consolidation phase. The shape of this consolidation will depend on the future performance of the market. It could either form a diagonal pattern or remain within a box range, as investors battle against short-sellers.
Using Fibonacci retracement, it appears the price may extend to the 0.236 line at $6,706. If this Fibonacci level holds, the market could face a downturn, potentially targeting the next support level indicated by the red box below the chart.
**Trend Analysis**
As shown, the trend illustrates a clear relationship with price movement. The price opened above the trend line, then expanded below the next trend level, showing respect for it. This movement suggests that downward pressure remains, with the market's direction depending on the break of the current trend line.
Personally , I believe the market may head south, but it won’t be a straightforward move. The decline could be unpredictable and happen quickly, or it may unfold in more gradual, choppy moves. One thing to be certain of is that retail traders are betting against the market, mainly due to the gap being filled. However, caution is advised when trading this index. It’s important to wait for confirmation before making any decisions.
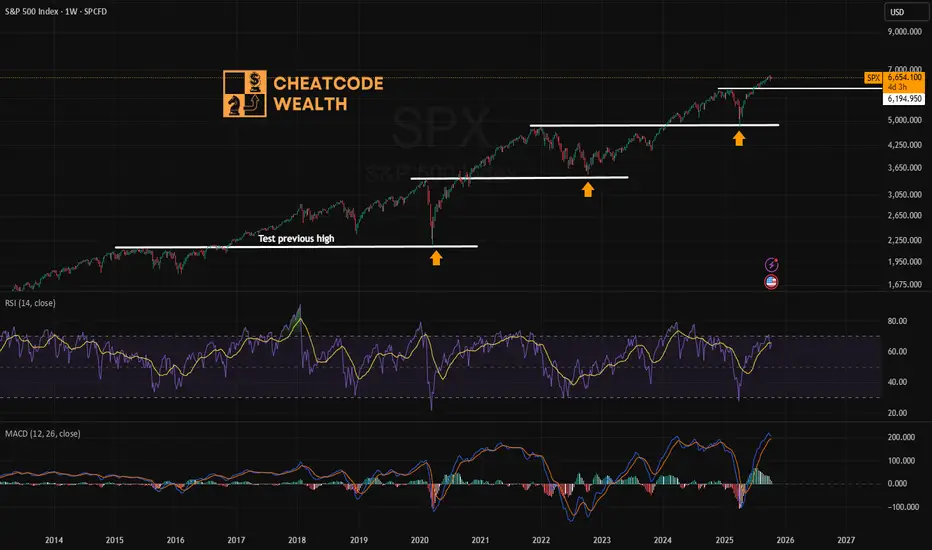
15% uptrend until March 2027Just have a look.
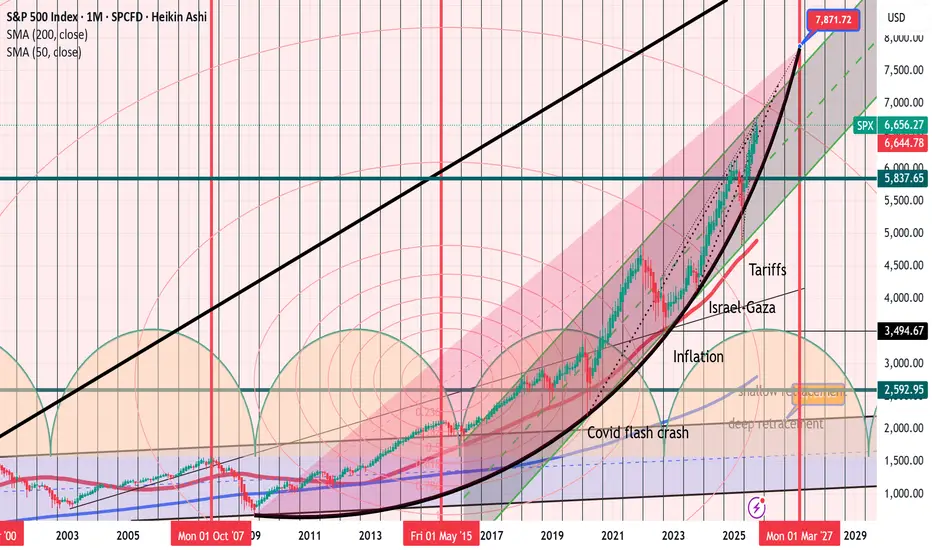
The market is in an incredible bull run since 2009. Its move is parabolic and it will probably end around 8000 pips in March 2027.
My theory is based in the bottoms of this cycles:
2008-2015-2020-2023-2025 or in other words:
Finantial crisis.
Covid
Israel Conflict
Trump´s Tariffs.
Other indicators are Gann cycles which collide in the exact points.
Therefore, my idea is to see Sp500 at 7800 points in March 2027 before seeing the huge crash that it must be needed to cool off after almost 20 years of bull run.
SNP500 short uptick and quick downfallZeusExodus
As the marked upticks close to 7k levels it will drop about 10% that will mark the lowest point on July 11th.
US 500The US 500 has just broken through the 6650 level again. After testing support and closing above it, the trend is to target the next level, 6700.
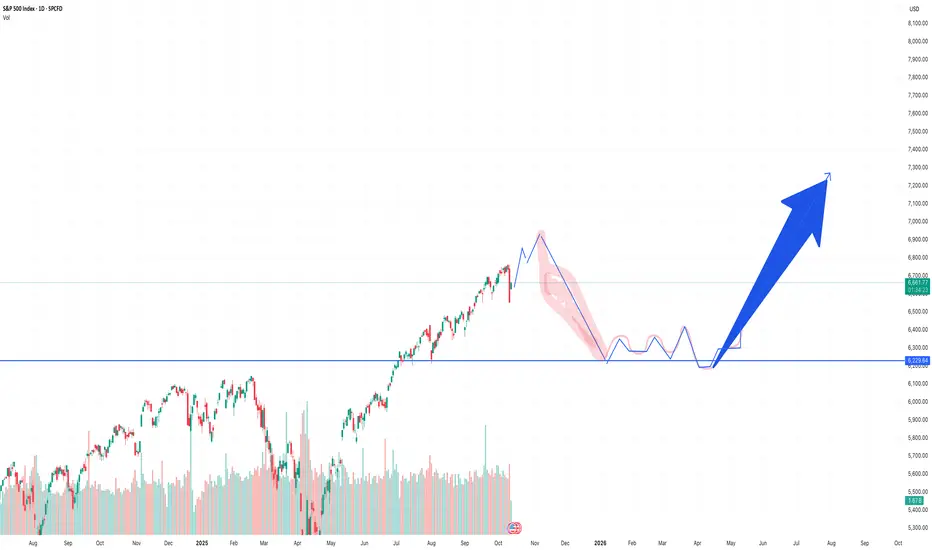
SP500 path forward: volatility and retest of previous highsAssuming that previous patterns continue, and they may not, the SP500 will eventually retest its previous new highs, but likely not in the near future, short of a volatility event.
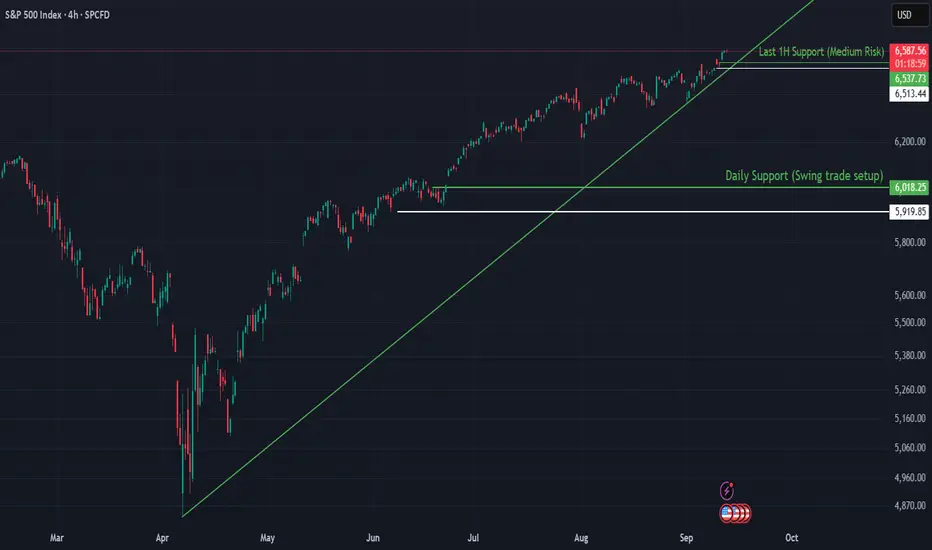
SPX Supported by Trendline and Rate Cut ExpectationsThe S&P 500 has been climbing steadily, with the ascending trendline from April acting as a reliable backbone for the move. Despite short-term volatility, buyers continue to defend higher lows. Coupled with expectations of interest rate cuts, the trend structure remains intact unless key supports give way.
🔍 Technical Analysis
Current price: 6,584
The green trendline (since April) is guiding the advance.
Price is consolidating near highs, supported by demand zones underneath.
🛡️ Support Zones & Stop-Loss (White Lines):
🟢 6,537 – 1H Support (Medium Risk)
First line of defense for short-term traders.
Stop-loss: Below 6,513
🟡 6,018 – Daily Support (Swing Trade Setup)
Stronger base for medium-term positioning.
Stop-loss: Below 5,919
🧭 Outlook
Bullish Case: Hold above 6,537 + April trendline intact → continuation toward new highs above 6,600–6,700.
Bearish Case: Break below 6,537 could trigger a correction into 6,018. Losing that zone would weaken the April trendline structure.
Bias: Bullish while April trendline holds.
🌍 Fundamental Insight
Rate cut expectations continue to provide a macro tailwind for equities. With inflation moderating and yields easing, investors remain willing to support risk assets. A sudden shift in data or Fed tone, however, could test the resilience of the April trendline.
✅ Conclusion
The S&P 500 remains in a strong bullish structure, anchored by the April trendline. Unless supports at 6,537 or 6,018 are lost, the path of least resistance remains higher.
If you found this useful, please don’t forget to like and follow for more structure-based insights.
⚠️ Disclaimer
This analysis is for educational purposes only and does not constitute financial, investment, or trading advice.