SPX should see a pump to 6,700$ immediately upon openas the title says..... and thereafter, price should get crushed for the rest of the week.
see linked ideas for our accuracy, we are here predicting financial meltdown on SPX and the cryptocurrency markets looming.
SPCUSD trade ideas
S&P 500 (SPX / US500) – Late Cycle Top FormingAnalysis Date: October 2025
Analyst View: Potential downtrend start within 2 - 6 weeks
🧭 Market Outlook (2025 → 2026)
Scenario Probability Expected Move Timing
🟥 Base Case – Late-Cycle Correction 45 % -18 % to -25 % → 5,400–4,800 zone Oct–Nov 2025 start
🟩 Bullish Extension – Blow-Off Phase 30 % +5 % to +10 % → 7,000–7,300 Oct 2025 – Q1 2026
🟥 Bearish Shock – Deep Recession Phase 15 % -30 % to -40 % → 4,000–3,800 Dec 2025 – Mid 2026
🟨 Sideways / Range Consolidation 10 % 6,400–5,800 Oct 2025 – Mid 2026
---
📊 Technical Levels to Watch
Level (USD) Significance
6,800–6,750 Major resistance / top zone
6,550 Breakdown trigger
6,200 Mid-channel support
5,400–5,300 Correction target
4,850–4,800 Bearish completion zone
7,200 Bullish invalidation level
---
🔍 Key Technical Signals
Rising wedge + channel top = exhaustion pattern
Weekly RSI divergence confirming overextension
VIX > 20 = risk-off confirmation
Advance/Decline line not confirming new highs
Volume divergence and failed breakout = early trigger
---
🧩 Macro + Cycle Alignment
Cycle / Theme Current Phase (as of Oct 2025) Impact
18-Year Housing Cycle Peak (2024 → 2026) Credit stress emerging
Business Cycle Late expansion → slowdown Earnings compression risk
Liquidity Cycle Tight but easing expectations Delay in Fed cuts = bearish
Tech/AI Bubble Wave Euphoric phase Prone to sharp rotation
Fiscal Cycle Heavy deficits Yield curve volatility ↑
---
⚙️ Confirmation Checklist
☑ Weekly close below 6,550
☑ VIX > 20
☑ Breadth deterioration (A/D line weak)
☑ 10-Year yield > 4.8 %
☑ Housing data rolling over
☑ Credit spreads widening

S&P 500: Rising Wedge signals movement before NFP📈 BLUEBERRY:SP500 | Rising Wedge + Non-Farm Payrolls: Which breakout scenario is more likely?
A Rising Wedge pattern is forming on the 30-minute chart of US SPX 500, with price approaching the convergence point of two trendlines. This pattern typically signals weakening bullish momentum but doesn’t rule out a breakout to the upside 🚀.
🔍 Technical Analysis:
• Price is consolidating within a narrowing channel, forming a Rising Wedge 🔺.
• Key support lies between 6717 - 6734 (lower blue zone) 🛡️.
• Target zone on a breakout to the upside is 6767 - 6775 (upper blue zone) 🎯.
• The pattern signals an imminent breakout, but confirmation with a candle close beyond the wedge is needed 🕒.
📊 Non-Farm Payrolls Impact:
• If NFP comes in below expectations, the market may react positively (break up) on hopes of Fed easing monetary policy 💵👍.
• Conversely, a higher-than-expected NFP could increase downside pressure (break down from the wedge) 📉⚠️.
💡 Trade Setup:
• Enter a BUY position once price breaks above 6733 with confirming high volume 🔥.
• Place stop loss below support at 6716 to manage risk 🚧.
• Target area between 6770 - 6775 🎯.
📝 Summary:
The Rising Wedge on SPX 500 points to a breakout soon, with the NFP report acting as a key catalyst. Wait for confirmation and manage your risk carefully ✅.
Please like and comment below to support our traders. Your reactions will motivate us to do more analysis in the future 🙏✨
Harry Andrew @ ZuperView

A healthy consolidation should dip lowerA healthy consolidation should dip lower (around $6,648 or even better $6,000) before bouncing.
But will the billionaires manipulating this market have the patience — or will they fire their money into the air too soon?
Hopefully, we get a deeper correction for a solid long setup by the end of the week and a strong rebound next week.
Patience is key. 🕒
S&P 500 JUST FLASHED THIS SIGNAL FOR THE FIRST TIME SINCE 1993!!In this video, we're back on the three month chart of the S&P 500 and the data that just came through in this chart tells us a lot about what we could see in 2026 as far as a market correction and what to expect in the next bull market cycle!!!

The S&P 500 index remains positive against all oddsThe S&P 500 index remains positive against all odds
We noted on 29 September that, amid the US shutdown, sentiment in the S&P 500 index market remained positive, and highlighted factors supporting further growth.
Today, the S&P 500 index reached a fresh all‑time high: on Friday morning the price rose above 6 740 points. This confirms the continued optimism among market participants. Today this is supported by news related to the creators of ChatGPT.
According to media reports, OpenAI:
→ has reached a valuation of $500 billion following a deal in which current and former employees sold shares worth around $6.6 billion;
→ is expanding cooperation with semiconductor manufacturers in South Korea, which is expected to sustain the company’s high growth rate.
Thus, OpenAI’s successes are boosting investor optimism ahead of the upcoming earnings season.
These and other positive developments might have been overshadowed by the regular Non‑Farm Employment Change report (and other US labour market data), but the Bureau of Labour Statistics is closed due to the shutdown.
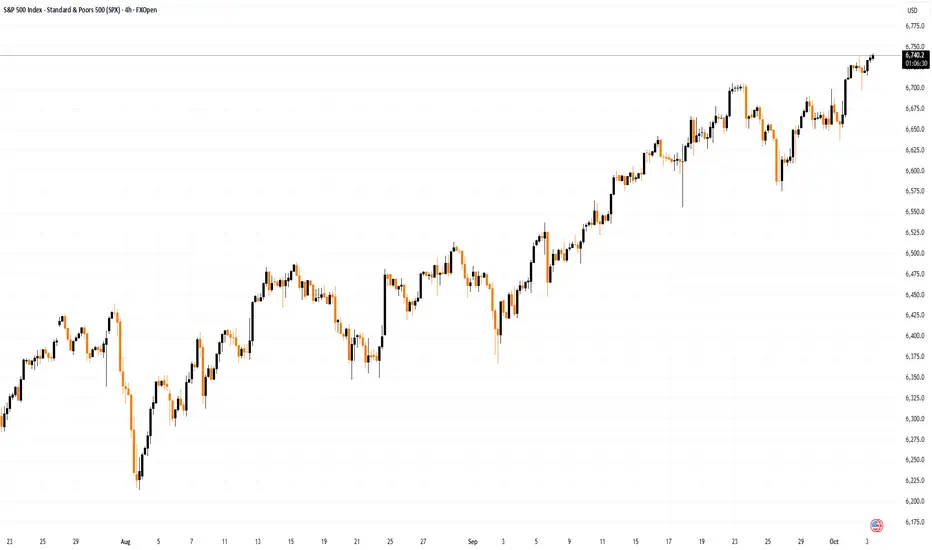
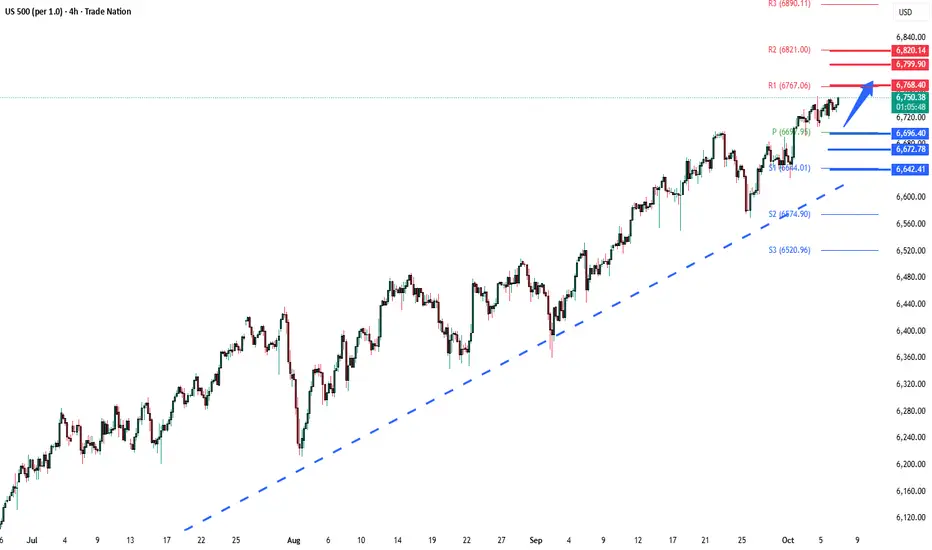
Technical analysis of the S&P 500 chart
Recent data on the 4‑hour chart of the S&P 500 index underline sustained optimism, as the price develops within a previously established ascending channel, highlighted in blue.
From a bullish perspective:
→ bulls showed strength by breaking a local resistance level at 6 700, which later acted as support (indicated by an arrow);
→ local peaks allow for steeper upward trendlines to be drawn;
→ if the move from A→B is seen as the main impulse and B→C as a correction, the correction appears shallow, as the reversal upwards occurred from the 0.382 Fibonacci level, highlighting strong demand.
From a bearish perspective:
→ the price is approaching the upper boundary of the channel, where profit‑taking by long holders is typical;
→ the current peak on the e‑mini S&P 500 chart slightly exceeds the October high (A), suggesting the potential for a bearish divergence;
→ the absence of news creates an “information vacuum” that could significantly influence market sentiment if filled with negative data.
Nonetheless, optimism persists, with Tom Lee (Fundstrat) forecasting that the S&P 500 index will exceed 7 000 points by year‑end.
This article represents the opinion of the Companies operating under the FXOpen brand only. It is not to be construed as an offer, solicitation, or recommendation with respect to products and services provided by the Companies operating under the FXOpen brand, nor is it to be considered financial advice.
SPX500 Local Short!
HI,Traders !
#SPX500 made a nice
Bullish move up and
made a retest of
The horizontal resistance
Level of 6750.77 from where
We are already seeing a bearish
Reaction and so we will be
Expecting a further move down !
Comment and subscribe to help us grow !

US500 my projectionUS 500 possibility to go short.
Disclaimer: Take it on your own risk! No investment advice here.

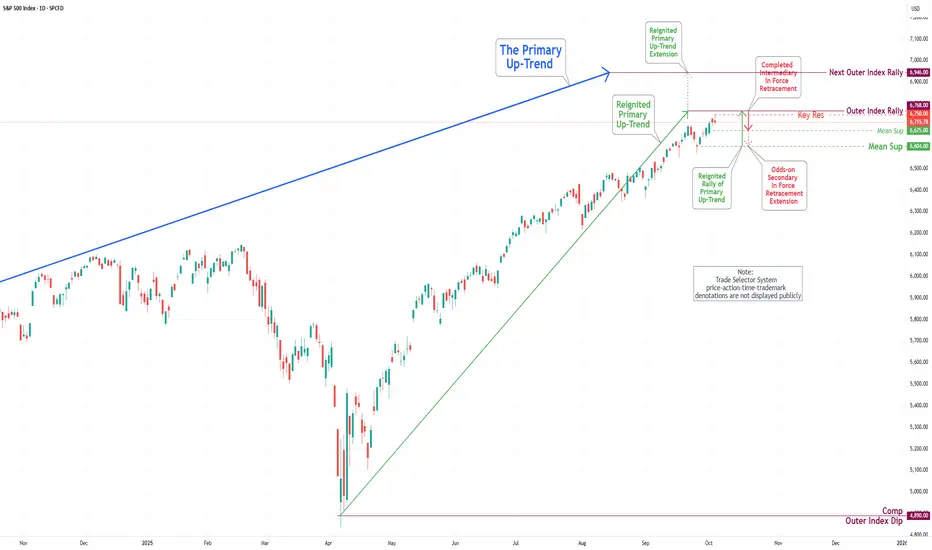
S&P 500 Daily Chart Analysis For Week of Oct 3, 2025Technical Analysis and Outlook:
In the previous week’s trading session, the S&P 500 Index demonstrated a significant increase in upward price activity, rebounding from the Mean Support level of 6585. The index not only retested but also exceeded our primary target set at Key Resistance of 6693 and the Inner Index Rally level of 6704.
At present, the index is situated just below the newly established Key Resistance level of 6750, and it appears to be on track to complete the Outer Index Rally at 6768, indicating the potential for further upward momentum in the near future that could extend to the subsequent Outer Index Rally target of 6946.
It is essential to recognize that upon achieving the Key Resistance target of 6750 and the Outer Index Rally target of 6768, there may be an ensuing pullback toward the Mean Support level of 6675. Furthermore, there is a possibility of a further decline that could extend to the Mean Support target of 6604.
Applovin Craters...Is Robinhood next? APP fell sharply intraday today after announcement came late into the session about an SEC probe into the company.
The SEC loves to do this with new S&P500 stocks.
Applovin was one of the strongest stocks in the market recently and its finally been knocked back down to earth.
You have to wonder if HOOD will be the next SEC probe.
Robinhoods controversial NFL prediction markets could a big controversy.

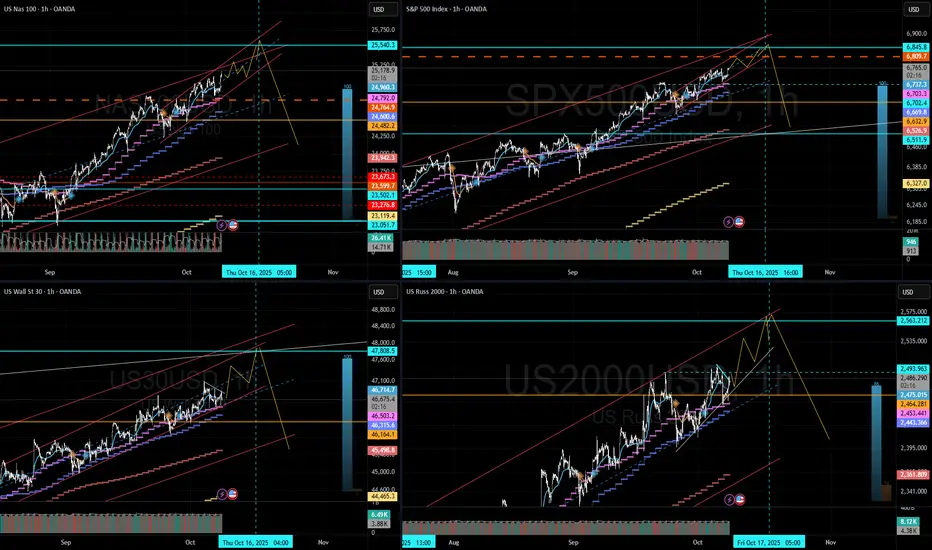
NAS, and all indices lining up for Oct. 17thOct. 17 Options Expiration could be a catalyst for a market correct higher degree Wave 2.
Or very close a few days after.
The dollar on the brink: how the 80-year cycle from Bretton WoodThe US is on the verge of a monetary breakdown, worse than a recession. He compared the situation to the debt crisis of the 1930s, which led to the Great Depression. Today, the US is in the same trap: debt exceeds $37 trillion, and the ratio to GDP is 119 percent as of August 2025.
Today, the dollar is losing ground faster than ever since 1973, and this is no accident.
The Federal Reserve cut interest rates to 4.25 percent in September, but that is not enough. US GDP growth has slowed to 1.7 percent in the forecast for the year, with unemployment at 4.3 percent.
Consumers are spending less: spending rose by only 0.6 percent in August. And inflation? It fell to 2.3 percent in May, but the risks of a return are growing due to Trump's tariffs. These import duties — 10-20 percent on China and Europe — are hitting exporters such as Midwestern farmers.
If confidence collapses, bond rates will soar and inflation will return. Dalio paints a picture in his book How Nations Go Bankrupt: empires fall when debt stifles growth.
I expect that the rate will not be lowered, portfolio position fixing will begin across the entire market, including precious metals and cryptocurrencies. As was the case in April 2025.
The decline will be like in April 2025.

S&P500 Uptrend continuation supported at 6696 The S&P 500 (+0.36%) climbed to another record high, showing resilience despite political uncertainty in Europe and the ongoing US government shutdown. Gains were driven largely by a massive 23.7% surge in AMD after news that OpenAI will purchase tens of billions of dollars’ worth of its chips, making AMD the standout performer in the index.
Even though over half of S&P 500 constituents declined, tech strength — led by AMD and NASDAQ’s 0.71% advance — lifted the broader market. After the close, news of the US government taking a 10% stake in Canada’s Trilogy Metals (up 215% in after-hours) reinforced investor focus on critical minerals.
Gold eased slightly from the $4,000 mark but remains strong amid global uncertainty, while Tesla’s upcoming launch of a cheaper Model Y could influence sector sentiment. Overall, tech leadership continues to support the S&P 500’s momentum despite mixed breadth and macro headwinds.
Key Support and Resistance Levels
Resistance Level 1: 6768
Resistance Level 2: 6800
Resistance Level 3: 6820
Support Level 1: 6696
Support Level 2: 6670
Support Level 3: 6640
This communication is for informational purposes only and should not be viewed as any form of recommendation as to a particular course of action or as investment advice. It is not intended as an offer or solicitation for the purchase or sale of any financial instrument or as an official confirmation of any transaction. Opinions, estimates and assumptions expressed herein are made as of the date of this communication and are subject to change without notice. This communication has been prepared based upon information, including market prices, data and other information, believed to be reliable; however, Trade Nation does not warrant its completeness or accuracy. All market prices and market data contained in or attached to this communication are indicative and subject to change without notice.
SP500 7400!!!We are at a time when stocks and risk assets are on the rise, we have a target not far from the SP 500 at around 7400
This is in an important resistance zone where it can have a pullback to break through or make a single leg in search of Bullran's macro target.
If it does a Pullback retest, we have a good zone of interest below to enter. This week we will have Payroll and it can dictate the pace of some assets. Let's keep an eye on these scenarios.

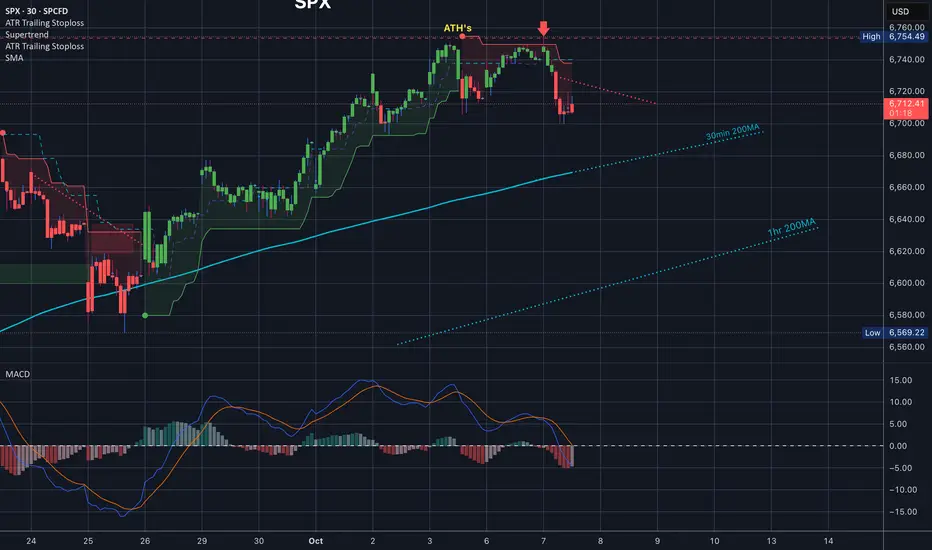
$SPX $ES_F SUPERTREND is an indicator you should learnSP:SPX $ES_F SUPERTREND is definitely an indicator you should learn how to use.
What's funny is it doesn't act the way you likely originally think it works, so learning to read it well can give you a huge edge. Look at where we got smacked down today, right at supertrend. We got the signal Friday, moved up to it yesterday, tested it today and got smacked down.
So beautiful!! So if you have Super trend and the 35EMA you have everything you need. For ES Traders you should be checking these levels on Regular Trading hours not Electronic, once in a while.
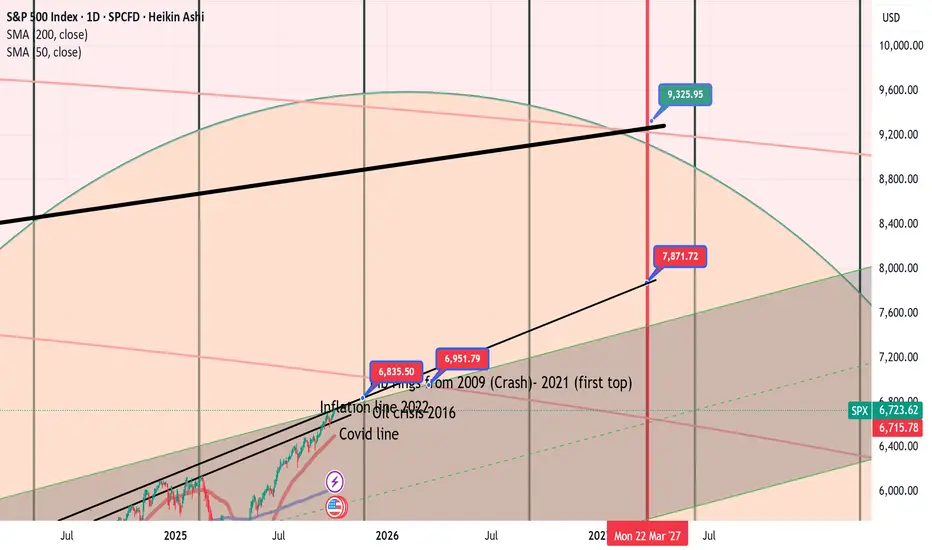
How far Spx can go? My guess is 9000 point by March 2027Gann cycles are telling me that if the liquidiy in the system carries on we can see a bullish 2026 and the top of the market in March 2027.
After that I expect a major crash. Therefore, I could tell that 1929 crash is on the horizon but this time a little bit earlier.
If I am Ok, we could see 2027 top and two years of sell off in the market.
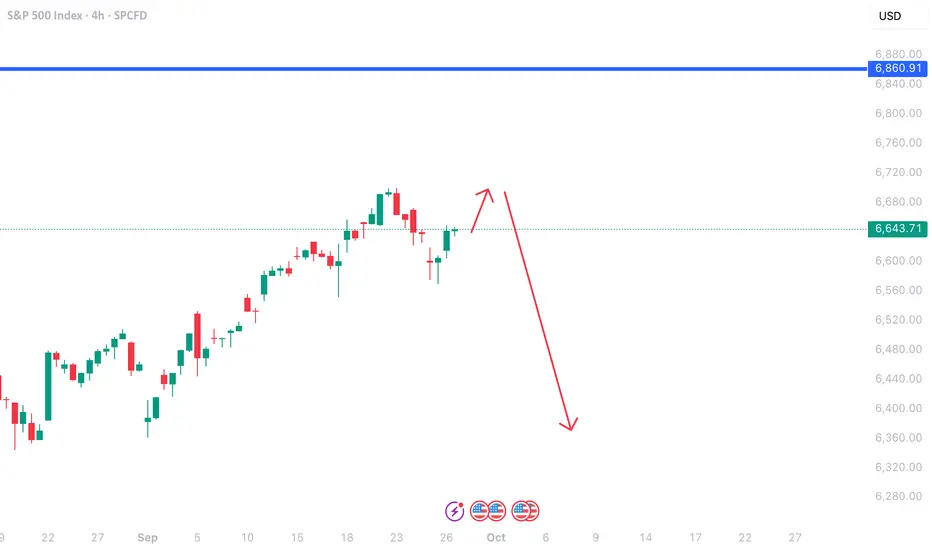
US500 SELL?Market has been bullish for a long time, and there seems to be a possible reversal on daily.
Based on 4HR TF, the market seems to be forming a possible reversal pattern which could lead to a possible reversal.
We could see SELLERS coming in strong should the current level hold.
Disclaimer:
Please be advised that the information presented on TradingView is solely intended for educational and informational purposes only.The analysis provided is based on my own view of the market. Please be reminded that you are solely responsible for the trading decisions on your account.
High-Risk Warning
Trading in foreign exchange on margin entails high risk and is not suitable for all investors. Past performance does not guarantee future results. In this case, the high degree of leverage can act both against you and in your favor

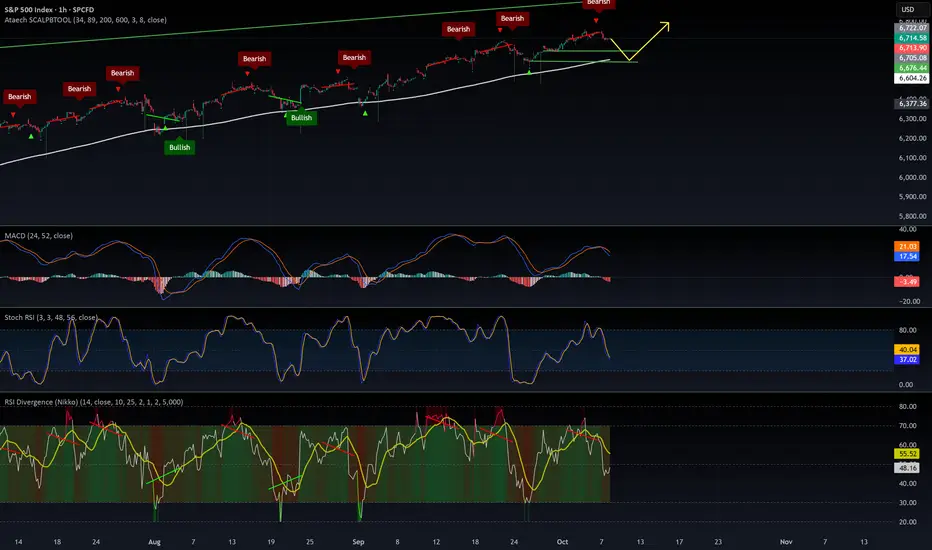
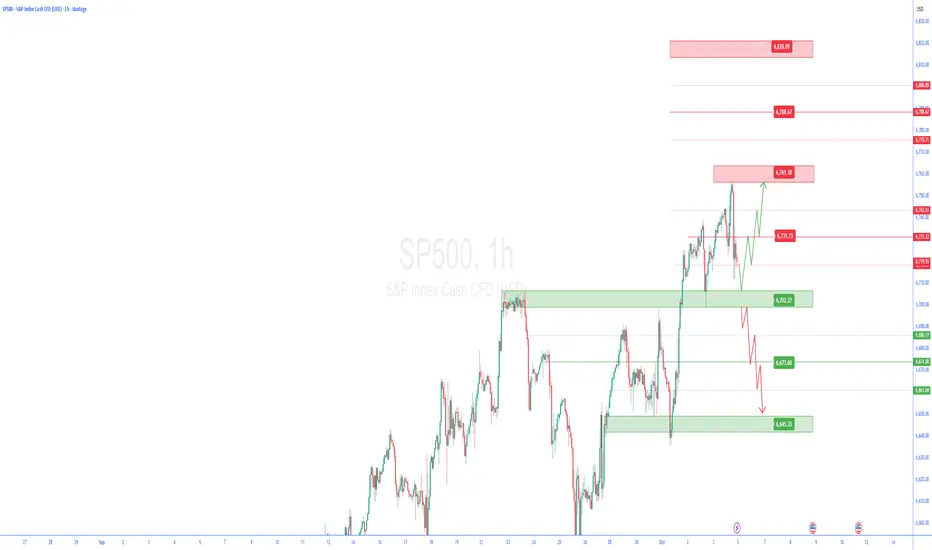
SP500 1H🔹 Overall Outlook and Potential Price Movements
In the charts above, we have outlined the overall outlook and possible price movement paths.
As shown, each analysis highlights a key support or resistance zone near the current market price. The market’s reaction to these zones — whether a breakout or rejection — will likely determine the next direction of the price toward the specified levels.
⚠️ Important Note:
The purpose of these trading perspectives is to identify key upcoming price levels and assess potential market reactions. The provided analyses are not trading signals in any way.
✅ Recommendation for Use:
To make effective use of these analyses, it is advised to manually draw the marked zones on your chart. Then, on the 15-minute time frame, monitor the candlestick behavior and look for valid entry triggers before making any trading decisions.
S&P500 Short-term Bull Flag formed.The S&P500 index (SPX) has been trading within a Channel Up since the July 31 High. The price is currently on its 4H MA50 (blue trend-line), forming a Bull Flag after a 4H MA100 (green trend-line) rebound last Thursday.
This is similar to the Bull Flags of August 25 and 05, which both ended with a rise to the 1.236 Fibonacci extension. Even the 4H RSI sequences among the 3 fractals are similar with their Lower Highs structures. The only difference is that the price bottomed this time on the 4H MA100 (as mentioned), instead of the 4H MA200 (orange trend-line) of the previous 3 times.
As a result, if this Bull Flag holds, we expect a quick rally to 6720 (just under Fib 1.236).
-------------------------------------------------------------------------------
** Please LIKE 👍, FOLLOW ✅, SHARE 🙌 and COMMENT ✍ if you enjoy this idea! Also share your ideas and charts in the comments section below! This is best way to keep it relevant, support us, keep the content here free and allow the idea to reach as many people as possible. **
-------------------------------------------------------------------------------
💸💸💸💸💸💸
👇 👇 👇 👇 👇 👇

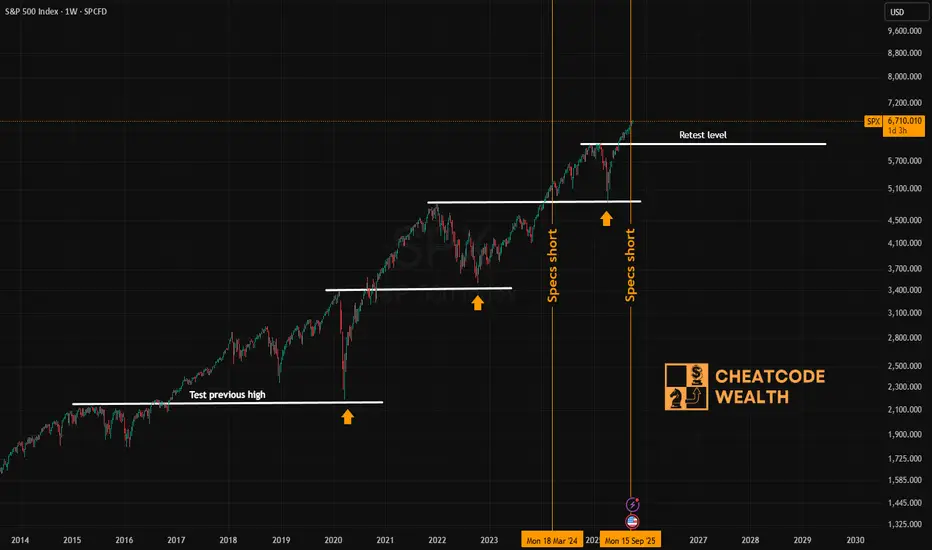
The SP500 has a pattern of retesting previous highsThe SP500 has been retesting previous highs since 2018. Large specs are also net short which tends to occur near the beginning of rallies. These technical indicators suggest that the SP500 has more upside before a plausible retest.
S&P500 (US500): Another BoS
US500 updates the all-time high yesterday, breaking a resistance
cluster based on a previous high.
It opens a potential for more growth now.
Next goal - 6750
❤️Please, support my work with like, thank you!❤️
I am part of Trade Nation's Influencer program and receive a monthly fee for using their TradingView charts in my analysis.

PROP TRADING - BLESSING OR TRADING GROUND?🧠 Prop Trading – Blessing or Training Ground?
📝 Summary
Prop trading looks like the fast track to capital: low costs, high profits.
In reality, most providers are built on fees rather than trader success.
For beginners, it can be valuable – as a training platform for risk, drawdown & psychology.
For professionals, it’s rarely a long-term home – the structures aren’t made for that.
1️⃣ The Temptation
Prop trading sells a dream:
👉 “Pay little – get capital – earn big.”
Entry with small fees or even free challenges
No bank account, no license required
Promise of quick profit
For many, it feels like a shortcut – cheap in, fast up.
But firms have built their models psychologically perfect.
2️⃣ The Challenge Structure
Phase 1 → e.g. +10% target with limited drawdown
Phase 2 → seemingly easier: only +5% target
Afterwards → “Funded Account” + fee refund
But don’t underestimate the details:
Strict drawdown rules
News trading bans, slippage, spread expansions
Execution delays in volatile phases
👉 If you use it wisely, you learn discipline, risk management, and patience – things no other “training” will teach you.
3️⃣ The Funded Account – Reality vs. Illusion
Even if you are “funded”:
In almost all cases, it remains a demo account.
First payouts (3'000–5'000 CHF) are often possible.
After that, your behavior is closely checked for scalability.
Traders who earn too much too quickly often face limits:
Internal rule restrictions
Additional reviews
Accounts frozen at the first irregularities
4️⃣ Why Professionals Rarely Stay
Firms say: “We are looking for top traders.”
In reality, they look for traders who fit the business model – pay fees regularly, stay within risk.
Consistently strong professional traders don’t fit long term, because they could outgrow the system.
5️⃣ The Bait: Certificate & “Diploma”
Many prop firms lure you with the promise of becoming a “certified trader.”
Often you get a certificate already after Phase 1 (PDF or badge).
Psychologically clever: the euphoria is huge – you instantly feel like a pro.
Phase 2 then looks easier – lower percentage target, less pressure.
Many traders think: “I already have a certificate, I’m a pro now – I’ll crush this.”
But here’s the trap:
Some need 20–30 attempts to pass.
In total, they pay thousands in fees – for a piece of paper with no value.
Step by step, the trader is pulled into a system where it’s no longer about capital, but about repeated fee payments.
👉 Important for beginners:
Always take a break between challenge phases.
Let the euphoria cool off, reflect on mistakes, and adjust risk management.
Otherwise, the firm’s psychology will overwhelm you.
6️⃣ Scam or Learning Opportunity?
👉 From my own experience after many years of trading and testing prop firms:
For beginners, it can be gold.
Simulated rules force you into discipline.
You learn to handle drawdowns, risk limits, and trading psychology.
Free or low-cost challenges = almost like a training program.
For professionals, it’s no home.
Payouts are capped.
A real career needs your own structure (capital, company, partnerships, family office).
7️⃣ Conclusion
Prop trading is not a scam – but also not a professional career path.
For beginners: a valuable training ground
For pros: a temporary stop, not the future
For everyone: question the price of your “diploma” – it’s not real value, just marketing.
👉 Treat prop trading as education – not the end goal.
Use it to sharpen your rules.
But in parallel, build your own capital and your own structure.
🔚 Final Thought:
“A prop account can teach you rules –
but true freedom can only be built with your own capital.”

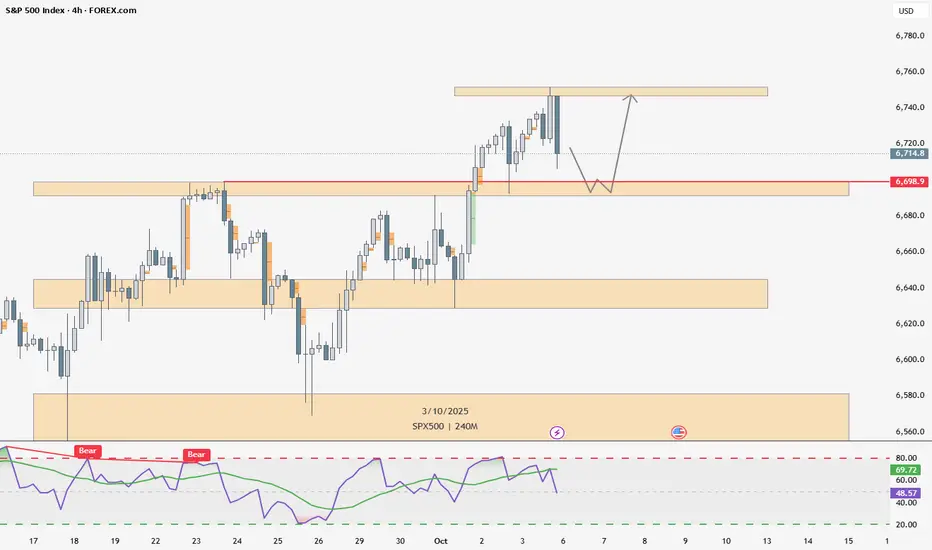
SPX500 Analysis SPX500 Analysis 📈
On the daily timeframe, SPX500 has broken the previous Higher High (6698.9), creating a new Break of Structure (BOS).
On the 4H chart, price is currently making a bearish retracement — I expect it could pull back into the demand zone between 6698.9 and 6691.4.
I’m waiting for confirmation to go long from that area,
with a target at the upper supply zone between 6751.8 and 6746.9