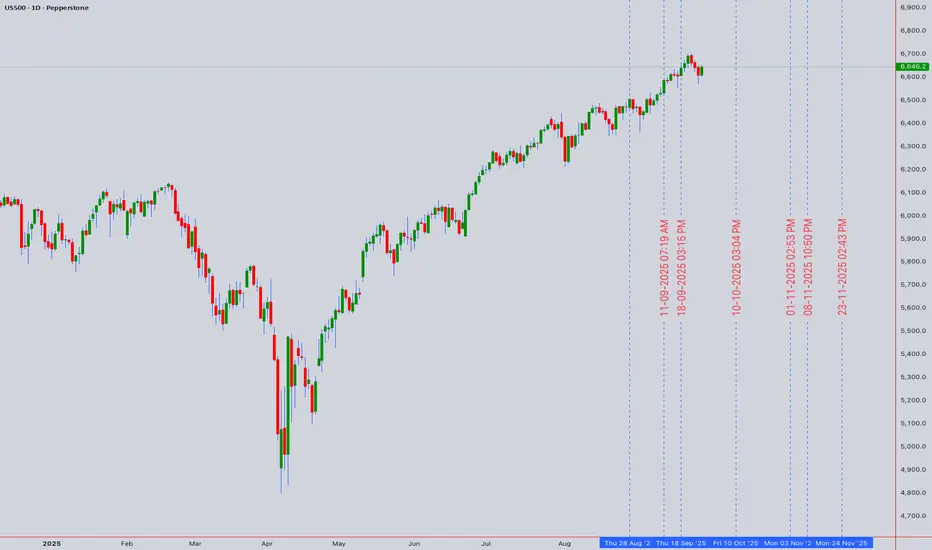
S&P500 pushing to a new ATH?The S&P 500 (+0.34%) pushed to another record high as Q4 began, showing resilience despite ongoing US government shutdown risks and a weaker ADP private payrolls report, which signaled contraction. Markets leaned on expectations of faster Fed rate cuts, with Treasury yields falling sharply as investors reassessed labor market strength.
Sector drivers:
Gold and defensive plays gained as shutdown uncertainty supported safe-haven demand.
Tech outperformed: OpenAI’s $500bn valuation lifted AI-linked sentiment, with gains spilling into suppliers like Samsung and SK Hynix.
Cybersecurity risk weighed on software names after hackers claimed a breach of Oracle’s E-Business Suite, demanding ransom payments.
Apple slipped on reports it is halting Vision Pro updates to prioritize AI glasses.
Market tone: Optimism around rate cuts and AI-driven growth continues to underpin the S&P 500, but shutdown risks and labor market fragility remain key watchpoints for near-term volatility.
Key Support and Resistance Levels
Resistance Level 1: 6750
Resistance Level 2: 6770
Resistance Level 3: 6800
Support Level 1: 6680
Support Level 2: 6660
Support Level 3: 6640
This communication is for informational purposes only and should not be viewed as any form of recommendation as to a particular course of action or as investment advice. It is not intended as an offer or solicitation for the purchase or sale of any financial instrument or as an official confirmation of any transaction. Opinions, estimates and assumptions expressed herein are made as of the date of this communication and are subject to change without notice. This communication has been prepared based upon information, including market prices, data and other information, believed to be reliable; however, Trade Nation does not warrant its completeness or accuracy. All market prices and market data contained in or attached to this communication are indicative and subject to change without notice.
SPCUSD trade ideas

S&P 500 – Steady Uptrend Within Rising ChannelThe S&P 500 continues to grind higher within a well-defined rising channel, holding above both the 50-day SMA (6,486) and the 200-day SMA (6,023), which reinforces the broader bullish structure. Price action has respected the channel boundaries since May, with the recent bounce off the mid-line suggesting buyers remain in control.
Momentum indicators support the bullish bias:
MACD is positive, showing steady upside momentum.
RSI sits near 68, not yet overbought but approaching elevated levels, hinting at a possible test of the channel’s upper boundary.
As long as price holds above the 6,600 zone, the path of least resistance remains higher, with the channel top near 6,800 as the next potential target. A break below the channel support, however, could trigger a corrective pullback toward the 6,450–6,500 area, aligning with the 50-day SMA.
Overall, the trend remains bullish, with dips likely to be treated as buying opportunities while the channel structure holds. -MW

SPX defying gravity!It's a BULL market until it's not! Some how some way the markets will set new ATHs? I don't know how or why every macro economic indicator is yelling recession or worse but the chart tells me a different story. Bulls ball.....

Bear trap....SPX to fall soonToday was somewhat decent, but let's not get too giddy! There's looming Gov shutdown on Wed and a few sizable calls on the VIX on the tape. We can see technicals showing a decline, at least in the short term, and I guess we'll see what happens post-Wed. One thing is for sure is that we are overdue a nice healthy pullback. Would not bet the farm on AI esp. with astronomical CAPEX, and highest concentration ever in the market. Best of luck!

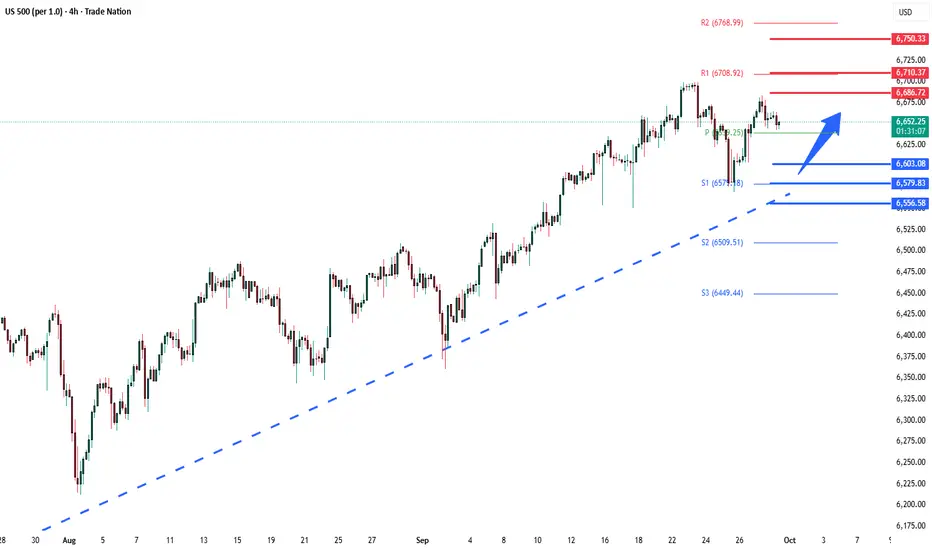
S&P500 uptrend continuation?Key Drivers for S&P 500
Government shutdown risk: With no deal in sight and a 79% market-implied probability of a shutdown tomorrow, headline risk is elevated. Historically, most shutdowns have been short, but lingering political uncertainty could weigh on sentiment.
Rates & bonds: A global bond rally (10yr USTs -3.6bps) supported equities, particularly rate-sensitive and cyclical sectors. Lower yields are helping housing-linked names, as shown by the strong pending home sales data.
Commodities: Oil’s sharp decline (-3.45%, biggest drop since June) reduced inflation concerns and eased pressure on equities.
Sector performance: Gains were broad-based; cyclical sectors and construction materials led, while tech (NASDAQ +0.48%, Mag 7 +0.37%) outperformed. Equal-weighted S&P also rose (+0.32%), confirming breadth.
Safe haven demand: Gold’s rally highlights investor caution despite equity gains—suggesting hedging activity alongside risk-on moves.
S&P 500 Trading Takeaway
Equities remain resilient, closing near record highs with support from falling yields and softer oil prices. However, government shutdown risks and political uncertainty could cap upside near term. Expect headline-driven volatility with cyclical and tech sectors best positioned to extend gains if yields stay contained.
Key Support and Resistance Levels
Resistance Level 1: 6686
Resistance Level 2: 6710
Resistance Level 3: 6750
Support Level 1: 6600
Support Level 2: 6580
Support Level 3: 6556
This communication is for informational purposes only and should not be viewed as any form of recommendation as to a particular course of action or as investment advice. It is not intended as an offer or solicitation for the purchase or sale of any financial instrument or as an official confirmation of any transaction. Opinions, estimates and assumptions expressed herein are made as of the date of this communication and are subject to change without notice. This communication has been prepared based upon information, including market prices, data and other information, believed to be reliable; however, Trade Nation does not warrant its completeness or accuracy. All market prices and market data contained in or attached to this communication are indicative and subject to change without notice.
SPX500 LongElite Analysis
Price came to structured liquidity
Transitional switch confirmed in 1m, 3m, 5m
Targeting structured liquidity above

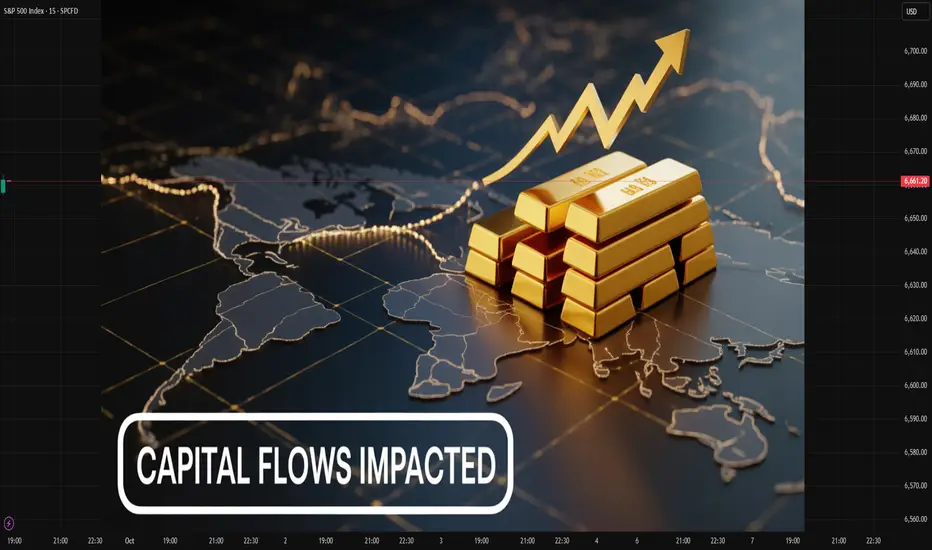
Capital Flows: Introduction and Its Types1. Introduction to Capital Flows
Capital flows refer to the movement of money for the purpose of investment, trade, or business production across borders or within a country. These movements are essential for financing economic activities, promoting growth, and integrating economies globally. Capital flows can occur in various forms, such as foreign direct investment (FDI), portfolio investment, loans, and grants, and they play a crucial role in determining a country’s financial stability, exchange rates, and overall economic health.
In a globalized economy, capital flows are influenced by multiple factors, including interest rate differentials, economic growth expectations, political stability, and global financial conditions. They not only provide resources for investment but also affect the balance of payments, exchange rates, and financial market dynamics.
Importance of Capital Flows
Economic Growth: Capital inflows provide funds for investment in infrastructure, technology, and industry.
Financial Market Development: They enhance liquidity and depth in domestic capital markets.
Exchange Rate Stability: Capital inflows can stabilize or destabilize currencies, depending on their nature and volume.
Integration with Global Economy: Facilitates trade and investment linkages across countries.
Risk Diversification: Allows investors to diversify portfolios internationally, reducing exposure to domestic risks.
Capital flows can be both short-term and long-term, each having distinct impacts on an economy. Understanding the types of capital flows helps policymakers manage them effectively and mitigate associated risks.
2. Classification of Capital Flows
Capital flows can be classified based on their nature, duration, and purpose. Broadly, they are categorized into foreign direct investment (FDI), portfolio investment, other investments, and financial derivatives and loans.
2.1. Foreign Direct Investment (FDI)
FDI refers to investments made by a foreign entity to acquire a lasting interest in a domestic company or asset. This usually involves significant influence or control over the enterprise. FDI is a long-term form of capital flow and is considered relatively stable compared to short-term portfolio flows.
Types of FDI
Horizontal FDI: Investment in the same industry abroad as in the investor's home country.
Vertical FDI: Investment in a business abroad that plays a role in the investor’s supply chain.
Backward Vertical: Investment in suppliers.
Forward Vertical: Investment in distributors or buyers.
Conglomerate FDI: Investment in unrelated industries in the host country.
Advantages of FDI
Transfer of technology and management expertise
Creation of jobs in the host country
Promotion of export-oriented growth
Risks of FDI
Political and regulatory risks
Profit repatriation affecting domestic capital availability
2.2. Portfolio Investment
Portfolio investment refers to investments in financial assets such as stocks, bonds, or other securities in a foreign country without seeking control over the entities invested in. These flows are typically more volatile and are influenced by market sentiment, interest rate differentials, and exchange rate expectations.
Types of Portfolio Investments
Equity Investments: Buying shares in foreign companies.
Debt Investments: Investment in foreign bonds or debt instruments.
Mutual Funds & ETFs: Indirect investment through global funds.
Advantages of Portfolio Investment
Provides liquidity to financial markets
Encourages efficient capital allocation
Access to higher returns
Risks of Portfolio Investment
Sudden outflows due to changes in global investor sentiment
Exchange rate risks affecting returns
Vulnerability to financial crises
2.3. Other Investments
This category includes capital flows that are not strictly FDI or portfolio investments but still impact the financial system significantly.
Examples
Bank Loans & Trade Credits: Funds borrowed from foreign banks or trade partners.
Currency & Deposit Flows: Short-term movements of foreign currency deposits.
Intercompany Loans: Funds transferred between parent companies and subsidiaries.
Advantages
Provides short-term liquidity to markets
Facilitates international trade and business operations
Risks
Susceptibility to sudden reversals
Exchange rate volatility impacts repayment costs
2.4. Financial Derivatives
Derivatives such as forwards, futures, options, and swaps also constitute capital flows in the form of investment in risk management and speculative activities. Though not physical capital, these instruments influence liquidity, hedging, and capital allocation in global markets.
3. Direction of Capital Flows
Capital flows can be inflows (into a country) or outflows (from a country). Each type has different economic implications.
3.1. Capital Inflows
Capital inflows bring foreign funds into a domestic economy.
Benefits: Boosts investment, improves liquidity, strengthens currency reserves.
Risks: Can create asset bubbles, currency appreciation, and overdependence on foreign capital.
3.2. Capital Outflows
Capital outflows involve domestic capital moving abroad.
Reasons: Seeking higher returns, diversification, or risk hedging.
Risks: Can weaken domestic currency, reduce investment, and trigger financial instability.
4. Determinants of Capital Flows
Several factors influence the magnitude and direction of capital flows:
Interest Rate Differentials: Higher returns attract capital inflows.
Economic Growth Prospects: Fast-growing economies attract FDI and portfolio flows.
Political Stability & Policy Environment: Investor confidence depends on legal and political frameworks.
Exchange Rate Expectations: Anticipated currency appreciation or depreciation drives speculative flows.
Global Financial Conditions: Changes in global liquidity, crises, or monetary policies influence flows.
5. Risks and Challenges Associated with Capital Flows
While capital flows are essential for growth, they pose several risks:
Volatility Risk: Sudden inflow or outflow can destabilize financial markets.
Exchange Rate Risk: Large inflows can lead to currency appreciation, harming exports.
Debt Sustainability Risk: Excessive reliance on foreign borrowing may lead to debt crises.
Inflationary Pressure: Large capital inflows can increase money supply and inflation.
Policymakers often use capital controls, macroprudential measures, and hedging mechanisms to manage these risks.
6. Trends in Global Capital Flows
Global capital flows have changed significantly in recent decades due to globalization, technological advancement, and financial market liberalization:
Pre-2008 Crisis: Rapid growth in cross-border portfolio flows, especially to emerging markets.
Post-2008 Crisis: Greater emphasis on long-term FDI and cautious portfolio flows.
Current Trends: ESG-driven investments, digital asset flows, and regional investment blocs (e.g., ASEAN, EU).
7. Policy Implications
Governments and central banks actively manage capital flows to achieve economic stability:
Encouraging FDI: Through tax incentives, ease of doing business, and infrastructure development.
Regulating Portfolio Flows: To prevent sudden reversals affecting currency and financial markets.
Macroprudential Measures: Controlling credit growth, currency exposure, and leverage.
Capital Controls: Temporary restrictions on inflows or outflows to stabilize markets.
8. Conclusion
Capital flows are vital for the functioning and development of modern economies. They provide the necessary funds for investment, enhance financial market liquidity, and facilitate economic growth. However, the benefits of capital flows come with inherent risks, including volatility, currency fluctuations, and potential financial instability. Understanding the types, determinants, and impacts of capital flows is essential for policymakers, investors, and economists to maximize economic benefits while mitigating potential adverse effects.
By effectively managing capital flows, countries can harness global financial integration to fuel sustainable growth and development. As globalization continues, monitoring and adapting to changes in capital flows will remain a critical aspect of economic planning and financial stability.
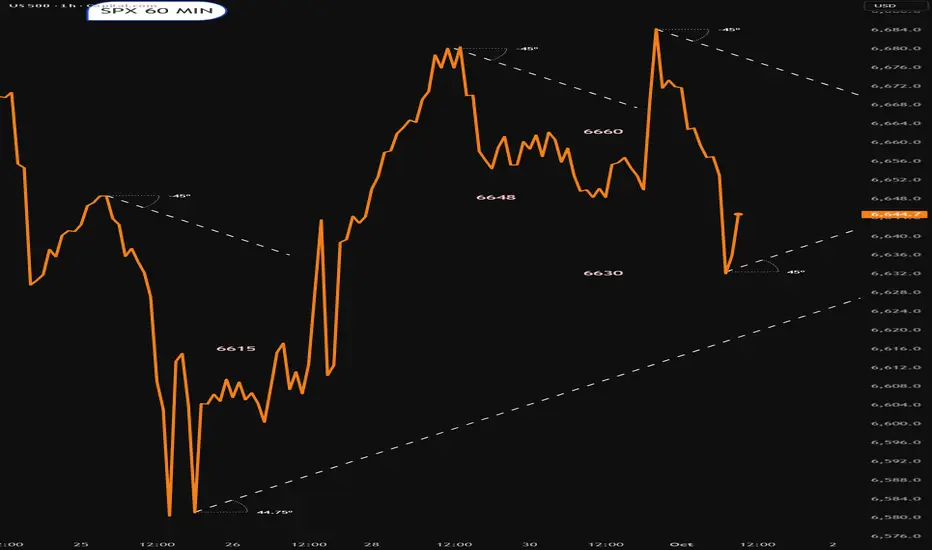
SPX500 – Bullish Bias Holds Above 6,680SPX500 – OVERVIEW
The price pushed higher last week following the PCE and GDP results, though uncertainty remains over a potential Fed rate cut at the next meeting.
Overall, the short-term trend remains bullish.
Upside Scenario:
Price is expected to test 6,699 and 6,708.
A confirmed break above these levels would open the way toward the next key target at 6,742.
Range Scenario:
If the index fails to hold above 6,700, expect consolidation between 6,700 and 6,672 until a decisive breakout occurs.
Pivot: 6,680
Resistance: 6,699 – 6,708 – 6,742
Support: 6,680 – 6,662 – 6,634

The S&P500 continues its climbRisk, (S&P500), continues to drive forward to new all time highs. 7000 is getting closer. The bullish channel suggests a 7000 target date window of 21 Oct to 15 Dec of this year. Let's see what happens.
#SP500
#SP500Trading

The Truth Behind Profitable TRADING ( must read)Please note : This post isn't meant to scare you away from trading. Quite the oposite. It's meant to show you what NO ONE TALKS ABOUT IT. Better to see it clearly now than learn it expensively later. This post comes from someone with more than 7 years of market experience
♾️How To Really Become Profitable?
Profitable trading is not about finding a magic holy grail, strategy, course or even mentor.
Of course, they can help you, but at the end of the day... You are the ONLY ONE behind the final click.
Profitable trading is all about you! but how?
Let’s get into it !
The average human is not wired to properly trade the financial markets...We are wired in the worst way to be a consistently profitable trader. Trading goes against the human psychology.
To all those learning to trade the financial markets, this game is not what you think it is.
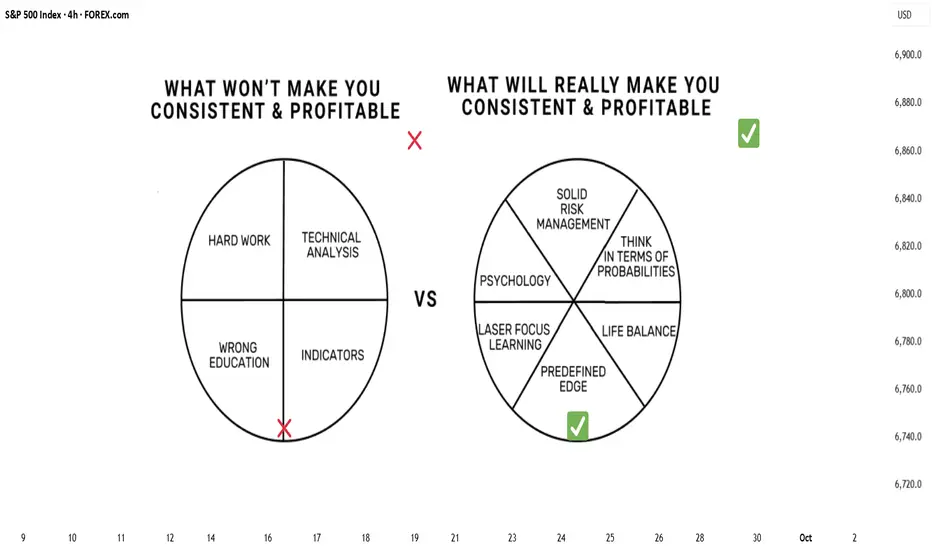
Most books and courses simply do not paint an accurate picture of the reality. Most of traders think the only way to become profitable is focusing on the wrong things:
❌ WHAT WON'T MAKE YOU PROFITABLE
MORE INDICATORS
MORE HARD WORK
MORE TECHNICAL ANALYSIS
MORE WRONG EDUCATION
The truth is that all of these will never really bring you consistent results.
Here’s a list of 6 elements that from my experience are game changers. I will go deep in each element so that you can really understand. Do us a favor and please support and comment this IDEA so that we can reach more traders.
The first and most important element:
✅ PROPER RISK MANAGEMENT
That is the number one killer and doer.
For most traders, they open a position size much larger than they can mentally afford. The problem is that by over risking you automatically let emotions have control over you.
someone once told me:
When emotions increase, accuracy decrease.
Trading is a Game of probabilities you can do everything right and end up wrong and you can do everything wrong and end up winning. There is a random distribution of winning and losing trades. You must be ready to become confortable by losing. You must understand your degree of tolerance. Only you know your risk profile. Only you know what you can afford to lose
Only you know the weight of your current life situation. Only you know you risk apetite.
If you are having a bad situation with risk, just reduce your risk so you can get back the control. You must find the proper position size. This is not about the size of your account or the size of the position in dollars. It's about how confortable you are with proper position sizing.
PROPER POSITION SIZE IS ALSO MENTAL !
✅ PROPER PSYCHOLOGY
For most traders without seing consistent results, they believe their system needs some implementations or modifications, and they focus more on the “analysis” side by learning more stuff. They are in a infinite loop hoping to find that next holy grail. The truth is that you don't need more technical analysis indicators or course. You just need to sit in front of a mirror and understand how your bain acts when you trade.
You must understand how you are affected when trading.
There are many psychological aspects you should focus. We can talk years about it. I advise you to read Mark Douglas for that. One of the most important things is to Dissolve or reduce all your fears. You must learn to trade by dealing daily with your FEARS. You must understand and have a deep talk with yourself to see the way fear control your mind.
Here are 4 types of fears when it comes to trading:
Fear of being wrong
Losing money ,
Distribute profit
Missing out
By other side you must understand the neuro associative conditioning that created good trading habits and self-destructive habits.
Here are some examples of different neuro associative conditioning:
Pro trades see retracements as opportunity to add to their positions while newbies see retracements as threats and might close the trade in profit in a simple pullback.
Pro traders have hope when they have a winning trade and despair when they have a losing trade. While newbies have hope when they have a losing trade because they don't want to be proven wrong, they also have despair to distribute profits when they have a winning trade simply doing a pullback
there are infinite examples. EVERY TRADER HAS IT'S OWN neuro associative conditioning that make or break them.
✅ Healthy LIFE BALANCE
As Paul Sartre said, we are our choices.
What we do with our 24 hours will define the kind of person we are & we become. This is all about changing and adopting proper habits in your pro and personal life.
If you don't manage to balance your personal life... All those bad vibes will send resistive energy and when you get this energy you can either shut down or step through and doo exactly what you are supposed to do regardless. Take care of your personal habits and problems.
Avoid bad habits that drain your energy and focus on good habits that will make your BODY MIND perform well or at least well such as working out, sleeping well, eating clean etc...
Trading is not made for the undisciplined human being. Take care of your body & mind.
Before getting serious with trading, I I used to have a lot of bad habits that honestly, I’m not proud of it. But everything can change.
It’s all about building a proper internal well-being environment.
✅ THINK IN TERMS OF PROBABILITIES
Mismanaging risk is a bad habit. Most of traders have the worst trading habits because they asume the outcome and they don’t like to be wrong. They assume they know what the outcome will be, so they bail out of trades. They think it will make them more money, so they risk more in one single trade because they believe this trade is a high probability one that it will make them money. They have a trade by trade approach. they execute with a Can’t lose mentality
They assume that after a few wins the next trade is likely to be a winner, so they double up. They assume that after a few losses the next trade is likely to be a loss, so they do not execute or they reduce the risk.
It’s okay we all have been there.
By adopting simple proper” SERIES OF TRADE APPROACH” your outcome will change and you will become profitable in the long run. This is what we call think in terms of probabilities.
This is the approach that a few minorities of the traders use. This approach is not based on predicting anything; rather this is a precise pre-defined system of pulling the trigger when your system or edge presents itself, and the outcome of the trade is irrelevant. ALL YOU CARE IS about the outcome of a series of trades.
We take a series of trades, and we are entirely focused on the outcome of the series, and NOT the outcome of each individual trade. The outcome of each trade and attempting to predict the outcome of each and every trade is an uphill battle. You won't be able to predict the outcome of one single trade but yes you will be able to predict the outcome of a series of trades
✅ SOLID PREDEFINED EDGE
Mentors can transfer you knowledge but never experience. You need to use their experience to create your own plan make sure to set rules to find good trades execute those good trades and let those good trades play out. Trading is very personal. What might work for some might not work for you and that's okay. What might work for you might not work for someone else. Everyone is different.
✅ LASER FOCUS LEARNING CURVE
Those who make it in this business were laser-focused; they made a decision to either be right or wrong. A laser shines a coherent beam of light and is powerfully focused on a single point. That point will undergo immense heat or pressure. Same applies to learning to trade. It requires all your energy to be put forth on a single objective.
Compare this with a light bulb or the sun, which shines its rays outwardly with its energy distributed in all directions. You will barely feel the heat as the energy is unfocused and dissipates accordingly. This applies to those traders who have issues They doubt their decisions and jump from one strategy to another they chase the holy grail they change from system, they buy multiple courses, change of style etc….. There is million ways to make money in the markets but only you will make it with your own way. My advice if to become like a laser focus.
SOLID EDGE SOLID EXECUTION NOTHING ELSE.
Make a decision and instead become focused like the laser beam on what it is that you desire to develop, and you are more likely to achieve your target.
In order to keep in mind this, remember this quote of Bruce Lee “I fear not the man who has practiced 10,000 kicks once, but I fear the man who has practiced one kick 10,000 times.”…
⚔️ Final Word
Trading can be simply if you focus on the right things and quit the wrong things.

SPX500 H1 | Bearish Momentum BuildingS&P500 is rising towards the sell entry at 6,647.13, which is an overlap resistance and could drop from this level to the take profit.
Stop loss is at 6,681.57, which is a multi-swing high resistance.
Take profit is at 6,614.24, which is a pullback support that aligns with the 61.8% Fibonacci retracement.
High Risk Investment Warning
Trading Forex/CFDs on margin carries a high level of risk and may not be suitable for all investors. Leverage can work against you.
Stratos Markets Limited (tradu.com ):
CFDs are complex instruments and come with a high risk of losing money rapidly due to leverage. 65% of retail investor accounts lose money when trading CFDs with this provider. You should consider whether you understand how CFDs work and whether you can afford to take the high risk of losing your money.
Stratos Europe Ltd (tradu.com ):
CFDs are complex instruments and come with a high risk of losing money rapidly due to leverage. 66% of retail investor accounts lose money when trading CFDs with this provider. You should consider whether you understand how CFDs work and whether you can afford to take the high risk of losing your money.
Stratos Global LLC (tradu.com ):
Losses can exceed deposits.
Please be advised that the information presented on TradingView is provided to Tradu (‘Company’, ‘we’) by a third-party provider (‘TFA Global Pte Ltd’). Please be reminded that you are solely responsible for the trading decisions on your account. There is a very high degree of risk involved in trading. Any information and/or content is intended entirely for research, educational and informational purposes only and does not constitute investment or consultation advice or investment strategy. The information is not tailored to the investment needs of any specific person and therefore does not involve a consideration of any of the investment objectives, financial situation or needs of any viewer that may receive it. Kindly also note that past performance is not a reliable indicator of future results. Actual results may differ materially from those anticipated in forward-looking or past performance statements. We assume no liability as to the accuracy or completeness of any of the information and/or content provided herein and the Company cannot be held responsible for any omission, mistake nor for any loss or damage including without limitation to any loss of profit which may arise from reliance on any information supplied by TFA Global Pte Ltd.
The speaker(s) is neither an employee, agent nor representative of Tradu and is therefore acting independently. The opinions given are their own, constitute general market commentary, and do not constitute the opinion or advice of Tradu or any form of personal or investment advice. Tradu neither endorses nor guarantees offerings of third-party speakers, nor is Tradu responsible for the content, veracity or opinions of third-party speakers, presenters or participants.

Quarterly Holdings Report:Quarterly Holdings Report:
Ripple/XRP
Dogecoin/DOGE
Ryujin/RYU
Amaterasu Omikami
Floki Inu
Brett (Based)
Injective/INJ
Render/RNDR
BITI:US
AAPL:US
NVDA:US
WEC:US
TJX:US
VGT:US
HD:US
GLD:US
LOW:US

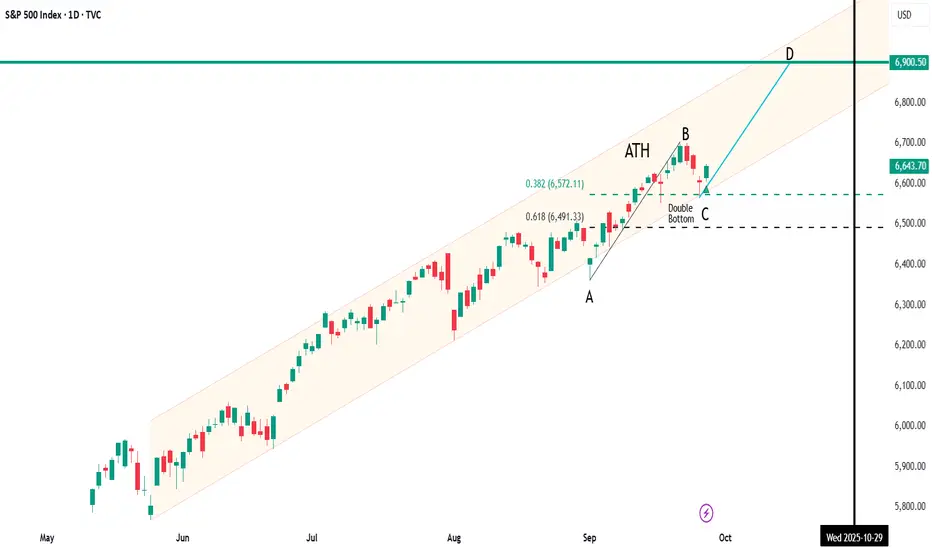
SPX Daily OutlookThe index continues to trade inside a well-defined rising channel. After setting a new ATH at point B, price retraced into a double bottom at C near the 6,600 support zone — aligning with the 0.328 retracement. The rebound from that level keeps the bullish structure intact.
⚡ Key Levels to Watch:
Support: 6,600 (double bottom / fib confluence)
Resistance: 6,670–6,700 (prior high & channel midline)
Upside target: 6,900 (channel top / point D projection)
As long as 6,600 holds, the path of least resistance favors a move toward 6,900. A decisive break below 6,600, however, would signal weakness and open the door to deeper downside.
The S&P 500 Index Remains Positive Against the OddsThe S&P 500 Index Remains Positive Against the Odds
Today, the S&P 500 Index is trading close to a new all-time high, having opened Monday above 6,675 points. This reflects continued optimism among market participants despite factors such as:
→ The risk of a U.S. government shutdown on 1 October.
Today, President Trump will meet with Democratic and Republican leaders in Congress to try to prevent a halt to government funding. However, Reuters reports that chances of reaching an agreement are slim. At the same time, Bank of America analysts remain calm, noting that a shutdown would shave only around 0.1% off GDP per week, and historically such closures have had little impact on financial markets.
→ Jerome Powell’s hawkish stance at the September Federal Reserve meeting.
Nevertheless, most market participants expect the Fed to make another move towards cutting rates at its next meeting on 29 October. The publication of the PCE index on Friday increased this likelihood, as the figures came in line with forecasts, reducing the risk of a renewed inflation surge.
Technical Analysis of the E-mini S&P 500 Chart
On 17 September, analysing the 4-hour chart of the S&P 500 Index, we noted:
→ the price continues to fluctuate within an ascending channel, highlighted in blue;
→ the long body of the bullish candle on 11 September points to strong buyer pressure, indicating an imbalance, or, in Smart Money Concept terminology, a Fair Value Gap (FVG).
At present, the channel remains relevant, but it has expanded — bullish sentiment has shifted the key line (marked in orange) from resistance to support. At the same time, the FVG zone has confirmed its role as support.
Possible developments: the chart indicates a buyer advantage:
→ strong demand near the channel’s median (evident in the long lower shadows from Friday, marked with an arrow);
→ buying activity has been strong enough to push the price back (for now) within the ascending channel.
If buyer dominance continues, this could lead to a new all-time high, testing the upper boundary of the channel. From a bearish perspective:
→ the psychological level of 6,700 could act as resistance;
→ continued growth at Monday’s open could push the RSI indicator into overbought territory, creating potential for a correction.
However, as long as the S&P 500 Index remains above the orange support line, there is reason to believe that the bulls remain in control.
This article represents the opinion of the Companies operating under the FXOpen brand only. It is not to be construed as an offer, solicitation, or recommendation with respect to products and services provided by the Companies operating under the FXOpen brand, nor is it to be considered financial advice.

SPX: modest pullback, eyes on jobsDuring the previous week a small correction occurred on the US equity markets. The S&P 500 slipped down to the level of 6.570 on Thursday, but ended the week at 6.643. Regardless of a modest correction, the index is still moving close to the overbought territory. The key U.S. economic indicator this week was the August PCE Price Index. It rose 0.3% month-over-month, pushing the annual rate to 2.7%. Core PCE, which excludes food and energy, increased 0.2% m/m and 2.9% y/y. As per CME Fed WatchTool investors are continuing to price two rate cuts till the end of this year.
Among the biggest losers in the index was CarMax, whose stock plunged around 20 % after disappointing earnings and weak commentary about demand and inventory pressures. Oracle also underperformed, falling 5.6 % after concerns were raised over optimistic cloud growth projections. On the upside, Intel was a top gainer in the S&P 500 that day, surging 8.9 %, driven by reports of possible investment talks with Apple. IBM also posted a strong gain (5.2 %), buoyed by optimism around applying its quantum computing capabilities to bond trading.
The week ahead will be focused on US jobs data. The JOLTs Job Openings in August and Unemployment rate will be posted. This might bring again some higher volatility to the US stock markets, especially if data do not meet investors expectations.
Despite AI valuation pressures, US500 outlook remains positive.
Robust US data tempered Fed rate-cut bets, dragging equities lower for a third day, though investors expect the pullback to be short-lived. Nvidia’s (NVDA) 100 bln USD investment in OpenAI has raised questions over vendor financing risks, deepening worries over elevated valuations. Still, institutions expect US equities to hold a tactical bullish stance. JPMorgan (JPM) projected that while a government shutdown and fragile sentiment may trigger midweek weakness, solid economic growth, a resilient labor market, and AI momentum could drive the S&P; 500 to 7,000 by year-end.
US500 remains within the ascending channel, sustaining its steady uptrend. After briefly testing EMA21 and the channel’s lower bound, the index rebounded, indicating the potential extension of a bullish structure. If US500 continues to hold within the channel, the index may gain upward momentum toward the resistance at 6700. Conversely, if US500 breaks below the channel’s lower bound and EMA21, the index could retreat toward the support at 6530.

SPX500USD could go up againHi traders,
Last week I said we could see a little more upside and a bigger correction down for (orange) wave 4 for SPX500USD. And this is exactly what happened.
So next week we could see more upside again to make a new ATH.
Let's see what the market does and react.
Trade idea: Wait for a small pullback down and a change in orderflow to bullish on a lower timeframe to trade longs.
If you want to learn more about trading FVG's & liquidity sweeps with Elliott wavecount and patterns, then please make sure to follow me.
This shared post is only my point of view on what could be the next move in this pair based on my technical analysis.
Don't be emotional, just trade your plan!
Eduwave

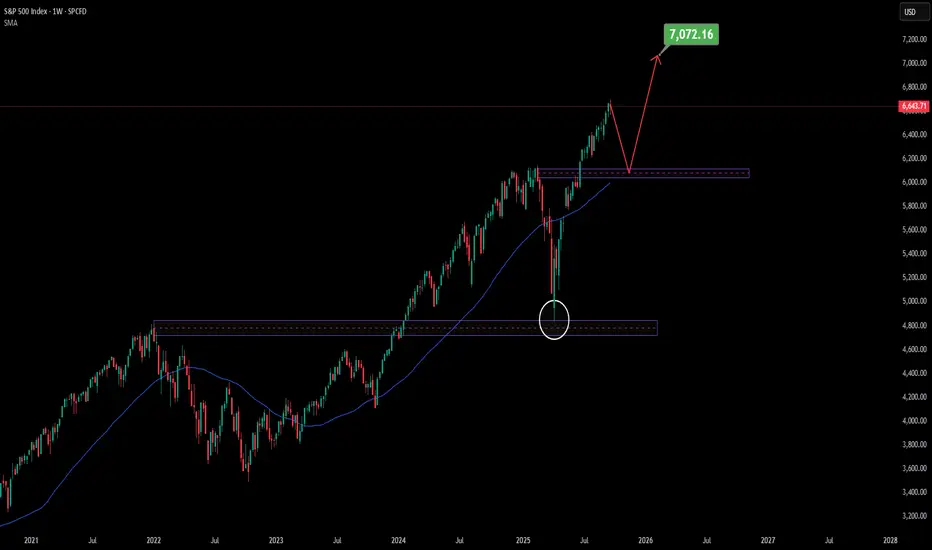
My view on S&P 500Looking at the structure, I think the S&P 500 may first pull back to retest the support zone, just as it did in April of this year when price dipped to that same area before continuing higher.
This time, the support and the 50-week SMA are aligning together, creating a strong confluence that could serve as a base for the next upward move.
From there, my view is that SPX could rebound and eventually push into a new all-time high around 7,000.
🎯 Conclusion: My outlook is constructive — I expect SPX to repeat its April-like retest, find strength at the confluence of support and the 50 SMA together, and then rally toward the 7,000 level. Still, markets are unpredictable, and this remains only my view.
👉 For more structured market insights and professional analysis, follow along.
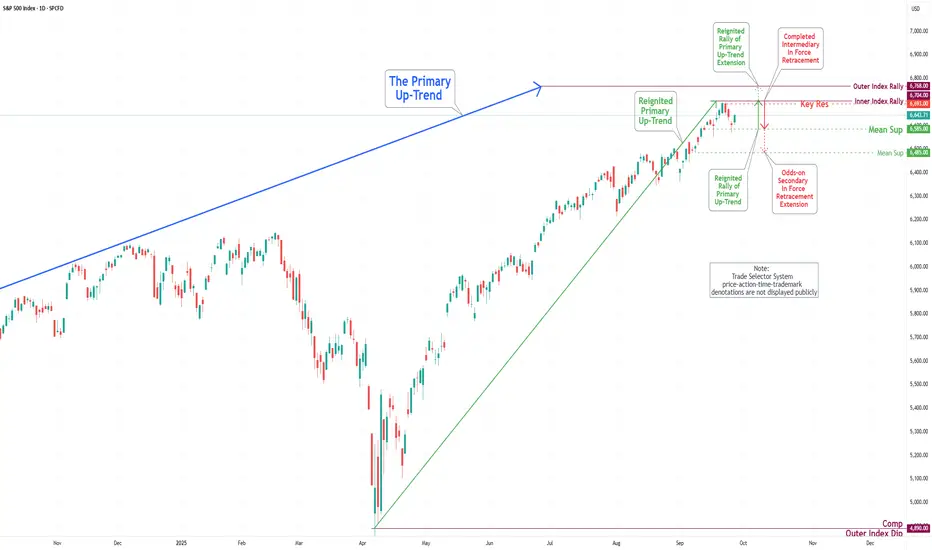
S&P 500 Daily Chart Analysis For Week of Sep 26, 2025Technical Analysis and Outlook:
During the aforementioned week's trading session, the S&P 500 Index experienced a notable decline after reversing near the Inner Index Rally level of 6704, which resulted in a vigorous drop to our designated Mean Support target of 6585. The index is currently moving towards the established Key Resistance target of 6693 and is positioned to fully complete the Inner Index Rally at 6704, presenting the potential for additional upward momentum that could extend to the Outer Index Rally level of 6768.
It is imperative to recognize, however, that upon reaching the Key Resistance target of 6693 and the Inner Index Rally at 6704 targets, we may observe a retest pullback toward the Mean Support level of 6585, with the possibility of a further decline extending to the Mean Support target at 6485.
S&P500 CHART UPDATE !!S&P 500 Analysis
The S&P 500 is trading near 6,650, moving strongly within its ascending channel.
Support: 6,400 – key level to hold for bullish momentum.
Resistance: 6,800 – a breakout could open the door toward 7,200.
The trend remains bullish, and staying above the midline keeps upside potential intact.
A breakdown below 6,400 may signal a short-term correction.

US500: 7K ASSAULT BEGINS! Mega Bull Flag Breakout 🚀 US500: 7K ASSAULT BEGINS! Mega Bull Flag Breakout 📊
Current Price: 6,646.2 | Date: Sept 27, 2025 ⏰
📈 INTRADAY TRADING SETUPS (Next 5 Days)
🎯 BULLISH SCENARIO
Entry Zone: 6,630 - 6,650 📍
Stop Loss: 6,590 🛑
Target 1: 6,720 🎯
Target 2: 6,780 🚀
🎯 BEARISH SCENARIO
Entry Zone: 6,670 - 6,690 📍
Stop Loss: 6,720 🛑
Target 1: 6,580 🎯
Target 2: 6,520 📉
🔍 TECHNICAL ANALYSIS BREAKDOWN
📊 KEY INDICATORS STATUS:
RSI (14): 61.2 ⚡ *Bullish Momentum Building*
Bollinger Bands: Coiling for Expansion 🔥
VWAP: 6,635 - Acting as Launch Pad 💪
EMA 50: 6,610 ✅ *Golden Cross Confirmed*
Volume: Institutional Accumulation 📊
🌊 WAVE ANALYSIS:
Elliott Wave: Wave 4 Triangle Complete 🌊
Target: Wave 5 Extension to 7,000+ 🎯
🔄 HARMONIC PATTERNS:
Bullish Butterfly at 6,600 Support ✨
ABCD Pattern targeting 6,780 🔄
⚖️ SWING TRADING OUTLOOK (1-4 Weeks)
🚀 BULLISH TARGETS:
Psychological: 7,000 🏆
Monthly Target: 6,850 🌙
Gann Resistance: 6,900 ⭐
📉 BEARISH INVALIDATION:
Weekly Support: 6,550 ⚠️
Critical Level: 6,480 🚨
🎭 MARKET STRUCTURE:
Trend: Ascending Triangle 💪
Momentum: Coiling Energy 🔥
Wyckoff Phase: Spring Loading 📈
Ichimoku: Bullish Cloud Break 🟢
🏆 MEGA PATTERN ALERT:
Bull Flag Pole: 6,400 → 6,700 📏
Flag Consolidation: 6,600-6,680 🚩
Breakout Target: 6,980 (300pt move!) 💥
⚡ RISK MANAGEMENT:
Max Risk per Trade: 1.5% 🛡️
R:R Ratio: Minimum 1:2.5 ⚖️
Breakout Confirmation: 6,690 close 📏
🌍 MARKET CATALYSTS:
Q3 Earnings Beating Expectations 📈
Fed Dovish Stance Supporting Risk-On 🏛️
Economic Resilience Narrative Strong 💼
🔥 KEY LEVELS TO WATCH:
Breakout Zone: 6,680-6,700 💥
Support Cluster: 6,620 | 6,580 | 6,550 🛡️
Resistance: 6,720 | 6,780 | 6,850 🚧
🎯 FINAL VERDICT:
S&P500 primed for EXPLOSIVE 7K RALLY! 🚀
Bull flag completion = 300+ point surge! 💯
Multiple timeframes align perfectly! 📈
Trade Management: Scale into dips above 6,620 💎
Breakout Alert: Watch 6,690 decisive close! 🔔
---
*⚠️ Disclaimer: High-risk trading. Use strict risk management. Educational analysis only.*
For individuals seeking to enhance their trading abilities based on the analyses provided, I recommend exploring the mentoring program offered by Shunya Trade. (Website: shunya dot trade)
I would appreciate your feedback on this analysis, as it will serve as a valuable resource for future endeavors.
Sincerely,
Shunya.Trade
Website: shunya dot trade
🔔 Follow for 7K Journey Updates | 💬 What's Your 7K Timeline?