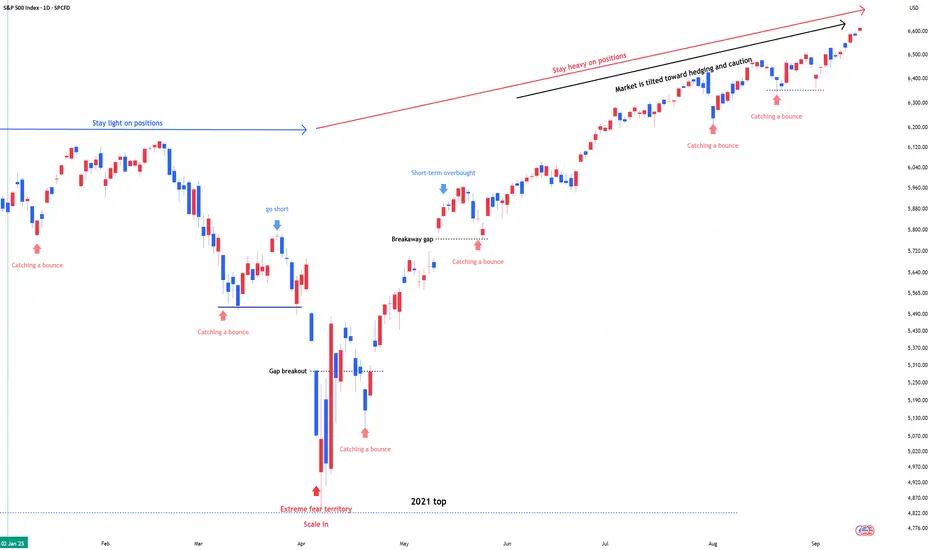
SPX & NDX : Stay heavy on positionsSPX & NDX : Stay heavy on positions (2x leverage)
- Market slowly shifting from sidelines to risk-on.
** This analysis is based solely on the quantification of crowd psychology.
It does not incorporate price action, trading volume, or macroeconomic indicators.
SPCUSD trade ideas
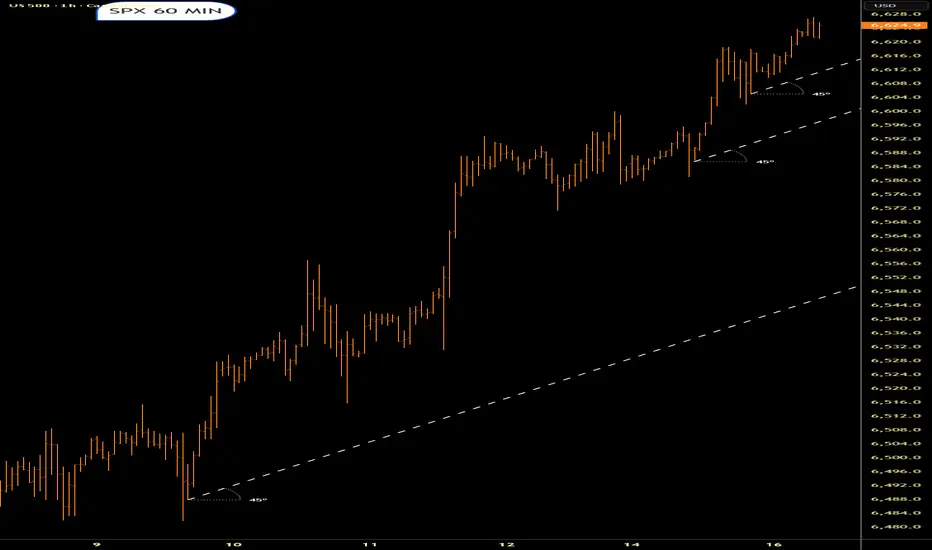
SPX updated.No sign of a turn as yetNo real reaso to sell as yet.The character of the chart needs to change
The Global Shadow Banking System1. Understanding Shadow Banking
1.1 Definition
Shadow banking refers to the system of credit intermediation that occurs outside the scope of traditional banking regulation. Coined by economist Paul McCulley in 2007, the term highlights how non-bank entities perform bank-like functions such as maturity transformation (borrowing short-term and lending long-term), liquidity transformation, and leverage creation—yet without the same safeguards, such as deposit insurance or central bank backstops.
1.2 Key Characteristics
Non-bank entities: Shadow banking is carried out by hedge funds, money market funds, private equity firms, securitization vehicles, and other institutions.
Credit intermediation: It channels savings into investments, much like traditional banks.
Regulatory arbitrage: It often arises where financial activity moves into less regulated areas to avoid capital and liquidity requirements.
Opacity: Complex instruments and off-balance sheet entities make it difficult to track risks.
1.3 Distinction from Traditional Banking
Unlike regulated banks:
Shadow banks cannot access central bank liquidity in times of crisis.
They lack deposit insurance, increasing systemic vulnerability.
They rely heavily on short-term wholesale funding such as repurchase agreements (repos).
2. Historical Evolution of Shadow Banking
2.1 Early Developments
Shadow banking’s roots can be traced to the 1970s and 1980s, when deregulation in advanced economies allowed financial innovation to flourish. Rising global capital flows created demand for new instruments outside traditional bank lending.
2.2 Rise of Securitization
The 1980s–2000s saw the explosion of securitization, where loans (e.g., mortgages) were bundled into securities and sold to investors. Special Purpose Vehicles (SPVs) and conduits became central actors in shadow banking, financing long-term assets with short-term borrowing.
2.3 Pre-Crisis Boom (2000–2007)
The shadow system expanded rapidly before the 2008 financial crisis. Investment banks, money market funds, and structured investment vehicles financed trillions in mortgage-backed securities (MBS) and collateralized debt obligations (CDOs). This system appeared efficient but was highly fragile.
2.4 The 2008 Financial Crisis
When U.S. subprime mortgage markets collapsed, shadow banks faced a sudden liquidity freeze. Lacking deposit insurance and central bank support, institutions like Lehman Brothers collapsed, triggering global contagion. The crisis revealed the systemic importance—and dangers—of shadow banking.
2.5 Post-Crisis Reconfiguration
After 2008, regulators tightened banking rules, pushing even more activities into the shadow system. Simultaneously, reforms such as tighter money market fund rules sought to contain systemic risks. Despite these efforts, shadow banking has continued to grow, especially in China and emerging markets.
3. Structure of the Shadow Banking System
The shadow banking universe is diverse, consisting of multiple actors and instruments.
3.1 Key Entities
Money Market Funds (MMFs) – Provide short-term financing by investing in highly liquid securities.
Hedge Funds & Private Equity – Use leverage to provide credit, often in riskier markets.
Structured Investment Vehicles (SIVs) – Finance long-term securities through short-term borrowing.
Finance Companies – Offer consumer and business loans without deposit funding.
Broker-Dealers – Rely on repo markets to fund securities inventories.
Securitization Conduits & SPVs – Issue asset-backed securities (ABS).
3.2 Instruments and Mechanisms
Repos (Repurchase Agreements) – Short-term loans secured by collateral.
Commercial Paper – Unsecured short-term debt issued by corporations or conduits.
Mortgage-Backed Securities (MBS) – Bundled mortgage loans sold to investors.
Collateralized Debt Obligations (CDOs) – Structured products pooling various debt instruments.
Derivatives – Instruments like credit default swaps (CDS) that transfer credit risk.
3.3 Interconnectedness
The system is deeply interconnected with traditional banks. Many shadow entities rely on bank credit lines, while banks invest in shadow assets. This interdependence amplifies systemic risk.
4. Global Dimensions of Shadow Banking
4.1 United States
The U.S. remains the epicenter, with trillions in assets managed by MMFs, hedge funds, and securitization vehicles. Its role in the 2008 crisis highlighted its global impact.
4.2 Europe
European banks historically relied on securitization and repo markets, making shadow banking integral to cross-border finance. Luxembourg and Ireland are major hubs due to favorable regulations.
4.3 China
China’s shadow banking system emerged in the 2000s as a response to tight bank lending quotas. Wealth management products (WMPs), trust companies, and informal lending channels fueled rapid credit growth. While supporting growth, they also raised concerns of hidden debt risks.
4.4 Emerging Markets
In Latin America, Africa, and Southeast Asia, shadow banking fills credit gaps left by underdeveloped banking sectors. However, limited oversight raises systemic vulnerabilities.
5. Benefits of Shadow Banking
Despite its risks, shadow banking provides several advantages:
Credit Diversification – Expands funding beyond banks.
Market Liquidity – Enhances efficiency in capital markets.
Financial Innovation – Encourages new instruments and risk-sharing mechanisms.
Access to Credit – Supports SMEs and consumers underserved by traditional banks.
Global Capital Mobility – Facilitates international investment flows.
6. Risks and Challenges
6.1 Systemic Risk
Shadow banking increases interconnectedness, making financial crises more contagious.
6.2 Maturity and Liquidity Mismatch
Borrowing short-term while investing in long-term assets creates vulnerability to runs.
6.3 Leverage
High leverage amplifies both profits and losses, making collapses more severe.
6.4 Opacity and Complexity
Structured products like CDOs obscure underlying risks.
6.5 Regulatory Arbitrage
Activities shift to less regulated domains, making oversight difficult.
6.6 Spillover to Traditional Banking
Banks are exposed through investments, credit lines, and funding dependencies.
Conclusion
The global shadow banking system is a double-edged sword. On one hand, it enhances financial diversity, supports credit creation, and fuels innovation. On the other, it introduces opacity, leverage, and systemic fragility that can destabilize economies. The 2008 crisis demonstrated how vulnerabilities in the shadow system can trigger global turmoil.
Going forward, regulators must adopt balanced approaches: tightening oversight without stifling beneficial innovation. International coordination is critical, given the cross-border nature of shadow banking. As financial technology evolves, the boundaries between traditional banks, shadow entities, and digital platforms will blur even further.
Ultimately, shadow banking is not merely a “shadow” but an integral part of modern finance—one that demands vigilance, transparency, and adaptive regulation to ensure it serves as a force for stability and growth rather than crisis and contagion.
A Tolled BellThe first bell has rung. A bridge is being paved across the $6000 range.
IF it blows up, it likely won't happen until the bridge is constructed and sentiment improves. Expect a few heartfelt endeavors to shoot above $6,660. Base case is long term crab market.

it's always the market of stockpickersS&P 500 (SPX): The uptrend continues, with the SPX reaching a new high and nearing a secondary target of 6,625. However, there are significant risks, including historically poor performance during the last ten trading days of September, which coincides with an expected Fed rate cut on September 17. Other risks include narrowing market breadth, NVIDIA's stock trading in a narrow range, and a "Dow Theory" divergence where the industrial average's breakout is unconfirmed by the transportation average.

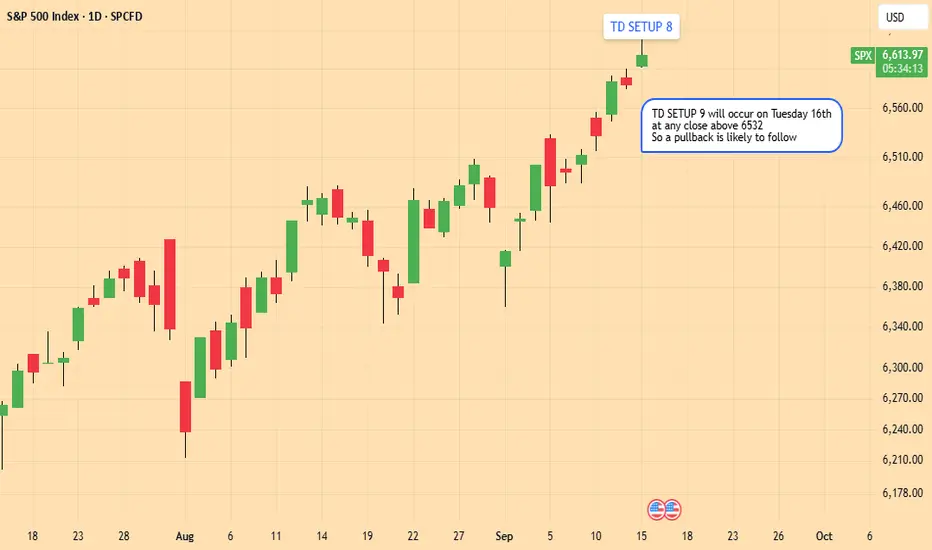
SPX : close to a pullbackToday's close will mark Tom Demark TD SETUP 8.
TD SETUP 9 is in the cards on Tuesday 16th September, after which a small pullback is likely
S&P500 | H1 Head and shoulders | GTradingMethodHello Traders.
🧐 Market Overview:
I am still holding a short on the rising wedge visible on the 4-hour chart. While the S&P 500 has broken out to the upside of the wedge, there’s still a real chance this could be a fake out.
The RSI is showing overbought conditions across the 1H, 2H, and 4H timeframes, which makes it difficult for price to push higher without cooling off first. From a probability standpoint, I see the short as more favorable here than chasing longs.
With hindsight I should have waited for a reversal pattern to open shorts when trying to trade the risking wedge on the 4 hour chart.
If the head and shoulders pattern on the 1H chart fails, then a possible double top on the 2H chart may form. I’ll post an update if that scenario plays out and I have time.
NB! I do not have confirmation to enter the head and shoulders short yet. It is only on my radar for now.
📊 Trade Plan:
Risk/Reward: 3.8
Entry: 6 589.7
Stop Loss: 6 599
Take Profit 1 (50%): 6 560.2
Take Profit 2 (50%): 6 544.2
💡 GTradingMethod Tip:
A favorable setup doesn’t guarantee success, but managing risk and aligning with probability is how I stay consistent over the long term.
🙏 Thanks for checking out my post!
Make sure to follow me to catch the next idea and please share your thoughts — I’d like to hear them.
📌 Please note: This is not financial advice. This content is to track my trading journey and for educational purposes only.


sp500 4hTrading Outlooks for the Week Ahead
In this series of analyses, we review short-term trading outlooks and perspectives.
As can be seen, in each analysis there is a key support/resistance zone close to the current price of the asset. The market’s reaction to or breakout from these levels will determine the next price movement toward the specified targets.
Important Note: The purpose of these trading outlooks is to highlight critical price levels ahead and the market’s potential reactions to them. The analyses provided are by no means trading signals!

Short SPX-Short SPY with sideways movement into rates
-expect jump for rates conference
-post rates tapers down into end of Sept

Crack-Up BOOM and BUSTHey everyone, Wave-Tech here. Join me on a historic journey as I reconstruct the Grand Super Cycle while diving into the historic and captivating world of Elliott Wave Theory!
This was to have been my maiden video cast—it didn't turn out as well as I hoped. Time got away from me, and the video ended abruptly before I could finish.
Rather than redoing it, I decided to keep the first and most authentic take intact for better or worse.
I made it private so that I could review it before publishing; however, I let too much time pass and was unable to change the setting back to public from private .
You can view the private video HERE :
The accompanying text is beneath the chart below:
In the simplest terms, Elliott Wave Theory is a measure of market psychology and sentiment coupled with Fibonnaci ratios designed to create a structural framework for determining at what stage of advance or decline a given market is in.
The basic premise for inherent advance and progress is three steps forward (impulse waves 1, 3, and 5) and two steps back (corrective waves 2 and 4).
According to Elliott, there are 9 degrees of trend, all of which are fractal in nature. The largest is the Grand Super Cycle, and the smallest is the Sub-Minuette.
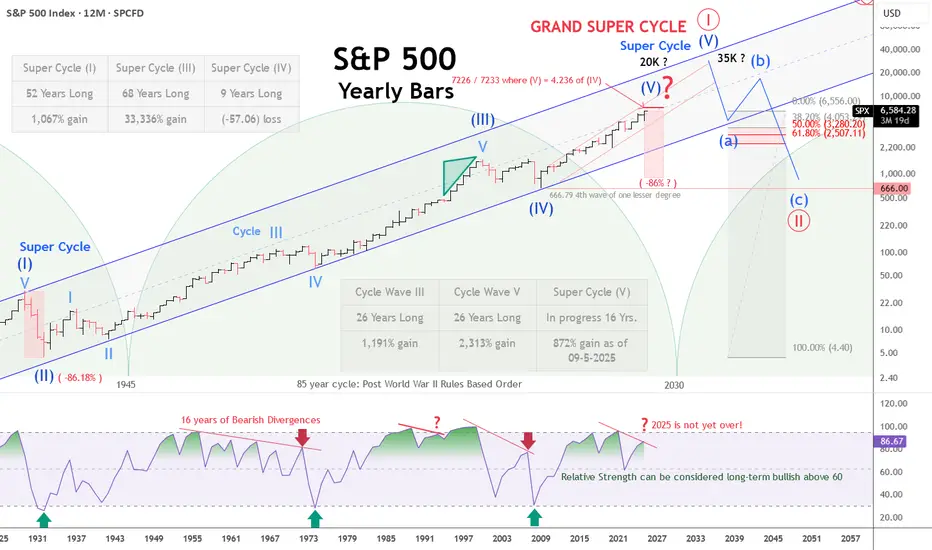
Today, we’re exploring a yearly bar chart of the S&P, which covers trends at the Super Cycle and Cycle degree, revealing the pending culmination of a Grand Super Cycle—a colossal trend spanning centuries.
Buckle up as we unravel the rhythms of the stock market's epic ride!
The SUPER CYCLE:
Let’s start with the big picture: five waves of advance at the Super Cycle degree.
According to Ralph Nelson Elliott, with the sole exception of the GRAND SUPER CYCLE, the Super Cycle is the largest of all trends, a monumental set of impulsive and corrective waves that will set the tone and punctuate Grand Super Cycle terminals for Centuries to come—or at least through the fall of Empires or Civilizations.
Each of these waves tells a story of growth, correction, and renewal. The current Grand Super Cycle has been shaping markets and Nations for over a century. We can see this Grand Super Cycle unfolding in waves of Super Cycle dimension.
WAVE COUNTS:
The chart highlights five waves at Super Cycle degree: the first lasted 52 years with a gain of more than 1000%, the third stretched 68 years with a staggering 33,336% gain, and the fourth, a shorter 9-year span, saw a -57.06% loss, which marked the GFC low in 2009.
We are currently in the fifth Super Cycle wave, which is still unfolding and could mark the end of this Grand Super Cycle at any moment.
In contrast, the post-GFC "everything bubble" Crack-Up BOOM can persist to the upper trend channel boundaries noted near 18k and 35k.
Zooming in, we encounter the fractal Cycle degree waves comprising Super Cycle (III). Take Cycle Wave III and Cycle V, both 26 years long, delivering gains of 1,191% and 2,313% respectively.
And from the Super Cycle wave (IV) low in 2009, we are 16 years into Super Cycle Wave V, with an impressive 872% gain as of September 5, 2025.
This current wave could easily extend further, but its length is sufficient to suggest we may be nearing a pivotal turning point that might end the Grand Super Cycle with a sufficient black swan trigger.
The Fourth Turning:
Now, let’s touch briefly on the 85-year cycle, a rhythm that syncs beautifully with the concept of the "fourth turning"—a period of crisis and transformation.
The last one kicked off in 1945, post-World War II, ushering in the rules-based order that America and the West thrived in—an order that is arguably destined to end by 2030 if it hasn't already. This turning cycle hints at a historic shift on the horizon, or one that is currently already underway.
THE RSI:
Glance at the lower pane of the chart, where the Relative Strength Index (RSI) reveals a tale of caution. Since 1955, we’ve endured 16 long years of multiple bearish divergences—times when the market’s price and momentum didn’t align, signaling trouble ahead.
I like to call this the bearish divergences that cried wolf for nearly a generation! Note that it wasn't until the RSI closed beneath the mid-line that the sell-off into the 1974 low registered an oversold reading.
We saw the RSI fail again upon the new highs in 1993-94 following the highs in 1987.
1995 kicked off the infamous five years of irrational exuberance, which led to the tech bubble peak and subsequent crash into the 2002 low.
Not to be outdone by the 2000 blow-off top, the 2002 low ushered in yet another five years of irrational exuberance, culminating right in time for the 2008 Global Financial Crisis. This time, the RSI finally got it right on the first go round.
Currently, against the highs printed in 2021, the V-shaped snap-back rally following the mini bear market of 2022, the move to new highs in 2024 has flagged a bona fide bearish divergence. It will be interesting to see how the RSI looks after the close of 2025.
These divergences are like red flags, whispering that the party might not last forever, even though it may.
Price Targets:
So, where might this Super Cycle Wave V take us in terms of price? Let’s apply a Fibonacci projection—specifically, where Wave V equals 4.236 of Wave IV.
Doing the math, from the Wave IV base at 666.79, we’re looking at a target of around 7,226-7,233 on the S&P 500.
That’s only about 10% upside from recent highs—not quite the blow-off top of 18K or 35K, but a target to approach with eyes wide open.
Now, let’s consider a sobering scenario:
If Super Cycle Wave V ends here, or north of 7K, signaling the close of Grand Super Cycle ONE, history might repeat itself with a bear market akin to 1929’s four-year plunge.
An 86% decline could drop the S&P to around 917—still well above the Wave IV low of 666.79, another common target, but a stark reminder of the cycles’ power.
In Closing:
Thank you all for listening and reading if you've gotten this far. This was my first video. I got blindsided and cut off by the time constraint, so I apologize for the abrupt ending.
The market’s cycles and waves are a dance of numbers and human spirit, and we’ve only scratched the surface of their grandeur and implications.
Stay curious, stay informed, and keep your life vests on while riding these waves, okay!
When you start to think this time it's different...When you start to think this time it's different...
That nothing can stop stocks from going perpetually up...
Without taking their habitual decade long pauses...
Then that is when you should start to worry.
SPX500USD could go higherHi traders,
Last week SPX500USD played out exactly as predicted in my previous outlook. Right at the open it started the upmove and it continued the whole week making a new ATH.
Next week we could see this pair going up some more.
Let's see what the market does and react.
Trade idea: Wait for a small pullback and a change in orderflow to bullish on a lower timeframe to trade longs.
If you want to learn more about trading FVG's & liquidity sweeps with Wave analysis, then please make sure to follow me.
This shared post is only my point of view on what could be the next move in this pair based on my technical analysis.
Don't be emotional, just trade your plan!
Eduwave

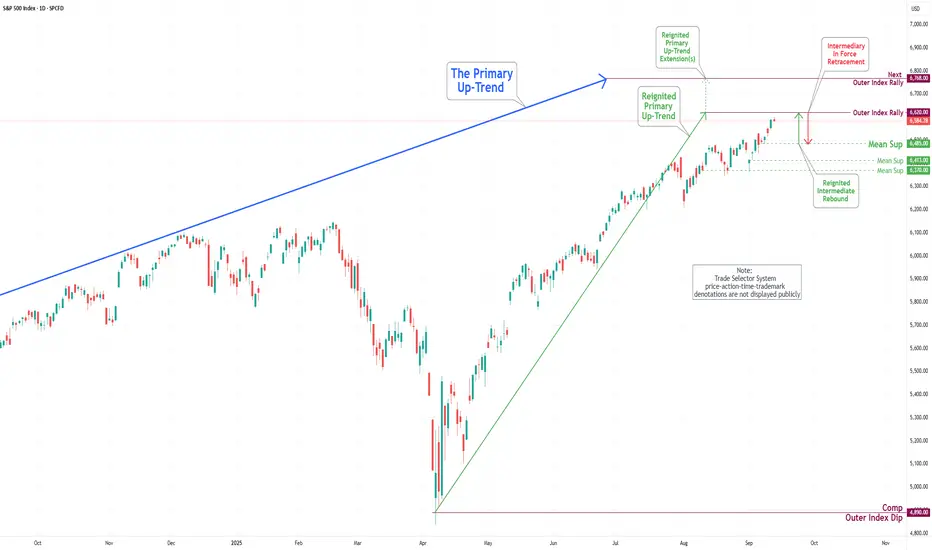
S&P 500 Daily Chart Analysis For Week of Sep 12, 2025Technical Analysis and Outlook:
In the previous trading session, the S&P 500 Index exhibited a substantial upward movement, reaching and completing the Outer Index Rally 6543, and it is striding towards our current designated target: Outer Index Rally 6620, as detailed in the prior S&P 500 Daily Chart Analysis.
It is critical to recognize that upon reaching this momentous target, the resulting price action is anticipated to initiate a significant pullback targeting the Mean Support level of 6485. This pullback is likely to facilitate a considerable rebound, allowing for a subsequent retest of the Outer Index Rally level of 6620.
Why Forex Reserves Matter in Trading1. What Are Forex Reserves?
Forex reserves are assets held by a nation’s central bank in foreign currencies, precious metals like gold, Special Drawing Rights (SDRs) from the International Monetary Fund (IMF), and other reserve assets. These reserves are not just passive holdings; they are active instruments used for monetary policy, currency stabilization, and ensuring global payment obligations.
Key Components of Forex Reserves
Foreign Currencies – Typically held in USD, EUR, JPY, GBP, and increasingly CNY.
Gold Holdings – A traditional hedge against inflation and currency risk.
SDRs (Special Drawing Rights) – An IMF-backed reserve asset that supplements official reserves.
IMF Reserve Position – Access to IMF funding if needed.
2. Why Countries Accumulate Forex Reserves
Stability in Currency Markets
Countries need reserves to intervene in forex markets to prevent excessive volatility in their domestic currency.
Confidence for International Trade
Exporters and importers prefer dealing with countries that can guarantee payment stability.
Debt Servicing
Reserves allow governments to service foreign debt obligations without defaulting.
Buffer Against Economic Shocks
Acts as insurance against sudden capital flight, trade imbalances, or geopolitical crises.
Support for Sovereign Credit Ratings
Higher reserves improve investor confidence and reduce borrowing costs.
3. Importance of Forex Reserves in Global Trading
3.1 Stabilizing Currency Values
A currency’s exchange rate plays a central role in trade competitiveness. For example, if the Indian Rupee depreciates too rapidly, imports like oil and electronics become expensive. The Reserve Bank of India (RBI) can sell USD from its reserves to supply dollars in the forex market, stabilizing the rupee.
3.2 Controlling Inflation
Imported inflation is a major risk for countries dependent on foreign goods. By using reserves to maintain a stable currency, central banks reduce inflationary pressures, which directly impacts stock and bond markets.
3.3 Investor Confidence
High reserves attract foreign institutional investors (FIIs) because they see lower risk of capital restrictions. Conversely, low reserves signal vulnerability, causing capital flight.
3.4 Crisis Management
During the 1997 Asian Financial Crisis, countries with low reserves like Thailand suffered massive currency collapses, while nations with higher reserves recovered faster.
4. How Forex Reserves Impact Trading Across Markets
4.1 Currency Trading (Forex Markets)
Traders closely monitor reserve levels to predict central bank interventions.
A rise in reserves indicates strong capital inflows or trade surpluses, usually strengthening the currency.
A fall in reserves may mean heavy intervention to defend the domestic currency, creating volatility.
4.2 Equity Markets
Strong reserves signal economic resilience, attracting long-term investments.
For export-driven companies, reserve usage can stabilize currency swings, reducing earnings risk.
4.3 Bond Markets
Nations with healthy reserves are seen as safer borrowers.
Sovereign bond yields fall when reserves are high, lowering borrowing costs.
4.4 Commodity Trading
Forex reserves influence global demand for commodities. For example, when China builds reserves, it often buys U.S. Treasuries and commodities, boosting global demand.
Gold prices also respond directly to central bank reserve diversification strategies.
5. Case Studies: Forex Reserves and Trading Dynamics
5.1 China
Holds the world’s largest reserves (over $3 trillion).
Uses reserves to keep the yuan stable, ensuring export competitiveness.
Global traders watch China’s reserve reports to gauge trade and commodity flows.
5.2 India
As of 2025, India’s reserves are above $650 billion.
Provides a cushion against oil import costs and FII outflows.
Traders interpret rising Indian reserves as bullish for the rupee and equity markets.
5.3 Russia (Post-Sanctions)
Sanctions froze Russia’s dollar reserves in 2022.
Moscow shifted to gold and yuan, changing global reserve composition.
Traders saw sharp volatility in ruble trading due to limited access to USD reserves.
6. Forex Reserves as a Trading Indicator
For traders, reserves serve as a leading indicator of currency and capital flow trends.
Rising Reserves: Suggests export growth, capital inflows, and stable currency → bullish sentiment.
Falling Reserves: Signals interventions, capital flight, or trade deficits → bearish sentiment.
Traders often combine reserve data with:
Balance of Payments (BoP) reports
Capital account movements
Central bank policy signals
7. Risks of Over-Reliance on Reserves
While reserves are critical, there are risks:
Opportunity Cost – Funds invested in low-yield assets like U.S. Treasuries could have been used domestically.
Geopolitical Risk – Sanctions can freeze reserves held abroad.
Currency Depreciation of Reserve Assets – Holding too many USD assets can hurt if the dollar weakens.
False Security – Excessive reliance may delay structural economic reforms.
8. Future of Forex Reserves in Global Trading
Shift Toward Gold & Yuan – Central banks are diversifying away from the USD.
Digital Reserves (CBDCs) – Future reserves may include digital currencies issued by central banks.
Geopolitical Weaponization of Reserves – The Russia-Ukraine war highlighted how reserves can be frozen, making diversification essential.
AI and Data-Driven Reserve Management – Advanced analytics will improve reserve allocation strategies.
9. Lessons for Traders and Investors
Currency traders should track reserve levels as part of fundamental analysis.
Equity investors should see reserves as a buffer against volatility.
Bond traders should link reserves with sovereign credit risk.
Commodity traders should monitor how reserve diversification affects gold and oil demand.
Conclusion
Forex reserves are not just a financial cushion for governments; they are a critical trading signal that reflects a country’s economic health, ability to withstand crises, and global credibility. From stabilizing exchange rates to influencing global capital flows, reserves touch every corner of financial markets.
For traders, understanding the dynamics of reserves means being able to anticipate currency movements, equity flows, bond yields, and commodity prices with greater accuracy. In a world of heightened volatility, forex reserves remain one of the most powerful forces shaping international trade and financial stability.
SPX 6600 Target HitHello Traders, Well I expected a retrace by now but this market keeps powering higher. Well it finally hit the target many were talking about 6600 . It hit that number the other day on the ES as well. Its the 1.618 fib and the first resistance level and RSI is well overbought. Also we have a rate cut for Wednesday so a drop Monday and Tuesday before the rate cut on Wednesday powers the market and crypto higher makes sense. I don't think we are gonna get that big retrace I kind of expected yet. after we hit these targets we probably head up towards the dreaded 6666. See ya there!

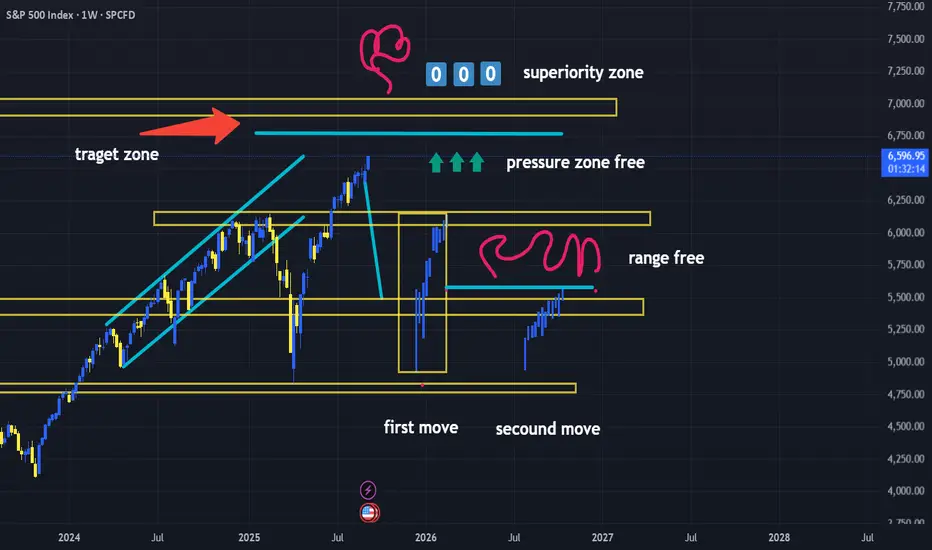
"When the move is tiring." "Moves in the tiring stage will try to have the best chance for clearing debt and freaking out the market with high prices. The first move of this stage will go with fewer candles but high movement in price by itself. The second is opposite—its strength is weak, but its effort is strong (more candles)."
Let me know if you want to expand this into a trading strategy or a visual example. It's got a poetic rhythm to it—almost like market philosophy.
........
"Superiority zone will break in the chance of wonderful news, but only for a while. There should not be any trade—market needs to absorb the new price."
.........
"Pressure zone free is no longer a trade with real money. It's a controlled move to break the new price for the sake of the news and shift into a political view."
..........
"Free range is the zone that will hold the price strongly below or above it."
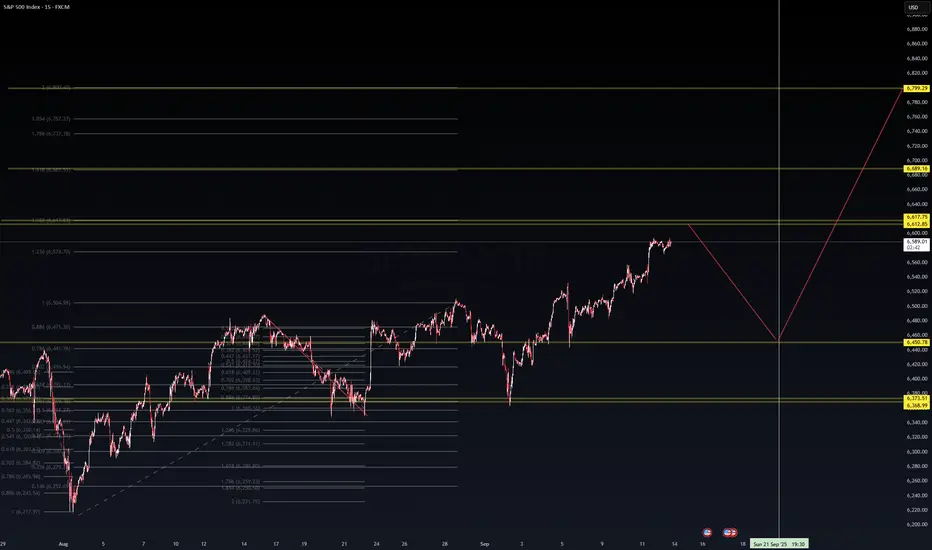
SPX500 (15m) | VolanX Protocol Analysis📊 SPX500 (15m) | VolanX Protocol Analysis
The index is pressing into the 6,617 zone, showing exhaustion at key Fib extensions.
Our VolanX model outlines two possible paths:
1️⃣ A corrective retracement toward 6,450 support before momentum rebuilds.
2️⃣ A continuation breakout, with upside targets at 6,689 and potentially 6,799.
⚖️ Bias: Neutral-to-bullish short-term, with risk of a healthy pullback before continuation.
🧠 VolanX Protocol continues monitoring momentum shifts, liquidity sweeps, and volatility clusters for adaptive trade execution.
🔗 #VolanXProtocol #WaverVanir #SPX500 #TradingAI #MarketIntelligence
US500 In strong bullish momentumFundamentals
The US500 remains supported by resilient earnings and the prospect of Federal Reserve easing, yet it faces notable vulnerabilities. While softer jobs growth and weakening leading indicators strengthen the case for upcoming rate cuts, a short term tailwind for equities, they also highlight the economy’s underlying fragility.
At the same time, elevated valuations and heavy market concentration in a handful of mega-cap leaders leave the index exposed to sharper corrections should sentiment shift.
For traders, monitoring sector rotation, earnings revisions, and macroeconomic signals will be critical to navigating opportunities while managing downside risks.
Technicals
US500 price action reveals a strong bullish trend, supported by momentum indicators and consistent uptrends, though signs of overbought conditions suggest a potential for short term pullbacks.
Key Support and Resistance Levels
Immediate Support: 6,545 is a key technical support zone; below this, 6,505 is a significant psychological and trend support zone.
Immediate Resistance: 6,630 is the nearest overhead ceiling, followed by 6,690.
Analysis by Terence Hove, Senior Financial Markets Strategist at Exness

Puts might work todayRising wedge broke bearish Timber below I would just watch and see if we roll over today and spy goes for 654-652 zone for a bounce or lower

S&P500 Historical Price Highs vs. Inflation-Adjusted Highs Nominal Price Definition (most used in history books & Wall Street research)
Inflation-Adjusted Definition (shown in your chart)
If you bought the 1929 top, you weren’t truly back to even (after inflation) until 1958.
Same with the 1968 top — real break-even wasn’t until the early ’90s.
Same with the 2000 top — real break-even was ~2016.
This method shows how devastating secular bears are if you happen to buy at the peak and hold. It makes the secular bears look even longer, because inflation erodes your gains even when the index regains its nominal high.

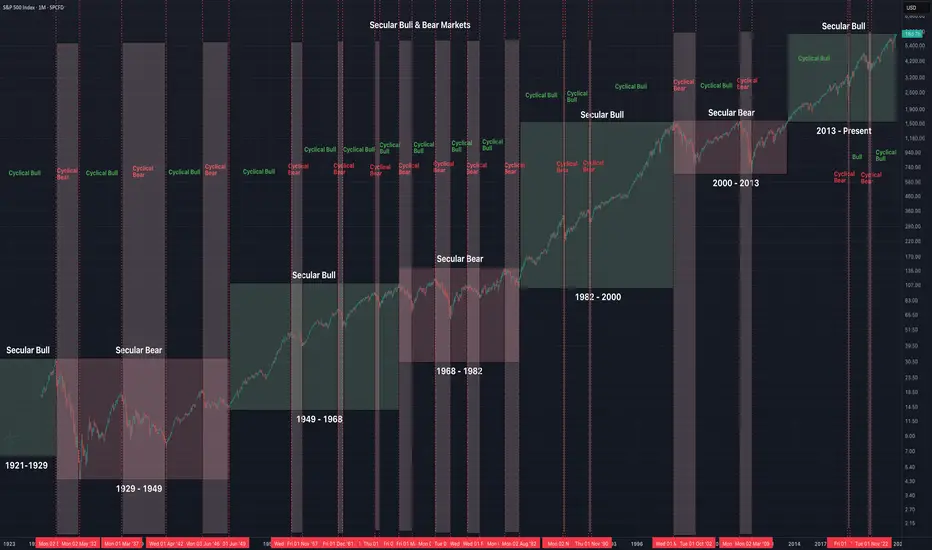
Secular & Cyclical Bull & Bear MarketsSecular vs. Cyclical Bull & Bear Markets (S&P 500, 1921–Present)
Secular Market Cycles (long-term)
Secular Bull:
1921–1929
1949–1968
1982–2000
2013–Present
Secular Bear:
1929–1949
1968–1982
2000–2013
Cyclical Market Cycles (shorter-term swings inside secular trends)
Cyclical Bears: 1929–1932, 1937–1942, 1946–1949, 1956–1957, 1961–1962, 1966, 1968–1970, 1973–1974, 1976–1978, 1980–1982, 1987, 1990, 2000–2002, 2007–2009, 2020 (COVID), 2022.
Cyclical Bulls: 1932–1937, 1942–1946, 1949–1956, 1957–1961, 1962–1966, 1966–1968, 1970–1973, 1974–1976, 1978–1980, 1982–1987, 1987–1990, 1990–2000, 2002–2007, 2009–2020, 2020–2022, 2022–Present.
Key Takeaways
Secular Bulls tend to last ~13–15 years on average, delivering powerful long-term gains with multiple smaller cyclical corrections along the way.
Secular Bears last ~13–16 years, usually defined by sideways price action with sharp rallies and deep drawdowns, leaving investors flat or negative after inflation.
Cyclical Bulls average ~4–5 years, while Cyclical Bears average ~1–2 years.
The current secular bull began in 2013 after breaking out of the 2000–2013 range.
SPX500 Holds Below 6,590 Pivot After Hitting 6,600 TargetSPX500 – Overview
The S&P 500 reached our 6,600 target following softer inflation data that reinforced Fed rate-cut expectations.
Price is now stabilizing below the 6,590 pivot, signaling the potential for a near-term pullback.
📉 Bearish scenario: While trading below 6,590, momentum favors a drop toward 6,571. A confirmed break under this level could extend the decline to 6,550 → 6,527.
📈 Bullish scenario: A 1H close above 6,590 would shift bias bullish, opening the way toward 6,604 → 6,631.
Key Levels
Pivot: 6,590
Resistance: 6,604 – 6,631
Support: 6,571 – 6,550 – 6,527
Bias: Bearish while below 6,590; bullish breakout confirmed only on a 1H close above this pivot.
