Gold 30-Min — Volume Buy & Sell Reversal Triggered⚡Base : Hanzo Trading Alpha Algorithm
The algorithm calculates volatility displacement vs liquidity recovery, identifying where probability meets imbalance.
It trades only where precision, volume, and manipulation intersect —only logic.
✈️ Technical Reasons
/ Direction — LONG / Reversal 4355 Area
Spot Gold
No trades

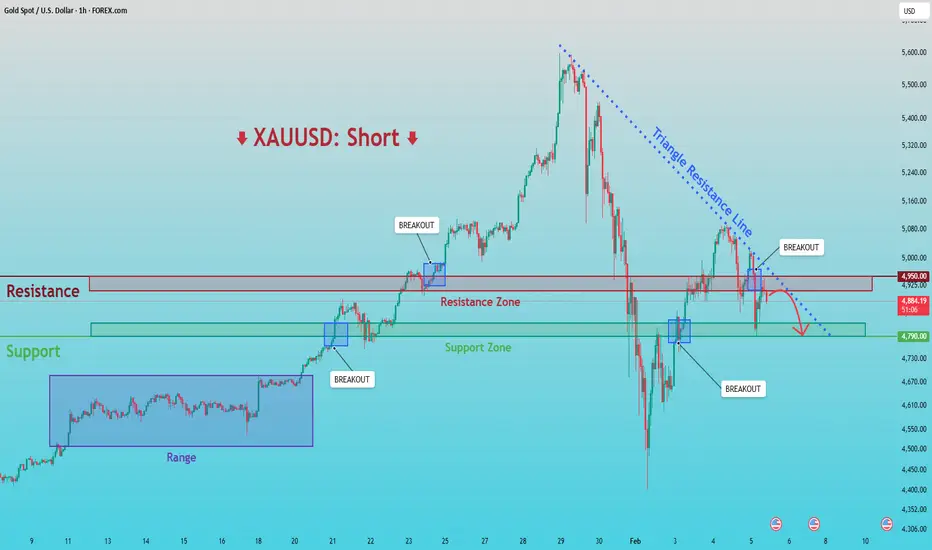
XAUUSD: Breakdown & Retest Signals Bearish ContinuationHello everyone, here is my breakdown of the current XAUUSD setup.
Market Analysis
XAUUSD previously traded within a well-defined consolidation range, where price moved sideways for an extended period, indicating balance between buyers and sellers and gradual liquidity accumulation. This range eve
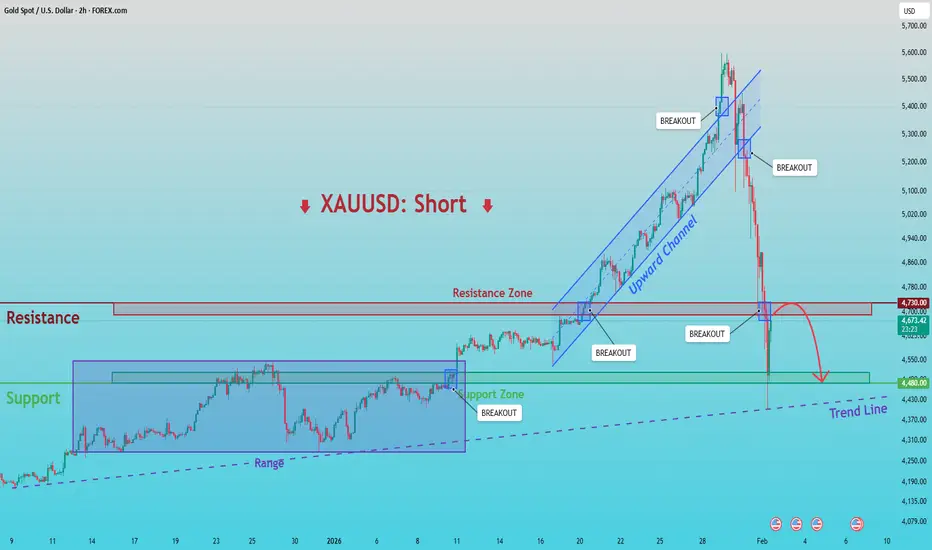
XAUUSD: Below 4,730 Resistance - Targeting 4,480 SupportHello everyone, here is my breakdown of the current XAUUSD setup.
Market Analysis
XAUUSD was previously trading within a clearly defined upward channel, where price respected both the rising support and resistance boundaries, forming a sequence of higher highs and higher lows. This structure conf
GOLD Price Update – Clean & Clear ExplanationGold is showing early signs of recovery after a strong bearish move, but the price is still trading below a major descending trendline, which remains a key resistance.
The broader structure is still bearish, as price continues to respect the downward sloping trendline from previous highs. However,

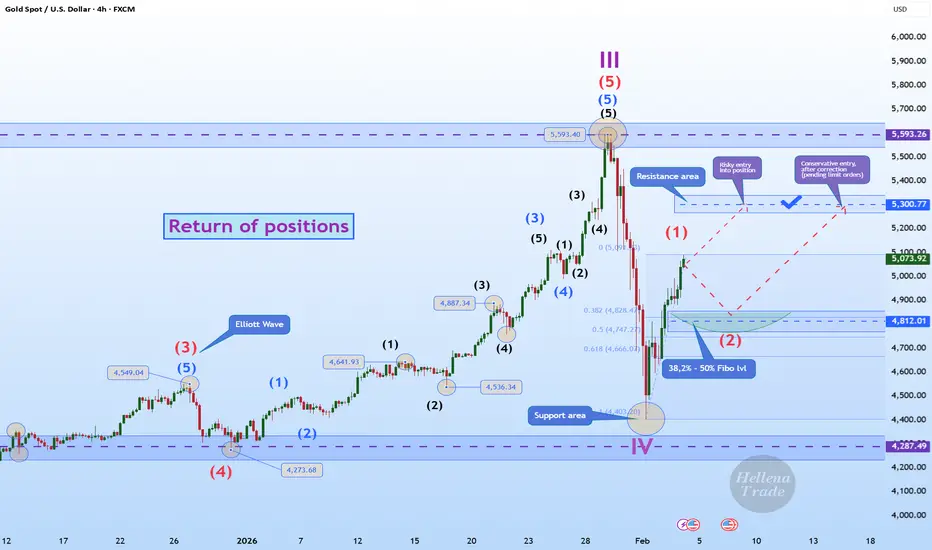
Hellena | GOLD (4H): LONG to 5300 area (Wave 3).Colleagues, the price has shown a positive upward trend, and I believe that wave “1” is either complete and wave ‘2’ correction will begin, or wave “1” will be extended.
In any case, I expect the price to reach 5300 as the nearest target. This movement after the correction will confirm the structure
Gold Tests 4400 as Bullish Scenario EmergesGold Tests 4400 as Bullish Scenario Emerges
After taking into account all the confusion created by GOLD on our previous analysis, the chances are that gold may rise from the current zone.
Gold has already tested a very strong support zone dating back to mid-October 2025. It looks like the price h

Gold Price Analysis – Key Resistance and Support LevelsThis chart outlines critical resistance and support levels for gold prices. The Key Resistance Level at 5,565.814 is a potential area for price rejection or breakout. If price approaches this level, watch for either a continuation of bullish momentum or a pause in upward movement. The Support Zone a

Gold 30-Min — Volume Buy & Sell Reversal Triggered⚡Base : Hanzo Trading Alpha Algorithm
The algorithm calculates volatility displacement vs liquidity recovery, identifying where probability meets imbalance.
It trades only where precision, volume, and manipulation intersect —only logic.
✈️ Technical Reasons
/ Direction — LONG / Reversal 4938 Area

XAU/USD ~ Gold Building Momentum from Key Support📝 Description 🔍 Setup OANDA:XAUUSD
✅Gold has been respecting a descending trendline with multiple rejections, showing clear bearish structure. Now price is attempting a breakout + retest while holding above a strong demand zone.
✅Buyers stepped in aggressively from support, forming higher lows

XAUUSDHello Traders! 👋
What are your thoughts on GOLD?
Gold printed a new all-time high before facing a sharp bearish rejection from the highlighted resistance zone. Following this strong sell-off, price dropped aggressively toward the 4400 support area, where buyers stepped in and prevented further dow

See all ideas
Displays a symbol's price movements over previous years to identify recurring trends.