Gold Stuck Near $4,100 Ahead of CPI Market Pulse:
Gold is holding steady around $4,100, caught between uncertainty and opportunity as traders brace for the US CPI release and new developments in US–China trade talks.
The yellow metal has paused its recovery from $4,050 → $4,160, while the US Dollar and bond yields edge higher amid renewed geopolitical tension and surging oil prices.
This is the classic “calm before volatility” moment — the market is simply waiting for data to decide the next wave.
If CPI comes in softer or trade talks disappoint, liquidity could flood back into gold, breaking above 4,155–4,160 and opening the path toward 4,215 → 4,261.
But a strong CPI surprise could flip sentiment fast — dragging price back into the 4,056 and 4,018 buy zones, where the next reaction will decide direction.
📊 Technical Outlook (M30)
Price continues to coil within a tight structure between 4,100 – 4,155, forming a “spring compression” right below trendline resistance.
Market flow suggests accumulation beneath 4,100, hinting that liquidity is building before the next expansion.
Key Structure Zones:
Resistance Pivot: 4,154 – 4,155 → Key breakout level
Breakout Support (CP Zone): 4,056 – 4,060
Liquidity Buy Zone: 4,018 – 4,020
Sell Zone (Fibo Reaction): 4,215 – 4,261
🎯 Trading Plan – MMFLOW Style
🔹 BUY PLAN – Reaccumulation Base
Entry: 4,056 – 4,060
Stop Loss: 4,045
Targets: 4,100 → 4,140 → 4,155
Focus on reaction candles & liquidity grab confirmation.
🔹 BUY PLAN – Liquidity Sweep Setup
Entry: 4,018 – 4,020
Stop Loss: 4,005
Targets: 4,056 → 4,100 → 4,150
If liquidity sweeps this zone clean, watch for a sharp recovery flow.
🧭 Summary – MMFLOW View
Gold is in “decision mode”, waiting for CPI and macro catalysts to trigger the next trend.
The structure stays neutral-bullish as long as price holds above 4,056.
A confirmed breakout above 4,155 may unlock a fast rally toward 4,215–4,260, while a break below 4,018 could open the door for one more liquidity flush.
⚜️ MMFLOW Bias: “No need to predict the move — just follow the flow when liquidity confirms.”
📊 Do you expect gold to break higher after CPI, or trap traders before reversing?
👉 Follow MMFLOW TRADING for daily flow-based setups, structure breakdowns, and institutional insights.
Trade ideas

GOLD Bull Market Price Target is 7 500 USD accumulate on dips🏆 Gold Market Long-Term Update 12/24 months
📊 Technical Outlook Update
🏆 Bull Market Overview
▪️2weeks/candle price chart
▪️Gold Bull market in progress
▪️1976/1979 650% gains - Bull Market 1
▪️1999/2012 650% gains - Bull Market 2
▪️2016/2027 650% gains- Bull Market 3
▪️Price Target BULLS 7500 USD
▪️650% gains off the lows
▪️will hit in 2026/2027
⭐️Recommended strategy
▪️BUY/HOLD accumulate dips
▪️BUY/HOLD physical gold
▪️BUY/HOLD GLD/GDX

Today's gold trading strategyExpectation of policy easing "stable with growth": Despite the presence of hawkish voices within the Federal Reserve, core officials have expressed clear signals of easing measures - the President of the St. Louis Federal Reserve, Musalem, explicitly stated that if there are further risks in the labor market, he might support another rate cut. More importantly, the probability of a rate cut at the October 28-29 interest rate meeting remains above 90% in the market. This policy expectation provides a solid support for gold. As an interest rate-sensitive asset, gold's attractiveness will continue to rise in an environment where the easing expectation is clear.
Today's gold trading strategy
xauusd @buy4060-4080
TP:4110-4130-4200
SL:4040

Gold price tries to recover back to 4200⭐️GOLDEN INFORMATION:
Gold (XAU/USD) drops below $4,100 in Wednesday’s Asian session, extending its sharpest selloff in over a decade as traders lock in profits after a nine-week record-breaking rally. Easing US-China trade tensions ahead of the November 1 tariff deadline further dampen safe-haven demand.
⭐️Personal comments NOVA:
Gold price is accumulating, trying to recover back to 4163, 4200
⭐️SET UP GOLD PRICE:
🔥SELL GOLD zone: 4163 - 4165 SL 4170
TP1: $4150
TP2: $4135
TP3: $4120
🔥BUY GOLD zone: 4003 - 4001 SL 3996
TP1: $4020
TP2: $4035
TP3: $4050
⭐️Technical analysis:
Based on technical indicators EMA 34, EMA89 and support resistance areas to set up a reasonable SELL order.
⭐️NOTE:
Note: Nova wishes traders to manage their capital well
- take the number of lots that match your capital
- Takeprofit equal to 4-6% of capital account
- Stoplose equal to 2-3% of capital account

XAU/USD (GOLD) Inverse Head & Shoulder Pattern Bullish Analysis📈 #XAUUSD (Gold) Technical Update 💰✨
Bullish momentum building on the 1H timeframe with an Inverse Head & Shoulders breakout above the 4115 neckline! 🚀
🎯Breakout Level: 4115
💪Pattern: Inverse H&S — bullish continuation
Technical Targets:
TP1, 4156
TP2, 4202
TP3, 4375
As long as price holds above 4115, bias remains bullish 🟢
Keep an eye on volume confirmation and potential retest zones before the next leg up! 🔍
#Gold #XAUUSD #Forex #TechnicalAnalysis #PriceAction #Trading

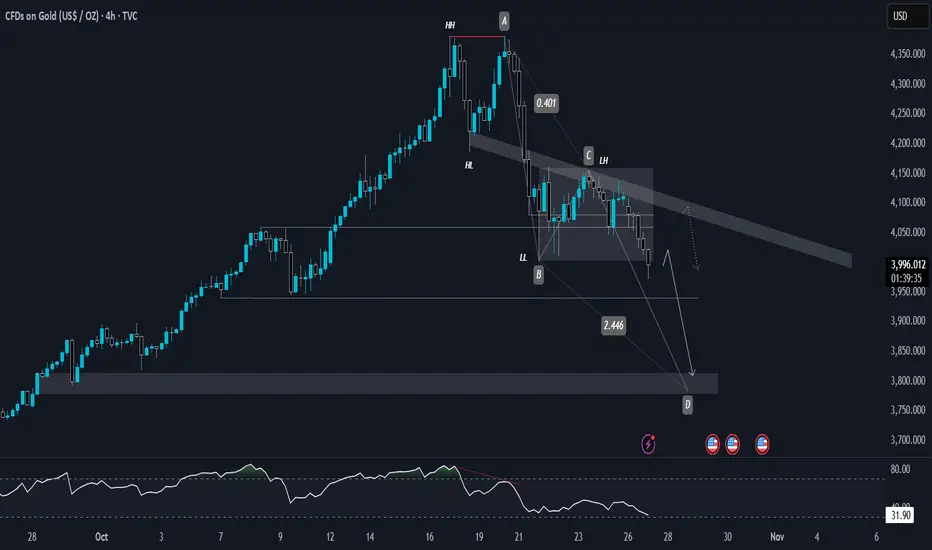
GOLD 4H | Harmonic AB=CD Bearish Reversal in PlayGold recently formed a clear double top at the all-time high (ATH), accompanied by a bearish divergence on higher timeframes — signaling exhaustion of bullish momentum. That divergence has played out perfectly, aligning with the current bearish market structure.
The price has now broken below the key accumulation range between 4000 and 4149, confirming a shift in sentiment. With the trend consistently printing lower lows (LL) and lower highs (LH), the overall market bias remains bearish.
🔹 Technical Breakdown
We currently have a bearish AB=CD pattern completing near the 3800 zone, which aligns with the Fibonacci golden ratio (0.618) on the D leg.
Although AB=CD is traditionally a bullish harmonic pattern, here it’s being used within a downtrend context to identify a potential reversal or continuation zone — depending on market reaction at D.
Key Zone to Watch:
🟡 3800 – 3840 → Major potential reaction zone (Fib confluence + AB=CD completion).
If sellers hold this level, we could see further downside momentum.
🔹 Daily Chart View
On the daily timeframe, bullish momentum looks weak — every recovery candle is smaller, and volume favors sellers. With the AB=CD pattern confirmation and price failing to reclaim the 40050 zone, the bias stays bearish.
🔹 Weekly Chart Insight
Historically, gold tends to retrace after 9 consecutive straight bullish weekly candles.
From 1990 to 2025, each 9-week rally phase has been followed by a notable correction ranging from 6% to 14%, showing that extended rallies often precede profit-taking phases.
This current rally phase mirrors that same behavior patterns — making a corrective move toward 3800–3700 highly probability.
🧭 Final BIAS
The technical confluence between the bearish structure, double top + divergence, and AB=CD D-leg near golden ratio and 9 week rally gives a high-probability bearish setup.
If 3940 fails to hold, next potential downside target lies near 3900-3775, aligned with long-term structure support.
GOLD → Fundamental background boosts interest FX:XAUUSD is recovering after a correction, trading in the range of 4060-4120 amid geopolitical tensions and risks of an escalating trade war.
Key supporting factors: New threats from the US against China, which is responding with additional measures. Trump imposed sanctions against Russian oil companies, accusing Moscow of lack of progress on Ukraine. US inflation data (CPI) on Friday may cause volatility, although the Fed's rate cut next week is likely already priced in.
The meeting between Trump and Xi Jinping next week remains uncertain.
Gold remains a safe haven, but near-term dynamics depend on the balance between dollar strength and geopolitical risks.
Resistance levels: 4116, 4163, 4200
Support levels: 4082, 4060, 4002
A retest of support at 4082-4060, as well as a breakout of resistance at 4116, could trigger a bullish reaction—a rise to the resistance level or imbalance zones. Against the backdrop of the escalating trade war, gold is becoming attractive again.
Best regards, R. Linda!

GOLD RETRACE + CONTINUATIONAfter 60D 32% run for all time highs, price changed character on D/4H strucutre, but Weekly has still valid Bullish Strucutre. After strong push to 32%, I assume, that price will pullback to PDA or consolidate towards PDA.
Confluences:
Gold is safe heaven and Ukraine war and another fundamental factors are with us...
US lockdown fears people and disbelieve for currency rises.
Latest COT data are bullish.
There are Daily and Weekly demands where price can retrace to.
If you want, let's talk about it

Gold Intraday Trading Plan 10/24/2025Yesterday gold indeed dropped initially to 4065 and rose up to 4155. However, in daily the pump is not strong enough and the close is still under EMA. Also in 12H TF, price is rejected from 38.2% retracement. Therefore, yesterday's rise is considered as retracement to me and the mid-term bearish trend should continue for today.
I am selling at current price. 1st target 4000. If broken, it should open way to 3950.

Bearish Pennant Chart Pattern Breakout TargetsDear traders,
The long awaited pullback has finally arrived. But it is to be traded with caution. As the market leaves traders with questions if the trend has changed short term or it's just another pullback to gather liquidity.
The bullish price action we saw on Gold gives a clear answer to this question. Carefully looking at the charts we can observe that gold maintained a faithful and upright uptrend: As it never broke a higher low. And now it has and it is not pushing back up, which is usually, hereby a declaration of the arrivals of the merciless bears.
My prediction of the price movement is simply a result of my experience of the market movement.
Also, an advise for all. if you want to short in the triangle, ensure to use the Supply zones or Bearish Order Blocks as other PD arrays are being ignored, this is visible in the current price action.
Have a fruitful week and don't forget to protect your capital guys!

Gold’s $4000 Rebound🟡 Gold’s $4000 Rebound
After touching the $4000 support zone, gold has started moving upward toward $4150.
According to the TSD (Trend Strength Detector) indicator, the bearish momentum is weakening, suggesting a potential shift or consolidation phase.
As mentioned in the previous analysis, $4000 remains a strong technical level — both as psychological and structural support.
If buyers maintain control, we could see another attempt toward the $4200–$4250 area in the coming sessions.
💡 This post is for educational purposes only and not financial advice.
#Gold #XAUUSD #TradingView #TSD #TechnicalAnalysis #RMBS #TrendAnalysis

XAUUSD: 800 Pips Secured, but Is the Correction Really Over?Yesterday, after revisiting the 4,000 support zone as expected and explained in my previous analysis, Gold bounced strongly and tested the area above 4,100.
That rally delivered around 800 pips profit on my long trade, and now the market is showing a mild pullback, consolidating around 4,085.
The key question now:
👉 Is the overall correction over, or is there still more to unfold?
From a technical perspective, as long as 4,000 remains intact, Gold retains its bullish potential toward the 4,200 resistance zone.
However, I prefer to stay patient at the moment — being flat at the time of writing — and will wait for a potential dip toward 4,050 or slightly below.
If the price shows a positive reaction in that area, I’ll consider re-entering long positions.
🎯 Upside targets:
• First: 4,150
• Second: 4,200
Keeping a positive risk-reward balance remains the main priority.
🚀 Let’s see if the market confirms the plan.

Is the Yellow Metal Ready to BUST Out?Hold onto your hats, traders!
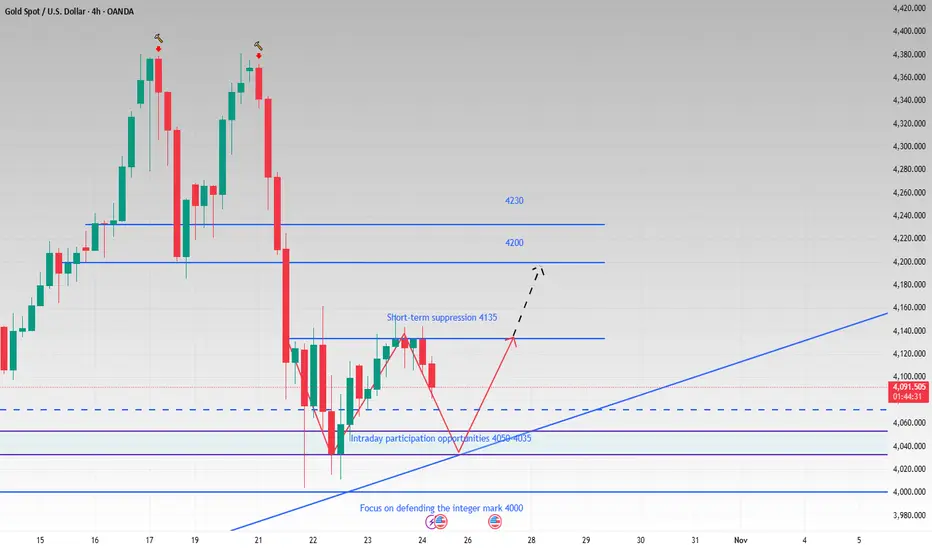
It's been a very wild ride in the FX_IDC:XAUUSD market, proving that what goes up (to a Double Top 🏔️🏔️) must come down (with a vengeance!). After a decisive rejection at the $4381 peak, Gold took a spectacular 8.64% dive last Tuesday, landing sharply at the $4002 low 📉. Talk about a waterfall! 🌊
But don't count the bulls out yet! Gold showed some backbone, bouncing 3.97% back up to $4161 before settling into a cage match. It's now consolidating in a classic Triangle pattern (a.k.a. Compression) 📐, ranging from the $4002 floor up to the stronger resistance near $4135.
The Great Consolidation: Triangle Tension 😮💨
The key takeaway? That $4000 psychological support is a BEAST. 💪 It survived test after test during the Asia, EU, and US sessions last Tuesday and Wednesday! This resilience allowed Gold to build support: first at the $4065 level (the Fib 0.382) and then down to the $4043 low, followed by rock-solid support near the $4000 zone.
As Friday closed out the week, Gold was still testing the lower $4100 area, pulling back to $4096. So, what’s next for the shiny metal?
That $33 candle Friday, was a direct reaction to the release of the slightly softer-than-expected US September Consumer Price Index (CPI) inflation data.
My Outlook: Patience is Gold, But the FED is Key 🔑
While some market watchers are singing a bearish tune 🐻, I see this as a healthy consolidation phase. Gold has already corrected 50% from its massive move (from $3631 low to the $4381 high). While a deeper correction to the 0.618 Fib at $3918 is possible, I don't see the catalyst right now to push it that far.
My bet? Gold will continue to consolidate in $4050 - $4150 range until the major announcement from the FED 🏦. The sharp reversal from the Double Top might just be the clean-out needed to launch prices higher once the rate cut announcement (or even just the dovish talk of future cuts) takes place! The last inflation data was a mixed bag, which gives the FED room to sound reassuringly dovish.
The FED Announcement is the main event this week. Mark your calendars! 🗓️
🔥 Key Economic Events: Central Bank Super Week! 🔥
This week is absolutely jammed with market-moving events across the globe. Get ready for volatility! 🌪️
Monday, October 27, 2025
8:30 AM ET: USD 🇺🇸 Durable Goods Orders (MoM) (Sep)
10:00 AM ET: USD 🇺🇸 New Home Sales (Sep)
Tuesday, October 28, 2025
10:00 AM ET: USD CB Consumer Confidence (Oct)
Wednesday, October 29, 2025 (The Fed Day) 🏦
All Day: HKD Holiday - Chung Yeung Day
9:45 AM ET: CAD BoC Interest Rate Decision
10:30 AM ET: USD Crude Oil Inventories
2:00 PM ET: USD Fed Interest Rate Decision
2:30 PM ET: USD FOMC Press Conference
10:00 PM ET (Approx.): JPY BoJ Interest Rate Decision
Thursday, October 30, 2025 (ECB and GDP Day)
2:00 AM ET: EUR German GDP (QoQ) (Q3)
4:00 AM ET: EUR German CPI (MoM) (Oct)
8:15 AM ET: EUR Deposit Facility Rate (Oct)
8:15 AM ET: EUR ECB Interest Rate Decision (Oct)
8:30 AM ET: USD GDP (QoQ) (Q3)
8:45 AM ET: EUR ECB Press Conference
9:30 PM ET: CNY Manufacturing PMI (Oct)
Friday, October 31, 2025 (Inflation and Month End)
6:00 AM ET: EUR CPI (YoY) (Oct)
8:30 AM ET: USD Core PCE Price Index (MoM) (Sep)
8:30 AM ET: USD Core PCE Price Index (YoY) (Sep)
9:45 AM ET: USD Chicago PMI (Oct)
-------------------------------------------------------------------------
This is just my personal market idea and not financial advice! 📢 Trading gold and other financial instruments carries risks – only invest what you can afford to lose. Always do your own analysis, use solid risk management, and trade responsibly.
Good luck and safe trading! 🚀📊

GOLD cooling down, correction or signal of new cycle?Summary
“After three consecutive sessions of declines, gold is experiencing a short-term correction after a rally that has lasted more than two months. Despite falling nearly 6% from its recent peak, the medium-term uptrend remains solid as prices remain above the psychological level of $4,000 per ounce. This move reflects a technical cooling of an overbought market, rather than a fundamental reversal.
With the Fed expected to cut interest rates before the end of the year, geopolitical tensions lingering and the trend of “de-dollarization” spreading, gold continues to play a central role in the global safe-haven portfolio. Investors are now closely watching the price reaction around the $4,000 region, the balance point between short-term profit-taking pressure and medium-term accumulation momentum, while the technical outlook still favors a recovery trend if this support level holds.”
OANDA:XAUUSD corrects after 3-day decline, medium-term uptrend remains strong
Gold has fallen for three consecutive days, marking a technical correction after a long rally. Spot gold was hovering around $4,080/ounce on Tuesday morning, nearly 6% below its recent peak, reflecting a necessary pullback in an overbought market.
The decline comes amid global markets being cautious about the latest developments in US-China trade talks and unclear signals on the Federal Reserve’s interest rate path. Despite short-term pressure, gold remains a central part of the safe-haven portfolio, especially as geopolitical risks increase and major currencies face “soft devaluation” pressure.
Comment: “After a period of excessive growth, gold is correcting like an overstretched spring. The fact that the price is still holding above the $4,000 mark shows that this is a technical cooling process, not a fundamental reversal. The need for safe haven and defensive trades in the Dollar still exists.”
Gold has risen more than 55% year-to-date since mid-August, boosted by expectations of at least a 25 basis point cut by the Fed before the end of the year, along with a trend to hedge against inflation and widening budget deficits. The stability of the US dollar and ETF inflows supported gold prices, while silver and platinum recorded consecutive losses due to profit-taking pressure.
Traders are also focusing on new political-trade signals. US President Trump expressed optimism about a “good deal” at the upcoming meeting with Asian leaders, but admitted that a delay scenario is still possible. This situation has made the market sentiment “cautious but realistically optimistic,”.
The current decline reflects a technical correction, not a trend reversal. With the Fed likely to cut interest rates, persistent geopolitical tensions and the “de-dollarization” trend of some economies, gold remains a pillar in the global safe-haven structure. Investors should monitor the price reaction around the $4,000 mark, the balance point between short-term profit-taking and medium-term accumulation.
Technical outlook analysis of OANDA:XAUUSD
Gold Technical Outlook: Bulls Keep the Initiated Around $4,000
Gold prices are experiencing a short-term but strong correction, after a long rally since mid-August. On the daily chart, the decline has brought the price to test the important support cluster around $4,000–$4,050/oz, corresponding to the Fibonacci 0.618 zone and the MA50 average, which acts as a key “psychological milestone” for the bulls.
The RSI has retreated to near the neutral level of 50, reflecting a temporary cooling rather than a trend reversal. The major trend structure remains clearly bullish, as evidenced by the intact upward price channel.
If the $4,000 zone is maintained, gold is likely to enter an accumulation-recovery phase, with the nearest resistance zones at $4,160–$4,180 (Fibo 0.5) and $4,210–$4,275 (Fibo 0.382–0.236). Conversely, a loss of the $4,000 mark would trigger deeper profit-taking towards the extended support zone of $3,950.
The current correction suggests the market is consolidating its medium-term uptrend, with no signs of breaking the trend. Once sentiment stabilizes around the $4,000 threshold, new buying pressure is likely to return, especially if there are supportive signals from US economic data or expectations of a Fed rate cut.
SELL XAUUSD PRICE 4231 - 4229⚡️
↠↠ Stop Loss 4235
→Take Profit 1 4223
↨
→Take Profit 2 4217
BUY XAUUSD PRICE 4001 - 4003⚡️
↠↠ Stop Loss 3997
→Take Profit 1 4009
↨
→Take Profit 2 4015
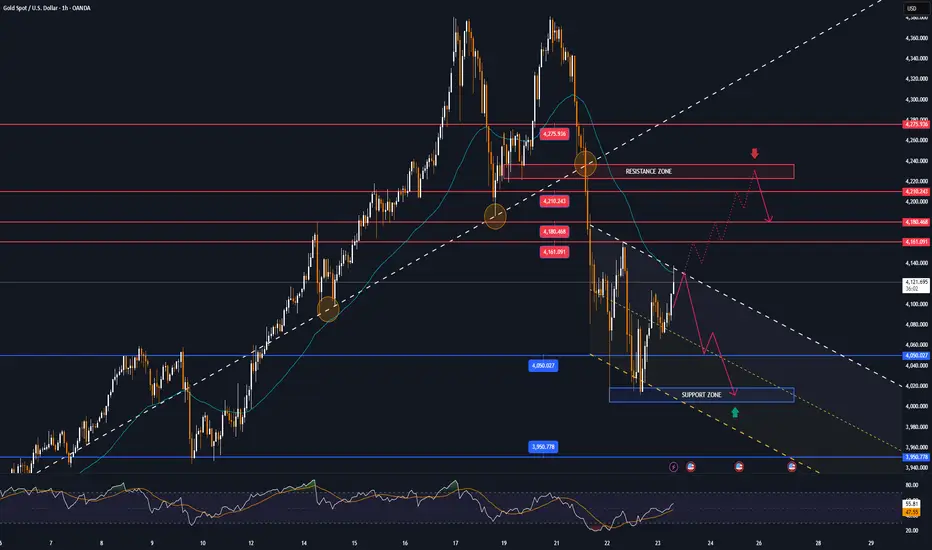
Gold - Possible intermediate topAfter the multi week rally we are heading into the DCL.
The first stop during this drop will be the tag of the 200 EMA on the hourly at 4129$.
Daily chart will be posted after after the close.

Gold Trade Set Up Oct 27 2025Gold has broke structure to the downside once again on the 1h so i am expecting a continuation back down but first i want to see a sweep of EQH and tap into 1h FVG before looking for internal 5m structure to sell down to SSL

4H see W shape. Support is not broken and it is still bullish.Although gold has experienced a temporary pullback today, we remain bullish as long as the price remains above the upward trend line. While the hourly chart shows a downward trend, with moving averages diverging downward and technical indicators like the MACD forming a death cross, it appears that bears have regained control of the market in the short term.
But from the 4H perspective, if the short-term decline continues and it can effectively rebound after touching the trend line and move out of the W-shaped structure, then gold will be expected to hit the 4135-4145 pressure again, and then gradually hit the 4160, 4200 and other periodic resistance levels until the bulls return. As time goes by, the support points on the short-term trend line are constantly moving up. If it falls back to 4050-4035, try to go long on gold in batches with light positions, and the target is 4090-4130.
OANDA:XAUUSD
XAUUSD Trading forex based on strong fundamentals is beneficial because it allows investors to make informed decisions grounded in real economic data rather than speculation. By analyzing key indicators like interest rates, inflation, GDP growth, employment, and geopolitical stability, a trader can anticipate currency movements driven by macroeconomic forces. This approach helps identify long-term trends and reduces emotional or impulsive trading, offering more consistent and sustainable profits. In essence, good fundamentals turn forex trading from a gamble into a strategic investment rooted in economic reality.

Gold price analysis on March 24XAUUSD – Bears Still in Control
Gold is trading sideways around the key resistance zone of 4145, indicating a strong struggle between buyers and sellers. However, the price has been repeatedly rejected at this zone, indicating that the bearish pressure is still dominant.
If the current trend is maintained, the support zone of 3946 will be the next potential target for the sellers. Only when the price clearly breaks above 4145, the current bearish structure can be broken and the new buying trend is confirmed.
📊 Trading Strategy:
SELL now at 4110
Target: 4022 – 3946
BUY setup: When the price breaks decisively above 4145

Gold Breakdown Alert! Bears Aiming $3980 NextGold is currently showing a descending triangle / bearish channel pattern on the 15-minute chart. After testing the upper trendline resistance around 4113–4115, price has started to reject, indicating potential downward pressure.
The trendlines show clear lower highs and lower lows, confirming a short-term bearish structure. Volume is also decreasing on upward moves, suggesting weakening buying momentum.
📉 Trade Setup (Scalping / Intraday)
Signal: 🔻 SELL XAU/USD below 4105
Entry Zone: 4105 – 4110
Target 1: 4050
Target 2: 3980
Stop Loss: 4135
Risk/Reward Ratio: ~1:2
⚙️ Technical Indicators
Trendline Resistance: 4115
Support Zone: 4050 / 3980
Momentum: Bearish bias
Structure: Lower highs forming under descending resistance
💬 Analyst View
Gold may continue its short-term correction phase if it fails to hold above the 4110 resistance zone. A breakout below 4100 could trigger a fresh wave of selling pressure targeting the 4050 area initially.
If bulls reclaim 4135, this analysis becomes invalid and could shift bias to neutral.

Trading plan for XAUUSD for 10/27/2025 (short)This trading plan is :
- If the price gets below $4065 then enter short with TP = $4005 (around recent lower low).
- if the price gets below $4005 then enter short with TP = $3946 (around recent lower low).
- if the price gets below $3946 then enter short with TP = $3873 (fibonacci level).

XAUUSD – Waiting for a Breakout to Confirm the Next Bullish WaveGold remains under pressure, trading slightly below 4,100 USD/oz despite ongoing geopolitical tensions and weak global sentiment.
On the higher timeframe, the structure still respects its ascending channel, showing no signs of a deep breakdown yet.
During the early Asian session, renewed buying interest has started to emerge, supported by a stable inflow of safe-haven demand.
Technically, price is attempting to form a bullish continuation structure (Dow wave) around the 4,110 zone.
If a breakout above this key level occurs, gold could accelerate toward 4,155, and potentially extend into a corrective bullish wave targeting 4,220–4,260, aligning with the Fibonacci retracement confluence and the CP/OBS sell zone on the chart.
Technical Outlook (M30):
Price action suggests a potential wave recovery structure forming after last week’s steep decline.
The 4,155 level acts as a key inflection point — it will decide whether bulls regain control or bears push for another correction.
Key Levels:
CP Zone Up / Breakout Base: 4,053 – 4,055
Short-Term Key Level: 4,110 – 4,115
Mid-Level Resistance: 4,155 (structure pivot)
Fibo Sell Zone / Wave End Target: 4,220 – 4,263
Trading Plan:
🔹 BUY Setup #1
Entry: 4,020 – 4,018
Stop Loss: 4,010
Take Profit: 4,030 → 4,035 → 4,040 → 4,050 → 4,060 → 4,100
Bias: Reaccumulation Phase (structure support)
🔹 BUY Setup #2 (Scalp Play)
Entry: 4,053 – 4,051
Stop Loss: 4,043
Take Profit: 4,060 → 4,070 → 4,080 → 4,090 → 4,100 → 4,150
Note: Ideal for intraday traders watching the breakout base.
🔹 SELL Setup (Liquidity Reaction Zone)
Entry: 4,263 – 4,265
Stop Loss: 4,273
Take Profit: 4,255 → 4,250 → 4,240 → 4,230 → 4,220 → 4,210 → 4,200
Summary:
Gold continues to consolidate above 4,050, showing signs of early recovery after the recent 3,000-pip correction.
The 4,155 level remains the key pivot for short-term direction — a breakout here could confirm a Wave 3–5 recovery structure, while rejection could bring one more pullback.
Macro and geopolitical uncertainty still favour safe-haven flows, keeping the bullish scenario valid as long as 4,000–4,020 holds.
📊 What’s your take — will gold break above 4,155 to start a new bullish wave, or reject and extend the correction further?
👉 Follow MMFLOW TRADING for institutional-style updates and daily structure-based setups.

XAUUSD next week (October 27, 2025 - October 31, 2025)After yesterday's CPI news on 24/10/2025, we saw interest rates unfavorable for the USD. This makes gold continue its upward trend in the coming time. Targets are 4380-4475 respectively.
