XAUUSD possible scenarios trade accordinglyI have shown possible movement that can trigger next week … I personally feel it can go 4200 and then fall below 4000 , let us see how it plays out
Trade ideas

Gold at Crossroads: Supply Pressure vs Demand Rejection1. Market Structure
Overall, gold is currently in a corrective phase following a strong bullish rally. The latest move formed a Higher High (HH) around 4,350–4,360, followed by a sharp rejection — signaling that supply pressure has started to take control.
2. Supply Zone & SELL Potential
Strong Supply Zone (4,336–4,350): This is a key resistance area where price previously faced heavy rejection. If price retests this level, it could provide a potential SELL setup, especially if a clear reversal candle such as a bearish engulfing or shooting star appears.
However, if this zone is broken with a solid bullish candle, the market could likely print a new All-Time High (ATH) in line with the medium-term bullish momentum.
3. Golden Ratio Supply Area (around 4,246–4,264)
This area acts as both a Take Profit zone for prior long positions and a directional confirmation zone. A failure to break above could trigger another rejection and deeper pullback, strengthening short-term bearish pressure.
4. Secondary Reaction Area (around 4,150)
This zone has been tested three times, confirming a strong short-term supply presence.
Plan: wait for a strong bullish breakout candle above this area to validate a continuation move. If another rejection forms, price could head back toward the Demand Area (4,065–4,043).
5. Demand Area (4,065–4,043)
A key level for potential BUY setups. Look for a clear bullish reversal candle before entering. If this zone holds, the market could rebound higher.
But if it breaks down, price may extend lower toward the Major Demand zone (3,974–3,986).
6. Major Demand (3,974–3,986)
A strong base zone capable of halting further downside movement. Suitable for swing BUY setups with a favorable risk-reward ratio, as long as price stays above this level.
Trading Plan Summary
BUY PLAN:
Wait for bullish confirmation near Demand Area (4,065–4,043) or Major Demand (3,974–3,986).
First targets: Secondary Reaction Area (4,150) and Golden Ratio Supply (4,246).
SELL PLAN:
Wait for clear rejection or reversal candle near Golden Ratio Supply (4,246) or Strong Supply (4,336–4,350).
Target: Demand Area (4,065–4,043).
Conclusion
Gold is currently in a neutral strategic zone, squeezed between strong supply and solid demand. The next directional move will largely depend on how price reacts around the Secondary Reaction Area and Demand Area.
The key principle: don’t predict—react to confirmation.

GOLD ANYLSISStop-loss: 4050
Target: 4250
(Assuming entry around 4100)
That means you’re risking about 50 points to potentially make 150 points — a 3:1 risk–reward ratio.
That’s a solid setup — you’d be earning three times what you risk if the trade hits target.

gold next week still downtrend target $3950🧭 Current Market Context (XAUUSD around 4111):
Price is below EMA 9 and failed to break above 4200–4250.
The structure shows lower highs → bearish continuation still dominant.
Momentum is weak, and buying pressure hasn’t confirmed reversal yet.
📉 Primary Plan (Bearish Bias – More Likely)
Entry: Wait for a 4H close below 4070–4050. Enter short/sell once confirmed.
Targets:
TP1 = 3950
TP2 = 3600
TP3 = 3500
TP4 (long-term) = 3100
Stop Loss:
Above 4250 (or above last swing high).
✅ Reason:
Trend still bearish.
EMA and structure show resistance above price.
Strong downside targets available.
✅ Reason: That breakout would invalidate bearish structure and shift momentum up.
⚠️ Key Tips
Don’t trade inside 4050–4250 (range zone, no clear direction).
Follow 4H or Daily candle confirmations — avoid early entries.
Risk only 1–2% of account per trade.
If shorting, take partial profit near 3600 and trail stops.

GOLD - DCL TargetsAfter today's monster drop I would like to set some targets for profit taking.
I'm short from 4236$ in this idea:
The first target was the 200 EMA at 4129$. If you are happy with the 120$ drop in 2 days you just take profits and find the next trade.
If you want a bit more you can wait for the DCL.
I think we still have 140-150$ minimum more to drop as the DCL is forming at or below the Fibonacci 38.2 level. So minimum 3974 will be tagged at the DCL. The Fibonacci 50.0 is also not off of the table at 3848$.
These kind of DCLs usually last for 5-6 days , so you can wait till next Tuesday or Wednesday before you close the short position. Don't forget 29th October FOMC, so I suggest to close Wednesday the latest . FOMC meetings can cause lots of volatility in the gold market...
I'm also watching the 6 RSI and the Slow Stochastic to get oversold.
These are the main parameters for me to take profit:
I will not hold the position during the Wednesday FOMC meeting, if we tag 3848$ before next Wednesday I will close immediately. Otherwise I wait for the RSi 6 and SlowSToch to get oversold at around 3974$.

Gold falls below 4,000, is a bearish trend starting?
News:
Signs of easing trade tensions between the United States and China boosted investor appetite for riskier assets, as evidenced by optimism in global stock markets, which became a key factor weakening demand for safe-haven precious metals.
This week is a super week, with several major central banks, including the Federal Reserve, set to announce their interest rate decisions. The Federal Reserve, in particular, is expected to cut rates by another 25 basis points early Thursday morning.
The market currently anticipates further Fed rate cuts this week and in December. As long as this expectation remains unchanged, it will continue to support markets like stocks, gold, and silver, while putting pressure on the US dollar. Conversely, if expectations are not met, the market will reverse course.
Specifically:
Judging from the 4-hour market trend, the current focus is on the short-term suppression line of 4055-4045. Gold is under pressure and difficult to break through. The 4000 mark has been broken, and a short-term bearish pattern has been opened. The operation is mainly based on rebound shorting. For the middle position, watch more and do less, be cautious in chasing orders, and wait patiently for key points to enter the market. I will provide detailed operation strategies in the channel, so please pay attention to them in time.
Trading strategy:
Buy: 4025-4035, SL: 4050, TP: 3965-3945

XAUUSD Buy SetupHey Guyx,
Lets dive in with good RR again. If this works then we'll get good profit.


GOLD Daily Plan (Oct 20, 2025) | Buy Setup from 4235–4225 Target🧭 DAILY TRADING PLAN – GOLD (XAU/USD)
Date: Oct 20, 2025
Main timeframe: M30 – H1
Strategy: SMC + Volume Profile + Fibo retracement
1. MARKET CONTEXT
After a sharp drop from 4370 → 4200, price formed a temporary bottom around 4179 and started building a corrective structure.
Currently, price is consolidating between 4240–4260, located near the Value Area Low of the previous session.
On the Volume Profile, the POC (Point of Control) from the prior session is around 4296, aligning with the Fibonacci 0.618 level — this is a major resistance zone and a good target area or reversal point.
2. MAIN SCENARIO (BUY SETUP)
Reason for entry:
Price is reacting from a small demand zone (4235–4225) with increasing volume, showing signs of absorption from buyers.
Trade plan:
Entry: 4235 – 4225
Stop Loss: 4218 (≈6–7 points)
Take Profit 1: 4288
Take Profit 2: 4296 (POC + Fibo 0.618 confluence)
Take Profit 3: 4316 (first supply zone on Chart 1)
Risk-to-Reward Ratio: around 1:2.5 to 1:3
3. ALTERNATIVE SCENARIO (SELL SETUP)
If price fails to hold above 4220 and breaks structure to the downside:
Entry: below 4215 after confirmation (CHoCH / BOS on M15)
Stop Loss: 4222
Take Profit: 4199 → 4179 (previous low & liquidity pool)
4. SUMMARY
→ Focus on the buy setup from 4235–4225 as long as price holds above 4218.
→ Be cautious taking longs near 4296–4316 (supply zone).
→ If bearish momentum returns, switch to the short scenario targeting 4199.

XAUUSD Update === Consolidation ZoneIf we pay attention to the weekly and monthly candles, this is very interesting, because in this area we will see whether there will be a continuous correction or just a moment to go back up.
We believe it fell by 3700 pips, it was not coincidence.
We should extra carefully on this area, because a reversal / deep correction also have a potential.
And also now is a Q4 of 2025.
Have a blessing week ahead !


(XAU/USD – Gold Spot, 1-hour timeframe)...(XAU/USD – Gold Spot, 1-hour timeframe), here’s the breakdown:
Current price: Around $4,337
First target (near-term): Around $4,284
Second (main) target: Around $4,205
These target levels are marked on my chart with blue arrows labeled “Target Point.”
📉 Interpretation:
The chart suggests a bearish (downward) move — likely following a correction from the peak labeled “2.”
The Ichimoku cloud and marked arrows indicate a short-term pullback, with a stronger support zone near $4,205–4,210.

Hellena | GOLD (4H): SHORT to support area of 4040.Gold is actively rising and I believe that before the impulse ends we should see the correction that many are expecting.
As of today, I see the completion of the higher order wave “3” and the approaching start of the correction in wave “4”. It makes no sense to put any distant plans in the correction and I think that the support area of 4040 looks quite attractive.
Fundamental context
Gold continues its rally and recently broke new highs, fueled by expectations of U.S. rate cuts, global uncertainty, and safe-haven demand. Central banks are still actively increasing their gold reserves — this structural demand adds support even if price pullbacks occur.
Supply growth is modest — mining output is constrained, and recycling of gold is not enough, which limits the downward pressure on prices.
Given this backdrop, the chance of a correction rises as momentum stretches — but the underlying fundamentals remain favorable for further upside once the correction completes.
Manage your capital correctly and competently! Only enter trades based on reliable patterns!

XAU/USD Bullish Outlook - Strategic Entry & Exit Plan🟡💰 XAU/USD — “Gold Rush or Police Trap?” ⚡ Thief Strategy Playbook 🎯
Asset: XAU/USD “Gold vs U.S. Dollar”
Market Type: Crypto / Metals Cross (Swing / Day Trade)
Bias: Bullish 🟢
🔓 Thief’s Entry Game Plan (Layer Method)
This isn’t your typical sniper-entry… this is the Thief Strategy™ — a layering style method using multiple limit orders for flexible accumulation.
💎 Layer Entries:
4000.00 ✅
4025.00 ✅
4050.00 ✅
(You can increase or adjust the layers based on your risk appetite & setup.)
🛡️ Stop Loss (Thief’s SL): @3950.00
“Dear Ladies & Gentlemen (Thief OG’s) — I’m not recommending my SL; it’s just my escape route.
Trade smart, take your profits, and move at your own risk.”
🎯 Target Zone — “Police Barricade Ahead 🚨”
The 4200.00 zone acts as a strong resistance + potential trap area — heavy liquidity and overbought conditions live there.
Be wise, secure the bag 💼, and slip out before the market cops show up.
📊 Key Technical Notes
Momentum shows gold buyers reclaiming upper zones after liquidity grabs.
Higher-timeframe structure: Still bullish unless 3950.00 breaks cleanly.
RSI divergence & volume spike hint at layered re-accumulation potential.
🔗 Related Pairs to Watch & Correlations
💵 TVC:DXY — Inverse correlation; stronger dollar → gold pullback risk.
BITSTAMP:BTCUSD — Occasionally follows gold sentiment under risk-off conditions.
💹 TVC:SILVER (XAGUSD) — Often moves in tandem; can confirm metal-sector strength.
💱 FX:USDJPY — Watch for safe-haven flows; yen strength = gold demand uptick.
⚙️ Market Sentiment (London Session Focus)
📈 Bullish tone continuing through European hours.
🔍 Institutions layering bids near 4000–4050 liquidity pocket.
⏱ Short-term pullbacks expected before breakout continuation.
✨ “If you find value in my analysis, a 👍 and 🚀 boost is much appreciated — it helps me share more setups with the community!”
📜 Disclaimer:
This is a Thief-style trading strategy — just for fun & educational purposes only.
Not financial advice. Trade responsibly — steal profits, not peace. 🕶️
#XAUUSD #Gold #ThiefTrader #SwingTrade #LayerEntry #Forex #DayTrading #TechnicalAnalysis #MarketStrategy #GoldTrading #XAU #PriceAction #SmartMoney #LondonSession #TradingViewIdeas

Up again for goldHi traders,
Last week gold made a correction up and another downmove for the finish of a bigger correction wave 4 (orange). After that price consolidated.
So next week we could see the next impulsive wave up.
Let's see what price does and react.
Trade idea: Wait for a small correction down on a lower timeframe and a change in orderflow to bullish to trade longs.
This shared post is only my point of view on what could be the next move in this pair based on my technical analysis.
But I react and trade on what I see in the chart, not what I've predicted or expect.
Don't be emotional, just trade your plan!
Eduwave

GOLD 3HR LINE CHART THE BREAKOUT OF 4059-4055 TRENDLINE BY LONDON /NEWYORK SELLERS WILL BE LOOKING FOR DISCOUNT IN THE PRICE OF GOLD .
CHINA-US TENSION COOLS OFF,BUT FOMC NEXT MONETARY POLICY DECISION IS CAUSING CAUTION IN LONG POSITION FOR THE YELLOW METAL.
RATE HOLD ,RATE HIKE OR CUT ,NO ONE CAN TELL TILL THE MEETING IS OVER.
DEMAND FLOOR 3991-3984. breakout of this zone the next possible support will be 3945-3940 (zone by zone strategy).
DEMAND FLOOR 3945-3940.
GOLD LONDON /NEWYORK BUY ZONE COULD BE 3945-3940 ZONE .i see a strong double confluence where a descending trendline meets a horizontal support structure,
risk management is key,if price rally at this zone,learn to take profit and protect your capital

XAUUSD – Sharp 5% Drop as Traders Take Profit Ahead of US CPIMarket Context:
Gold (XAU/USD) slumped over 5.5% on Tuesday, marking its largest daily decline in months as traders took profits ahead of the upcoming US CPI data (October 24).
The US Dollar Index (DXY) rebounded 0.36% to 98.94, making gold more expensive for foreign buyers.
This correction also coincides with renewed optimism over potential easing of US–China trade tensions, after President Trump confirmed plans to meet Chinese leader Xi Jinping next week.
While this sharp move caught many traders off guard, it appears to be a healthy correction within a broader bullish structure, as investors remain cautious before major data and the upcoming Fed policy meeting next week.
Technical Outlook (M30):
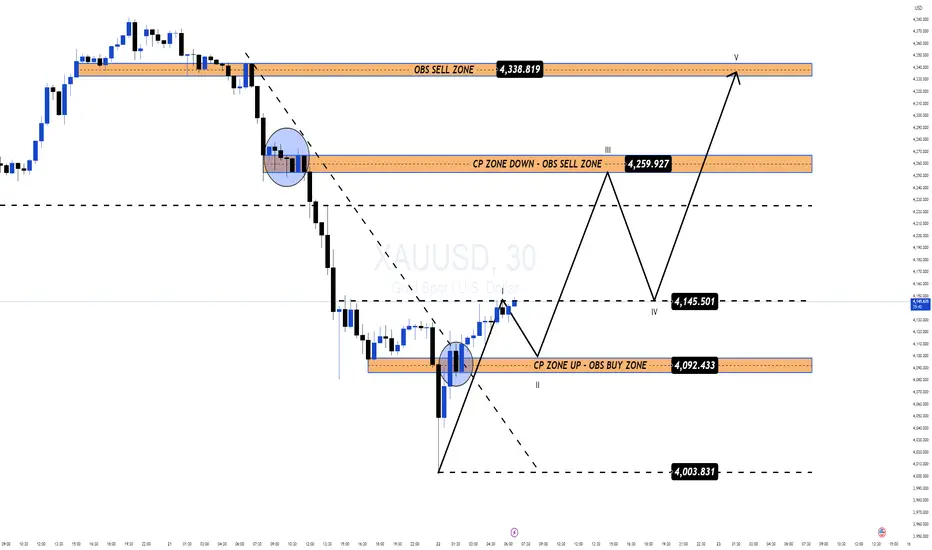
After the heavy selloff from the 4,375 high, gold found near-term support around 4,003 – 4,010, forming a potential accumulation base.
The pair now trades near 4,150, showing early signs of recovery toward key confluence zones.
Key Technical Levels:
OBS Sell Zone: 4,338 – 4,340
CP Zone Down / OBS Sell Zone: 4,259 – 4,260
CP Zone Up / OBS Buy Zone: 4,092 – 4,094
Deep Buy Zone: 4,003 – 4,008
The current structure outlines a 5-wave projection, where price may complete Wave II near 4,092, then advance toward Wave III at 4,259, followed by a correction (Wave IV) and another push toward Wave V near 4,338.
Trading Plan:
🔹 BUY ZONE#1 (Short-Term Recovery)
Entry: 4,092 – 4,094
Stop Loss: 4,080
Take Profit: 4,145 → 4,259 → 4,338
🔹 BUY ZONE #2 (Liquidity Sweep Scenario)
Entry: 4,003 – 4,008
Stop Loss: 3,990
Take Profit: 4,090 → 4,259
🔹 SELL ZONE (Countertrend Reaction)
Entry: 4,259 – 4,260
Stop Loss: 4,272
Take Profit: 4,145 → 4,092
Summary:
The recent 5% correction is viewed as a profit-taking phase ahead of CPI data, not a structural breakdown.
Gold is expected to stabilise above 4,092, with buyers likely stepping in near the OBS Buy Zone.
Focus remains on 4,259 for a short-term reaction and 4,338 as the next potential liquidity target if momentum continues.
📊 What’s your view — is this just a healthy retracement before CPI, or the start of a deeper shift?
👉 Follow MMFLOW TRADING for daily institutional-grade setups and smart money structure updates.

Gold is Targeting #5,100.80 benchmark / Medium-termGold's Short-term: Gold reached my personal maximum (regarding Short-term of course) of almost invalidating #4,400.80 benchmark / both Short and Medium-term Buyers / investors started taking Profits and as Naturally, asset cannot only Trade in one direction, Gold dipped creating aggressive Descending Channel and is now testing the Lower Low’s pressure point. However, #4,000.80 is very strong Support zone for the fractal which won't be invalidated without serious cause and even with Short-term development (due current decline) Investors drawing capital from Gold to more riskier assets - I doubt Gold has more potential to go Lower below my Support zones on the chart regarding Short-term. The current Selling accumulation pattern on Hourly 4 chart is now on total Neutrality but attempting to break towards last week’s Lower Low's. Current Fed loan climate is Gold friendly as Gold often demonstrates resilience during early phases of Fed tightening cycles before investment flows adjust to Higher Rates. If Rates go down more aggressively, Gold will soar more (another reason why I am Bullish on Gold).
#MA50 and #MA200 observation: Keep both lines on your Weekly (#1W) chart, as they are pointers for Long-term. As Long as Gold is Trading above them, Bullish Long-term stance remains and Gold will Target upper levels.
Fundamental commentary: Gold was Trading on #1,800.80 on mid-October #2023 Year, and currently tested #4,400.80 benchmark which records one of the most aggressive rises of Gold in history. It was up almost (# +65.00%) lately / when confidence in financial system is on a decline (which is the case in current and last few Years), Gold is soaring as hedge. U.S. Dollar just had one of its weakest first halves in #50 Years, down more than (# -10.00%) against other major currencies. Massive debt (# 315 trillion globally), rising government spending and tariff regulation and impact on the markets have shaken confidence in the system world-wide. When U.S. Dollar weakens, Investors are in search of asset that feels more stable to store their money / it is always one and almost only option - Gold. In addition, Central banks have been Buying Gold in bulk / over #1,000 tons annually for the past #3-Year fractal, most since #1,967 Year which is not surprise or weird / something is going on. Part of that started with Middle East conflict escalation #2,023 Year, U.S. freezing #300 million Russian reserves in #2,022 Year, showcasing other countries that their Dollars can be shut off as political leverage.
Recapitulation: Segment which makes the almost (# +65.00%) increase on Gold unusual is that both Gold and Stock markets are both hitting record Highs at the same time. Institutions are still sitting on trillions in cash. Many are still not deciding to go "all in" on Stocks at these levels. Also on the contrary, they also don't want to lose to Inflation sitting on the sidelines / so they're parking most of the money in Gold as a temporary middle ground and that demand is helping push Gold Higher from big institutions, and also independent Investors world-wide. Even with all the questions and uncertainty right now, keep this in mind: Gold is used to protect wealth, not grow it. Gold usually spikes when confidence in the financial system drops, but it can dip just as fast once confidence returns. In #1,980 Year, Gold hit a record of #850.80 per ounce then dropped (# -50.00%) by #1,982 Year. After peaking at #1,920.80 in #2,011 Year, it took nearly a decade to recover and if full confidence returns, Gold may fall fast as mention above, however confidence for financial system is far from delivered or happening.
My personal thoughts: All Traders are well aware that I am well known Seller of the market however what made me triple my account, is switching to being a Bull in recent times as Trading against the trend is disastrous for a Trader. I do believe that even if Gold dips, near Lower Low's is maximum as illustrated on my chart and #5,100.80 benchmark is my next point of interest and my next Medium to Long-term Target. #6,100.80 - #6,200.80 represents Ultimate Top's for now and stabilization zone where another aggressive dip is possible, fuel only for Gold to soar further. I do believe Financial system is about to collapse even more and with ever-growing Inflation world-wide, Gold will skyrocket and I am here to Buy it / Trade it even more than ever, expecting my Targets to be met. Remember, trend is your friend and hope all of Sellers which got liquidated accounts, sending me many messages will turn their Technicals and finally start Buying Gold. Yours, goldenBear88

Gold – 24 Hours of Chaos: From 4400 to 4000The last 24 hours in Gold trading were absolutely insane. After retesting the 4400 zone all-time high last night, XAUUSD literally collapsed, dropping straight to the 4000 zone in just one day — a 10% move that’s unheard of for gold (at least I haven't seen).
1️⃣ Technical Picture
Once the price broke back below 4200, it confirmed a double top formation, and the selloff accelerated dramatically toward its measured target around 4000 — a level also supported by the ascending trendline that started in late August.
2️⃣ Current Context
At the time of writing, gold already rebounded nearly 1300 pips from the low, which means there’s no attractive level to enter long right now, even though the recovery might continue in the short term.
3️⃣ Key Levels to Watch
• Resistance: 4200 zone – now turned into a major resistance. If the price revisits this level, I’ll be looking for short setups, ideally on intraday spikes.
• Support: 4000 zone – if the price dips again before testing resistance, it could offer long opportunities from this confluence area.
4️⃣ Trading Plan
In short, we’re in a wide range between 4000 and 4200, both levels offering potential trades but in opposite directions. For now, I’ll stay patient and wait for price to get closer to one of these extremes before taking action.
⚠️ Final Note
Volatility is off the charts, so if you decide to trade XAUUSD these days, adjust your stop losses and targets accordingly. This is not the time for tight stops, is time for patience, and flexibility. 🚀

GOLD Will Move Lower! Short!
Here is our detailed technical review for GOLD.
Time Frame: 1D
Current Trend: Bearish
Sentiment: Overbought (based on 7-period RSI)
Forecast: Bearish
The market is testing a major horizontal structure 4,076.79.
Taking into consideration the structure & trend analysis, I believe that the market will reach 3,724.27 level soon.
P.S
Please, note that an oversold/overbought condition can last for a long time, and therefore being oversold/overbought doesn't mean a price rally will come soon, or at all.
Like and subscribe and comment my ideas if you enjoy them!

New update GoldIn my opinion, if gold cannot hold the 4000 range, it will approach the head and shoulders pattern and may experience a price drop to 3700. These tariff issues between the US and China are playing an increasing role.

XAUUSD – Sharp 5% Drop as Traders Take Profit Ahead of US CPIMarket Context:
Gold (XAU/USD) slumped over 5.5% on Tuesday, marking its largest daily decline in months as traders took profits ahead of the upcoming US CPI data (October 24).
The US Dollar Index (DXY) rebounded 0.36% to 98.94, making gold more expensive for foreign buyers.
This correction also coincides with renewed optimism over potential easing of US–China trade tensions, after President Trump confirmed plans to meet Chinese leader Xi Jinping next week.
While this sharp move caught many traders off guard, it appears to be a healthy correction within a broader bullish structure, as investors remain cautious before major data and the upcoming Fed policy meeting next week.
Technical Outlook (M30):
After the heavy selloff from the 4,375 high, gold found near-term support around 4,003 – 4,010, forming a potential accumulation base.
The pair now trades near 4,150, showing early signs of recovery toward key confluence zones.
Key Technical Levels:
OBS Sell Zone: 4,338 – 4,340
CP Zone Down / OBS Sell Zone: 4,259 – 4,260
CP Zone Up / OBS Buy Zone: 4,092 – 4,094
Deep Buy Zone: 4,003 – 4,008
The current structure outlines a 5-wave projection, where price may complete Wave II near 4,092, then advance toward Wave III at 4,259, followed by a correction (Wave IV) and another push toward Wave V near 4,338.
Trading Plan:
🔹 BUY ZONE#1 (Short-Term Recovery)
Entry: 4,092 – 4,094
Stop Loss: 4,080
Take Profit: 4,145 → 4,259 → 4,338
🔹 BUY ZONE #2 (Liquidity Sweep Scenario)
Entry: 4,003 – 4,008
Stop Loss: 3,990
Take Profit: 4,090 → 4,259
🔹 SELL ZONE (Countertrend Reaction)
Entry: 4,259 – 4,260
Stop Loss: 4,272
Take Profit: 4,145 → 4,092
Summary:
The recent 5% correction is viewed as a profit-taking phase ahead of CPI data, not a structural breakdown.
Gold is expected to stabilise above 4,092, with buyers likely stepping in near the OBS Buy Zone.
Focus remains on 4,259 for a short-term reaction and 4,338 as the next potential liquidity target if momentum continues.
📊 What’s your view — is this just a healthy retracement before CPI, or the start of a deeper shift?
👉 Follow MMFLOW TRADING for daily institutional-grade setups and smart money structure updates.