XAUUSD: A strong rebound toward 4,235 looks highly likelyHey everyone, it’s Erik here.
I’m closely watching a potential reversal zone on XAUUSD, which I’ve highlighted on my chart. Based on the current market structure, I expect price to face some rejection before continuing its move upward toward the 4,235 level.
This area could be a key decision point for the market. If buyers manage to hold the support, we could see a strong rebound and a continuation of the bullish momentum. But if price breaks below this zone, it could open the door for a deeper move down as liquidity builds beneath.
Should we get a clear bullish impulse, the next area I’ll be watching is T2. From there, we might see a period of accumulation or another sharp reaction, depending on the broader market sentiment at that time.
I’m simply sharing my personal view of the chart — this isn’t financial advice. Always confirm your own setups and manage your risk with patience and discipline.
Trade ideas

GOLD Still Very Bearish , 2 Short Setups Valid To Get 500 Pips !Here is My 30 Mins Gold Chart , and here is my opinion , we are Below 3972.00 With 4H Candle And this never happened for a long time ! and we have a 4H Candle closure below it And Perfect Breakout and this give us a very good confirmation , so we have a good confirmation now to can sell after the price go back to retest the broken area 3972.00 and this will be my best place to sell to can use small stop loss , and i have another place if he price will not go up more to retest 3972.00 m we have a very good res level 3940.00 , if we have a good bearish price action when the price touch it we can sell from it and targeting 100 to 200 pips , and if the price didn`t give us a good bearish price action from it i will wait the price at 3972.00 to can sell and targeting 200 to 500 pips , if we have a daily closure above this area this mean this idea will not be valid anymore .
Reasons To Enter :
1- Perfect Breakout .
2- Clear Bearish Price Action .
3- Bigger T.F Giving Good Bearish P.A .
4- Bearish Control .
5- Perfect 4H Mins Closure .

Analysis of gold movement on the 4-hour time frameHi traders
Gold has not been able to close a candle above the equilibrium range (4114) for the 4-hour time frame for now, but it can have an upward movement to the resistance areas, pick up the rising liquidity, and then return to close a candle below the 4-hour equilibrium range (it can stabilize below 4067, in which case it will pullback to 4067 and 4090 and towards the sell).
For the resistances in question, 4171 - 4193 and 4208 - 4231 are two one-hour equilibrium resistances that the market has not yet pulled back to these numbers, and the 4-hour candle after the pullback should stabilize below these areas to confirm the continuation of the decline to low liquidity and sellers' TPs

#XAUUSD: Two Entries, Three Targets, Swing Sell! Gold dropped to 3883 region, the lowest point in the last two months. Since then, it has started rebounding. Currently, the price is approaching a very important key level, which could lead to a smooth reversal. However, market conditions will be extremely volatile, making it difficult to predict any move. This is because we have the NFP coming up. Due to this volatility, both of these entry points are equally possible.
Once either entry is confirmed, you should place a target based on your risk management and trade planning. Remember, this is not a confirmation, and the price could go in the opposite direction. Please do your own analysis before making any financial decisions.
We are here to help. If you have any questions related to this analysis or any trading matter, please drop a comment. We will do our best to help you out. If you want to support us, please like and comment on the idea.
Team Setupsfx_

GOLD → Technical analysis of the current situation FX:XAUUSD is consolidating, and the daily market behavior pattern is not particularly positive, but it does have bullish implications. Market sentiment largely depends on the fundamental background
This week, the Fed is expected to hold a meeting on interest rates, where it will most likely decide to lower them, which could generally support the dollar (but this news is most likely already priced in). Accordingly, the rest depends on decisions regarding the shutdown, trade war, and inflation. The resolution of the first two issues may weaken the price.
As for the technical side, since the price is currently within the trading range, it is worth considering trading within these limits first. However, a breakout and closing above/below one of the key levels: 4060 - 4150 could trigger further movement in the direction of the breakout, which in turn could push the price into another (bearish or bullish) trading range. Below, there is the 4000 zone, and there is a possibility of a retest of this area, with a potentially aggressive reaction.
Resistance levels: 4150, 4218, 4275
Support levels: 4060, 4015, 3944
While uncertainty remains, the market may continue to hold the price between 4060 and 4150. Another retest of the range boundary and the reaction to this retest will show the market's intentions for further movement.
Best regards, R. Linda!

Gold Outlook after the Dip. What to expect NOW?The price correction has ended, and the price is now in a strong support zone according to Fibonacci levels. From this point onward, the price is expected to rise and retest its previous high.

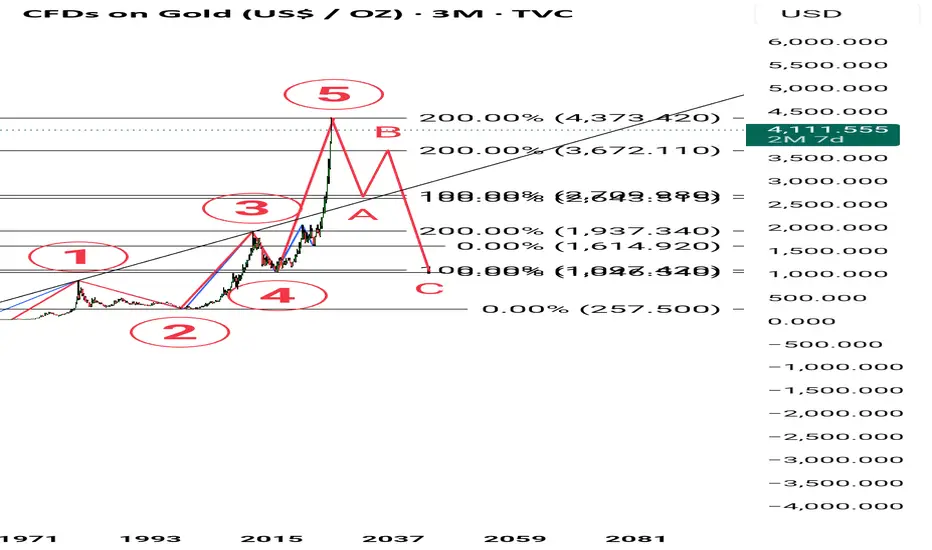
GOLDThe era of cheap gold ends
From 1919 to 2015, the price of gold due to Gold Fixing. The price was set by London Gold Market Fixing Limited. On March 20, 2015 fixing ceased to be installed according to the old methodology and was replaced by electronic auctions LBMA Gold Price.
Initially, the "golden five" consisted of the following companies
1.N M Rothschild & Sons
2.Mocatta & Goldsmid
3.Pixley & Abell
4.Samuel Montagu & Co
5.Sharps Wilkins
What now?
Thirteen market participants are accredited to participate in LBMA Gold Price trading:
Bank of China
Bank of Communications
China Construction Bank
Goldman Sachs International
HSBC Bank USA NA
ICBC Standard Bank
JPMorgan Chase
Morgan Stanley
Société Générale
Standard Chartered
The Bank of Nova Scotia - ScotiaMocatta
The Toronto Dominion Bank
UBS
These banks all belong to the same families.
Most of the gold has already been bought and there is no point in keeping it at this level.
In a period of instability, investors will seek refuge for their assets. And gold will not be a bad refuge for long term.
WE WILL BE GOLD BEFORE THE PORN, WHILE GOLDEN IDEOLOGISTS WILL EXIST . Rothschild's

4 Best Forex Gold Trading Strategies For Beginners
If you just started trading and looking for a winning strategy to trade, I prepared for you 4 simple and profitable forex trading strategies for beginners.
1. Harmonic Strategy
With that strategy, you will trade harmonic patterns.
Here is the list of the most powerful ones:
Bullish/Bearish Gartley pattern,
Bullish/Bearish Bat pattern,
Bullish/Bearish Cypher pattern.
To properly apply the Harmonic Strategy you should learn just 3 things: Fibonacci numbers, impulse legs and the rules of harmonic patterns.
That strategy is very simple: it works on any time frame and your only task is to recognize the harmonic pattern and trade it strictly following the rules .
2. Trend Following Strategy
That strategy is price action based.
To properly apply that, you should learn trend analysis rules and how to identify price action legs.
Once you spotted that the market is trading in a bullish/bearish trend, your task will be to wait for a completion of a correctional movement to buy/sell t he market expecting a trend continuation.
That strategy works on any time frame, however, my recommendation is to trade 4H time frame or higher.
3. Structure Breakout Strategy
That strategy is based on structure analysis.
To properly apply Breakout Strategy , you should learn to identify key vertical and horizontal structures: supports and resistances.
Your task will be to look for a confirmed structure violation with a candle close beyond that.
Bullish breakout of a key resistance will be a signal for you to buy, expecting a bullish movement to the next resistance, while a bearish breakout of support will push the prices lower to the next structure support.
That strategy works on any time frame, however, my recommendation is to trade 4H time frame or higher.
4. Trend Reversal Strategy
That strategy is price action based.
To use it properly, you should learn trend analysis and trend reversal rules.
Your task will be to look for a confirmed trend reversal . It will lead to an initiate of a new trade and give you a perfect opportunity to catch an extended movement.
What I like about these strategies, is that while you trade with them, you master structure and price action analysis. 2 essential components of any sophisticated professional strategy.
Master one of these strategies and then modify that with experience, adding some extra layers of analysis.
Let me know which strategy do you like the most?
❤️Please, support my work with like, thank you!❤️
I am part of Trade Nation's Influencer program and receive a monthly fee for using their TradingView charts in my analysis.

I think cycle the end This is only idea history base idea i dont know this is correct or not but this is very high rate poor person how to buy yellow metal uff heavy rate in markets this is danger for human life gold is not safe for womans snatching problums in humans life sorry for my poor language
The Ultimate GOLD & SILVER Outlook || 5 Trade Setups + FOMC UpdaWelcome to Trade with Decrypters!
📊 DETAILED & COMPLETE ANALYSIS (5 TRADE SETUPS) — Gold & Silver Outlook
1️⃣ Central Bank Buying
* Q1–Q2 2025 net: 410t (+15% YoY)
* August: +19t
* BRICS hold 6,000t (21% of global reserves)
* Top buyers: 🇵🇱 Poland +90t | 🇨🇳 China +35t
* Motive: USD hedge + BRICS 2026 currency prep
📈 Outlook: Sustained demand supports 10–15% long-term gold upside
2️⃣ ETF Inflows & Sentiment
* Q3 inflows: $26B | AUM $445B (+25% YoY)
* Holdings: 3,200t
* Asia: +37t | US: Neutral
* Gold RSI: 68 (Support: $3,800 | Resistance: $4,000)
* Silver RSI: 72 (Support: $32)
🎯 Projection: Gold → $4,000/oz (Q4, +1%) | Silver → $35/oz (+9%)
3️⃣ Macro & Geopolitical Events
* Fed cuts: 75bps → 3.75%
* USD: -8% | CPI: +3.2%
* Tariffs add +0.5% global inflation (→ 4.2%)
* BRICS trade pacts counterbalance USD weakness
* Gold already +57% YTD on 20% risk premium
📊 Outlook: Trade wars + Fed easing = 5–7% metals gain H1 2026
4️⃣ Silver Deficit
* 2025 deficit: 118M oz
* Supply: 1.02 Boz | Demand: 1.20 Boz
* Industrial share: 59% (EVs China +25%, Solar +30%)
* Recycling: 20%
📈 Projection: 150M oz deficit (2026) → Silver +15%
5️⃣ Futures & Options Flow
* CME Gold OI: 550k (+10% MoM)
* Silver OI: 180k (+8%)
* GVZ: 18%
* Call/Put ratio: 2:1 | Net long: 65k gold calls
📊 Outlook: OI rise + call bias = 20–25% vol breakout Q1 2026
🔮 Fundamentals & Forecast
* Gold: 450t CB buying + de-dollarization →
🎯 $4,200/oz (end-2025, +12%) | 🎯 $5,000 (2026)
* Silver: 118M oz deficit + 59% industrial →
🎯 $38/oz (end-2025, +18%) | 🎯 $60 (2026)
⚡ Drivers: Fed easing, 4.2% inflation, US deficit, BRICS shift → strategic metals outperformance
🏦 FOMC Update (Oct 29, 2025)
* Decision: 2:00 PM ET
* 98%+ chance of 25bps cut → 3.75–4.00%
* Powell press conference: 2:30 PM ET
* Dot plot & QT update expected
* Markets volatile → cut likely supportive for Gold, Silver, Stocks & Crypto
Disclaimer: This analysis is for educational purposes only. Not financial advice.

Gold is entering a correction phase!Gold is currently moving within a corrective phase, which appears to be developing as a WXY structure.
Price is now completing wave X, with one final minor wave C to the upside likely remaining.
The more probable scenario suggests a limited bullish move toward the 4140–4180 zone before continuing lower as part of wave Y.
Bullish trigger: 4046 (for the final leg of wave C)
Bearish alternative: A confirmed breakdown and consolidation below 3960 would invalidate the current count and shift focus to a continuation of the broader bearish move — in that case, the wave structure will be updated accordingly.

#XAUUSD(GOLD):We are still bearish, this week is decider! Gold experienced a decline during today’s Asian session before recovering sharply to the 4030 area. Currently, the price is consolidating within a narrow range between 4010 and 4030. This behaviour suggests a period of accumulation, where buyers and sellers are unable to establish a clear directional advantage. Given the anticipated volatility in the coming week, particularly with macroeconomic data releases, traders should exercise caution and implement disciplined risk management strategies.
The initial decline in the Asian session may have been driven by short-term profit-taking and liquidity searches by major market participants. However, the swift recovery to 4030 indicates strong buying interest at lower levels, suggesting that gold remains in a bullish trend on larger timeframes. This range-bound movement between 4010 and 4030 is forming a temporary consolidation zone.
A detailed examination of the 1-hour chart reveals multiple touchpoints within this range, indicating strong short-term support at 4010 and resistance near 4030. Candlestick patterns suggest indecision, with several doji and spinning-top formations, further confirming the likelihood of price manipulation and liquidity grabs throughout the week.
Like and comment for more such chart analysis!
Team Setupsfx_

Gold Extends Its Decline Below the $4,000 LevelGold Extends Its Decline Below the $4,000 Level
As the chart shows, the XAU/USD quote has fallen below $3,945 today — its lowest level since 6 October. The downward momentum is being driven by traders’ caution ahead of two key events:
→ the U.S. Federal Reserve’s upcoming interest rate decision;
→ the meeting between U.S. and Chinese leaders, which could help ease tensions between the world’s two largest economies.
Technical Analysis of the XAU/USD Chart
The ascending channel (shown in blue) illustrates gold’s remarkable rally from the 20 August low (point A):
→ throughout September, the median line acted as strong support;
→ the peak at point B coincided with the upper boundary of the channel;
→ the QH line — dividing the upper half into quarters — alternated between resistance and support.
The black lines mark the consolidation zone observed between 21 and 27 October:
→ its lower boundary aligns with the median;
→ the shape resembles a Symmetrical Triangle pattern, which has since been broken to the downside.
The chart highlights the confidence of sellers — bears managed to push prices through the key support area defined by:
→ the psychological $4,000 level;
→ the 0.382 Fibonacci retracement (indicated by the orange arrow).
The next potential target for the ongoing decline lies near the QL line, which coincides with the round-number level of $3,900. However, this may only serve as a temporary barrier before bears attempt to drive the price lower — towards the bottom boundary of the primary channel.
This article represents the opinion of the Companies operating under the FXOpen brand only. It is not to be construed as an offer, solicitation, or recommendation with respect to products and services provided by the Companies operating under the FXOpen brand, nor is it to be considered financial advice.

Gold Congestion: Clear Levels, Unclear DirectionAfter forming a local low at 3887 last week — a level perfectly aligned with the October ATH area — OANDA:XAUUSD started to recover from the recent 5k pips decline, retesting the 4050 resistance zone, which previously acted as strong support.
Since mid-last week, price action has entered a consolidation phase. Despite high intraday volatility, the structure is beginning to compress into a clear congestion pattern.
This range, roughly 1k pips wide, provides traders with well-defined reference points:
- Support: 3950–3960 zone – a break below this area would likely reopen the path toward the recent 3887 low.
- Resistance: 4040–4050 zone – a confirmed breakout above could trigger a continuation toward 4150.
At this stage, I am slightly bullish, given the sharp rejections from 3920 last week and the emerging ascending triangle structure, which often precedes upward continuation.
Still, confirmation is required — the market must decide whether this congestion is accumulation or distribution.

Gold Has Entered the Fifth Wave — A Drop Below 3800 Is PossibleGold continued its Wave-4 rebound today, but following a news catalyst, Wave-5 downward momentum began, and the market structure has become clearer. In such conditions, what traders need most is patience.
From the daily chart perspective, there still appears to be room for further downside. Based on my expectation, this decline may break below 3800. Of course, the market is always changing, and our outlook is based on probabilities — no one can guarantee the market will move exactly as expected. However, recent price action has been largely in line with our forecast, and I believe many of you have already secured profits from this move — that’s what matters.
Additionally, I will be traveling tomorrow and won’t be able to monitor the market in real time. So during your trades, please stay alert and prioritize risk control. Protect your capital first — profits will come naturally afterward. The market never lacks opportunities, so don’t sacrifice long-term stability for short-term gains.
Stay calm, stay disciplined, and trade safely!

GOLD 30MIN NEWYORK PERSPECTIVE BACKUP CHART.LONDON /NEWYORK GOLD MARKET SESSION SHOWING ME SOME STRONG BULLISH DISPOSITION but the bullish confirmation hinges on break and close 4030 line chart close of my 4hr candle chart my preferred intraday time frame for deep analysis and trade directional bias in real time
if they break 4030, i will watch 15 min chart of the 4070-4055 zone for possible sell reaction price action, like I did in the yesterday sniper buy at 3885-3890 for reference which was posted for free.
the 4HR structure is my litmus test and guide in bullish continuation or bearish take profit.
if 4030 on timing 12;00 drops then i will hope that 4003-4006 demand keeps the bullish impetus so we can ride into 4150 wave ..
the FOMC RATE AND MEETING WILL BE VOLATILE .
GOLD IS 100% BULLISH AND IN THE HANDS OF CENTRAL BANKS.
GOODLUCK
#GOLD #XAUUSD #DOLLAR #DXY #US10Y

GOLD Under Pressure! SELL!
My dear subscribers,
My technical analysis for GOLD is below:
The price is coiling around a solid key level - 4023.4
Bias - Bearish
Technical Indicators: Pivot Points High anticipates a potential price reversal.
Super trend shows a clear sell, giving a perfect indicators' convergence.
Goal - 3987.3
My Stop Loss - 4041.7
About Used Indicators:
By the very nature of the supertrend indicator, it offers firm support and resistance levels for traders to enter and exit trades. Additionally, it also provides signals for setting stop losses
Disclosure: I am part of Trade Nation's Influencer program and receive a monthly fee for using their TradingView charts in my analysis.
———————————
WISH YOU ALL LUCK

Why Is Gold Called the King of Assets?👋Hello everyone!
If you are an investor, you have probably heard the saying: “Gold is the king of assets.” But why gold? Why does gold always hold a special place in the financial markets and is considered a safe haven in all circumstances? Let’s explore why gold deserves this title and why it remains a favorite choice among millions of people around the world!
1.Gold Is the Guarantee of Safety
When the stock market plunges, when economies face crises, or when inflation erodes the value of currencies, gold is always the first choice of smart investors. While other assets can lose value quickly, gold tends to hold its worth — and can even rise. This is why gold is regarded as a “safe haven” in times of uncertainty.
Gold is not only favored by individual investors but also by governments and central banks around the world. They accumulate gold as a way to protect their nations’ economies from global financial shocks.
2.Gold: An Asset That Cannot Be Printed Like Money
There’s one thing we must understand clearly: gold has a limited supply. Unlike money, which can be printed at the discretion of central banks, the supply of gold is fixed and can only increase through mining — a costly and time-consuming process. This natural scarcity makes gold a sustainably valuable asset.
3.Gold Is a Symbol of History
Gold is not a new type of asset. It has been intertwined with human history for thousands of years. Since the dawn of civilization, gold has been used as a medium of exchange, a precious possession, and even as the foundation of global monetary systems. From ancient Egypt to the modern day, gold has always held a special place in society.
This gives gold a level of longevity that few other assets can match. When you own gold, you don’t just own a valuable physical item — you own a piece of history.
4.Gold Is Easily Convertible and Highly Liquid
Wherever you are in the world, gold can easily be converted into cash. Unlike most other assets, you can sell gold in almost any country and in nearly any circumstance without major restrictions. Therefore, gold is not only valuable but also highly liquid, allowing you to turn it into cash whenever you need it.
5.Gold Is a Tool to Diversify Risk
While stocks or bonds can fluctuate wildly and cause anxiety, gold can serve as a perfect diversification tool. Suppose you have investments in stocks or real estate — allocating a small portion of your portfolio to gold can help reduce risk during times of market turbulence. Gold helps you protect your wealth and maintain stability in an unpredictable world.
6.Gold: An Asset Anyone Can Own
Gold isn’t just for billionaires or big institutions. You don’t need a million-dollar account to own gold. With the rise of online gold trading and products such as small gold bars, jewelry, and even digital gold, anyone can own it conveniently and affordably.
7.Gold Never Goes Out of Style
One unique thing about gold is that its appeal never fades. Every time the price rises, more people rush to buy it. Gold isn’t just valued for its stability and ability to preserve wealth — it’s also a symbol of prosperity and success. A gold ring or a small bar of gold always carries a sense of pride for its owner.
With all these reasons, it’s no surprise that gold is called the “King of Assets.” It can protect you during tough times, provide opportunities for profit in uncertain markets, and remain timeless through generations. Whether you’re a seasoned investor or a beginner, gold will always be a valuable and worthy investment choice.
Would you like to become a billionaire — a true gold trading expert?
💬Share your thoughts about gold below, and don’t forget to hit that like button — it means a lot to me!

Gold 1979 vs 2025 — When History Whispers and Markets Listen
🌕 1. The Echo of 1979
In 1979, the world watched Gold do the impossible. The metal surged from $226 to over $850 per ounce in less than a year, a 275% explosion that turned fear into fortune.
The triggers were seismic.
🇮🇷 The Iranian Revolution disrupted global oil flows.
🏛️ The U.S. Embassy hostage crisis fueled geopolitical panic.
⚔️ The Soviet invasion of Afghanistan reignited Cold War fears.
💸 And double-digit inflation in the U.S. shredded faith in the dollar.
By early 1980, panic replaced logic. Every newspaper screamed, “Buy Gold before it’s too late!” Then came Paul Volcker’s shock therapy as interest rates jumped above 15% and COMEX doubled margin requirements. Within eight weeks, Gold fell more than 40%, marking the end of one of the most dramatic speculative manias in modern history.
🔁 2. Fast-Forward to 2025: The Parallels Are Uncanny
The world of 2025 looks hauntingly similar.
🕰️ 1979 🔮 2025
Iranian Revolution and Cold War tensions Gaza war, U.S.–China decoupling, and regional instability
Oil shock and inflation Energy disruptions and persistent post-pandemic inflation
Dollar under pressure Record U.S. debt and fiscal erosion
Panic buying of Gold Central bank accumulation and retail FOMO
Fed under Volcker turns hawkish Fed under Powell trapped between cuts and control
By late August 2025, gold sat quietly near $3,415, then erupted into a seven-week vertical rally above $4,300, a mirror image of 1979’s euphoric climb. But just like back then, euphoria was the prelude to exhaustion.
⚠️ 3. The Anatomy of the Current Crash
On October 17, 2025, Gold plunged $250 in one day, a shocking 5–6% drop that broke its parabolic structure and sent fear rippling across markets.
What triggered it?
🏦 A hawkish shift in the Federal Reserve’s language as officials hinted rate cuts might be delayed.
💰 Real yields surged, breaking the inverse correlation that had fueled gold’s climb.
🏛️ Institutional profit-taking hit record levels, confirmed by rising COMEX open interest and volume.
🗞️ Sentiment flipped overnight as headlines shifted from “Gold to $5000” to “Gold crashes $250.”
The move marked the first true break of structure (CHoCH) since the rally began, historically the signal that smart money is quietly exiting.
🔍 4. Lessons from 1980 — The Signs of a Top
Before gold crashed in 1980, five clear warning signs appeared.
⚙️ 1979–1980 Signal 💡 2025 Equivalent 🧭 Status
Fed turns hawkish Powell signals “pause / higher for longer” ⚠️ Emerging
Rising bond yields vs. flat Gold Real yield divergence ✅ Confirmed
Parabolic candles Daily range above $100 ✅ Seen
Media frenzy “Gold to $5000” hype ✅ Seen
Margin hikes and record OI Record COMEX participation ⚠️ Rising
Four out of five signals are already flashing. History teaches that when everyone believes Gold can only rise, it’s often about to fall.
🧭 5. What Smart Traders Should Do Now
🟡 Phase 1 – Immediate Protection (Next 24 Hours)
If you’re long, secure 50–75% of gains and protect above $3,950.
If you’re short, trail stops to $4,200 and look for targets at $3,950 → $3,800 → $3,600.
If you’re flat, stay patient and wait for at least two daily candles of stabilization before acting.
🟠 Phase 2 – Stabilization (Next 3–5 Days)
Watch for:
🕯️ Long lower wicks on daily candles show buyer absorption.
📉 Shrinking COMEX volume indicates exhaustion of sellers.
📊 Flat or falling real yields confirming support.
🔵 Phase 3 – Re-evaluation (Next 1–2 Weeks)
If gold reclaims $4,000+ with strength and Fed tone softens, a controlled re-rally may begin. If Gold stays below $3,800, the correction likely extends toward $3,500, the same 30–40% retracement seen in 1980.
🧘♀️ 6. Beyond the Chart — Discipline Over Drama
When a $250 candle appears, instincts scream, “Do something!” But professionals know the truth: reaction destroys capital, observation preserves it. The coming days are not about prediction but about posture. Stay liquid, track sentiment, watch real yields, and remember that even in 1980, Gold’s crash didn’t end its story — it simply reset the cycle for the next era of accumulation.
✨ History doesn’t repeat, but it rhymes. In 1979, Gold taught us that fear creates bubbles. In 2025, it’s reminding us that even truth needs a pullback before it shines again.
If this article helped you today and brought you more clarity:
Drop a 🚀 and follow us✅ for more trading ideas and trading psychology. Thank you.

Gold Buy Setup from 3980 – Targeting Upside ReversalDescription:
Gold has reached a key support zone near 3980, showing early signs of accumulation and a potential bullish reversal.
📈 I’m looking to buy from 3980, with confirmation from price action and trend momentum.
Targets: 4020 / 4050 / 4085
Stop loss below: 3965
Trading style: short-term to swing.
Always manage risk accordingly.
COINBASE:BTCUSD COMEX:GC1! COMEX_MINI:SIL1! OANDA:XAUEUR

Gold weekly chart with both buy and sell entriesLast week both buy and sell levels hit for over 1000 pips each.
This will probably be my last chart for awhile as i dont think theres much intrest in this
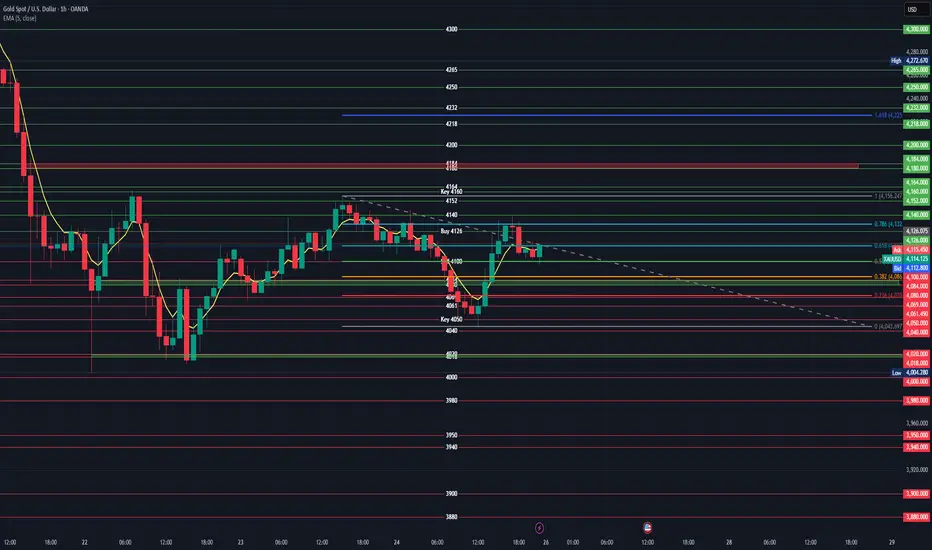
### XAUUSD 4-Hour Chart Analysis
#### **Key Levels Identified**
The chart shows critical **support/resistance zones** based on Fibonacci retracements, historical price action, and labeled key levels. Below is a breakdown of actionable buy/sell levels:
---
### **1. Buy Levels (Long Entry)**
These levels represent potential support where price may reverse upward:
- **Primary Buy Zone**: `4,126` (labeled "Buy 4126" on the chart)
- **Why?** This level aligns with the **0.236 Fibonacci retracement** of the recent swing high (4,164) to swing low (4,004). Historically, price has bounced here.
- **Entry Trigger**: Wait for bullish reversal signals (e.g., bullish engulfing candle, RSI divergence, or price closing above the 5-period EMA).
- **Stop Loss**: `4,095` (below the "Sell 4100" resistance level).
- **Take Profit**: Target `4,160` (Key 4160 resistance), then `4,180` and `4,184`.
- **Secondary Buy Zone**: `4,110–4,115` (near the 0.618 Fibonacci retracement at `4,113.253`)
- **Why?** The price is consolidating here after a dip. A hold above `4,100` (Sell 4100 level) suggests bullish momentum.
- **Stop Loss**: `4,095` (as above).
- **Take Profit**: Same as primary zone (`4,160` and beyond).
---
### **2. Sell Levels (Short Entry)**
These levels represent potential resistance where price may reverse downward:
- **Primary Sell Zone**: `4,132` (0.786 Fibonacci retracement of the swing high/low)
- **Why?** This level is a strong resistance zone where the price often reverses after a rally.
- **Entry Trigger**: Wait for bearish reversal signals (e.g., bearish pin bar, RSI divergence, or price rejecting the level).
- **Stop Loss**: `4,135` (above the resistance level).
- **Take Profit**: Target `4,099` (0.5 Fib), then `4,086` (0.382 Fib), and `4,050` (Key 4050 support).
- **Secondary Sell Zone**: `4,160` (labeled "Key 4160")
- **Why?** This is the **major swing high** (4,164) and a key psychological resistance level. A rejection here confirms a bearish trend.
- **Entry Trigger**: Price must break above `4,160` and then fail to hold (e.g., a bearish candlestick pattern at the level).
- **Stop Loss**: `4,165` (above the resistance level).
- **Take Profit**: Same as primary sell zone (`4,099` and below).
---
### **Critical Context**
- **Current Price**: `4,111.797` (EMA 5 close). This is **above support (`4,100`)** and **below resistance (`4,132`)**.
- **Trend**: Short-term downward momentum after the 4,164 high, but price is recovering from a low. Wait for confirmation of reversal.
- **Fibonacci Retracement**:
- `0.786` (4,132) and `0.618` (4,113) act as key resistance/support.
- `0.5` (4,099) and `0.382` (4,086) are stronger support levels.
- **Risk Management**:
- Always use a stop loss to limit downside risk.
- Target levels should align with the broader trend (e.g., if the trend is bearish, prioritize sell setups).
---
### **Summary of Actionable Levels**
| **Trade Type** | **Entry Level** | **Stop Loss** | **Take Profit** | **Confirmation Signal** |
|----------------|-----------------|---------------|-----------------|-------------------------|
| **Buy** | 4,126 (primary)4,110–4,115 (secondary) | 4,095 | 4,160 → 4,180 → 4,184 | Bullish reversal candle, RSI divergence |
| **Sell** | 4,132 (primary)4,160 (secondary) | 4,135 → 4,165 | 4,099 → 4,086 → 4,050 | Bearish reversal candle, RSI divergence |
> **Note**: Always validate entries with additional indicators (e.g., RSI, volume) and avoid trading during low-volume periods. The 4-hour timeframe favors medium-term trades (1–3 days), so patience is key.
GOLD (XAUUSD) – Possible Pullback Before Next Bullish LegGold is currently reacting from a strong supply area after multiple Breaks of Structure (BOS) and Change of Character (CHOCH) patterns.
Here’s my outlook based on structure:
🔴 Price rejected from the upper zone, showing short-term bearish pressure.
🟠 I’m watching the yellow demand zone (around 3980–3950) for potential accumulation.
📈 From there, market could build liquidity and continue higher toward the next bullish leg.
The plan:
1️⃣ Wait for a drop into the demand zone.
2️⃣ Look for bullish confirmation (BOS or CHOCH on lower timeframe).
3️⃣ Target upside continuation after accumulation.
📊 Structure still favors buyers, but only after this possible pullback completes.
👉 What do you think — will Gold respect the demand zone or break lower first?

XAUUSD - Sell Setup (Risky)Hi All,
I have entered SELL as per the setup. Hope this will give us Green Pips.
Thanks & Best Of Luck
