Gold.Gold.
RARE and IMPORTANT breakout about to occur.
5 more trading before it gets CONFIRMED.
Have a great weekend!
Trade ideas

GOLD $GC Levels and Patterns AnalysisTraders and Investors,
Gold (XAUUSD) has been consolidating mostly but still has been giving a lot of great short term and swing trade opportunities.
I have updated the important levels and zones which can act as support and resistance. They should guide us a bit for the best possible trade opportunities.
There as possible W pattern forming. It has not formed or completed yet. It must first break the trend line and confirm the break. BTW, that trend line can also give us a good opportunities around it. Next, the price has to break the mid point of potential W pattern. Once it has done that, it can complete the W pattern.
Trade what you see, wait for the confirmations and manage the risk as always.
Follow for more. Please support this analysis by liking, commenting, and sharing with friends, colleagues, traders, and trading communities. Thanks👍🙂

Gold weekly chart with buy and sell levelsNo big update this week heading away for a few days.
As always wait for levels these levels will come into play all week

Market Analysis: Gold Price SlidesMarket Analysis: Gold Price Slides
Gold price extended losses below $4,100 before the bulls appeared.
Important Takeaways for Gold Price Analysis Today
- Gold price failed to clear $4,250 and corrected lower against the US Dollar.
- There was a break above a key bearish trend line with resistance at $4,050 on the hourly chart of gold.
Gold Price Technical Analysis
On the hourly chart of Gold, the price was able to climb above $4,200. The price even broke $4,220 before the bears appeared. The price traded toward $4,245 before there was a fresh decline.
There was a move below $4,200 and $4,100. The price settled below the 50-hour simple moving average, and RSI dipped below 40. Finally, it tested the $4,000 handle. A low was formed at $3,997 and the price is now attempting to recover.
There was a break above a key bearish trend line with resistance at $4,050. The price climbed above the 23.6% Fib retracement level of the downward move from the $4,244 swing high to the $3,997 low.
Immediate resistance on the upside is $4,100. The first major hurdle sits at $4,150 and the 61.8% Fib retracement. A close above $4,150 could initiate a recovery wave to $4,185. An upside break above $4,185 could send Gold price toward $4,250. Any more gains may perhaps set the pace for an increase toward $4,320.
If there is no recovery wave, the price could continue to move down. Initial support on the downside is near the $4,050 level. The first key area of interest might be $4,000. If there is a downside break below $4,000, the price might decline further. In the stated case, the price might drop to $3,880.
This article represents the opinion of the Companies operating under the FXOpen brand only. It is not to be construed as an offer, solicitation, or recommendation with respect to products and services provided by the Companies operating under the FXOpen brand, nor is it to be considered financial advice.

Gold prices weakened and fell! Analysis and reference.
On Tuesday during the Asian session, gold traded around $4030, continuing its decline. Market sentiment has shifted significantly, with investors' expectations for a Federal Reserve rate cut next month falling sharply, putting downward pressure on gold. Since interest rate trends are one of the core variables affecting precious metal prices, when the market believes the Fed will not quickly enter an easing cycle, gold's attractiveness as a non-interest-bearing asset decreases, directly leading to a continued correction in gold prices. With the market lowering its expectations for a short-term US rate cut, coupled with a continued strengthening of the US dollar, gold prices fell under pressure. The market is focused on the US non-farm payroll data to be released this week, while hawkish comments from Fed officials have reinforced the market's judgment of maintaining high interest rates. Overall, gold prices are trending weakly in the short term, and market sentiment remains highly sensitive to the interest rate path.
Meanwhile, the US dollar index rose for the third consecutive trading day, increasing the cost for investors holding other currencies to purchase gold, further suppressing gold demand. Due to the prolonged US government shutdown and the delayed release of official economic data, investors are more reliant on Fed policy signals, thus exacerbating short-term volatility in the US dollar, which indirectly affects gold prices. Recent hawkish statements from Federal Reserve officials have made the market less willing to bet on a rate cut in advance. These comments have further weakened market expectations for a December rate cut. Latest data shows that the market is currently pricing in only about a 45% probability of a 25 basis point rate cut in December, significantly lower than the 60% of the previous week. Overall, gold's short-term trend remains weak. A stronger dollar coupled with a downward revision of rate cut expectations are the main factors currently suppressing gold prices. If the non-farm payroll data is strong or the Fed continues to use hawkish language, the downward pressure on gold may increase further. However, if the data is significantly weak, or the market reprices the probability of a December rate cut, gold prices may regain upward momentum. Maintain a cautious attitude and pay close attention to the volatility brought about by key data releases.
Gold Price Trend Analysis:
Reviewing yesterday's gold price performance, it showed a relatively clear downward trend. Specifically, the gold price moved downwards along the five-day moving average, a trend that often suggests a short-term weak market from a technical analysis perspective. In the early morning, the gold price experienced a sharp decline, which undoubtedly exacerbated the tense atmosphere in the market.
From a daily chart analysis, gold closed yesterday with a medium-sized bearish candlestick with upper and lower shadows. This candlestick pattern contains rich market information. The presence of the upper and lower shadows indicates that both bulls and bears exerted brief pressure during the struggle, but ultimately the bears prevailed, pushing the price lower. The final close was a bearish candlestick, forming a "three-day losing streak" pattern on the daily chart, indicating a short-term weak trend. From a trend perspective, the bearish pattern in the gold market remains unchanged.
Based on the above technical analysis and market trends, we can make a reasonable expectation for the future price movement of gold. We anticipate that the gold price will further test the support level of the lower trendline on the daily chart. Therefore, our trading strategy for today remains unchanged: sell on rallies. Specifically, we will focus on the 10-day moving average as a reference point for entering short positions today. For the downside target, we will first look at yesterday's low. If the price breaks below yesterday's low, we can expect further declines. Taking into account various factors, we have identified the following specific resistance and support levels. Resistance levels are 4055, 4075, and 4095. These levels have historically acted as resistance, making them key areas to monitor during trading. Support levels are 4005, 3976, and 3930. These are key points where prices may find support and rebound. Our trading recommendation is to short at the 4055 area (10-day moving average), with an 8-point stop-loss to manage potential risk. If the price breaks the stop-loss, we can wait for a rebound to the 4075 area to re-enter short positions. Our target is the support levels of 4005 and 3976. It is important to note that the market is fraught with uncertainty and risk. The above trading strategy is for reference only. Investors should carefully consider their risk tolerance and investment goals before making investment decisions. We hope every investor achieves good fortune in the market and reaches their investment goals. The key resistance level to watch in the short term is 4055-4075, while the key support level is 4000-3975. Please keep up with the pace.

Gold Just Broke Out of Her Flag — I’m Buying the MomentumXAU/USD just gave us a clean breakout from a textbook bull flag on the 4H and Daily chart — and I’m looking to ride this wave back toward the highs.
Price respected the 21 EMA on both the Daily and Weekly, which confirms continuation. We had a healthy pullback after the October rally, formed a symmetrical flag, and now we’re seeing the breakout and retest in motion. Momentum is shifting back to the upside — and smart money looks ready to push price higher.
My plan is to buy from the current zone or on a slight pullback toward 4080. My first target is the previous high at 4280, and second target is the psychological resistance at 4400.
This is a momentum play with structure on our side — nothing forced, just flowing with the chart.
Entry: 4080–4100
🛑 SL: 3980
🎯 TP1: 4280
🎯 TP2: 4400

GOLD STRONG BUYGold has shown rejection on the HTF Wick C.E Quadrants and has formed an FVG on the hourly chart.
If Price respects C.E of the H1 FVG I expect aggressive higher price delivery.
Safe Trading!
Waridi Ghost Pips.

Markets Shocked by NFP; Gold Outlook Stays BullishThe long-delayed NFP report has finally been released—and the numbers shocked the market. Nonfarm payrolls increased by 119K, more than double the forecast of 50K, while August’s figure was sharply revised down to -40K. This surprisingly strong report effectively shattered the narrative that the U.S. economy is heading toward a “hard landing.”
At the same time, however, the unemployment rate rose from 4.3% to 4.4%, hitting a four-year high. This combination of strong job growth and rising unemployment paints a contradictory picture—providing ammunition for both hawks and doves.
More importantly, due to the government shutdown, the October jobs report has been completely canceled. Data for October and November will be merged and released in December—one week after the next FOMC meeting. This means the Fed will base its upcoming policy decision mainly on this outdated September report.
Meanwhile, news surfaced that the U.S. has submitted a “peace plan draft” to Ukraine. Against the backdrop of ongoing battlefield escalation, this sudden hint of possible ceasefire has reignited global risk aversion.
In the short term, the September NFP report weakens expectations for a December rate cut, pushing the dollar higher and putting pressure on gold.
In the medium term, however, the absence of October data, rising unemployment concerns, risks of escalation in the Russia–Ukraine conflict, and expectations of a global rate-cut cycle beginning around 2026 all provide solid support for gold bulls.
As a result, gold is likely to continue its broader upward trend after a period of consolidation.
On the 2-hour chart, gold is currently capped by the MA60. If it breaks above and stabilizes, the price may retest the 4150–4200 region.
If it fails to break through, a pullback toward 4050–4000 is likely.
On the daily chart, MA60 around 3918 remains a strong structural support.
Considering both fundamentals and technicals, the primary approach remains buying on dips.
Those who prefer high-frequency trading can also sell at key resistance levels.
Maintain proper risk management, stay patient, and let the market reveal the next major opportunity.

GOLD - Elliott Wave AnalysisGold has now confirmed a breakout from the contracting triangle, completing the B wave of the corrective structure. This breakout supports the expectation that price is preparing for a C-wave advance toward the upper Fibonacci cluster.
Current Structure
• Triangle confirmed as wave B
• Breakout aligns with the internal subdivisions
• Wave (2) still unfolding as a W-X-Y / ABC-type correction
• C-wave upside targets: 4140–4180
• Key fib levels: 0.618 = 4153, 0.764 = 4188
What to Expect Next
A clean impulsive rise is anticipated as the C-wave develops.
Invalidation remains below the B-wave low.
Completion of Wave (2) in the highlighted zone would maintain the broader bearish sequence.
Structure remains clear and the roadmap is intact.

XAUUSD Forming Ascending TriangleXAU/USD (Gold) is building a very constructive technical structure, forming a tightening rising-triangle (or ascending triangle) on the daily chart. The upper trendline is acting as resistance, while the lower trendline is offering steady support. This compression suggests that a breakout is imminent: if gold clears the upper boundary with strength, it could trigger a significant bullish continuation.
On the macro and fundamental side, gold remains well supported by dovish expectations around U.S. monetary policy, persistent geopolitical uncertainty, and safe-haven demand. Real yields in the U.S. have been under pressure, giving non-yielding assets like gold greater appeal as a hedge. In addition, inflation concerns have not fully subsided, which could continue to drive interest in gold as an inflation play.
From a market dynamics perspective, central banks’ ongoing purchases of physical gold and ETF inflows are likely contributing to the higher-timeframe bullish bias. These flows, combined with tight technical structure, suggest that buyers are positioning for a fresh leg higher. If this breakout plays out, gold’s next target could push toward new nominal highs or record-equivalent levels, depending on momentum.
In terms of strategy, a long entry makes sense on a daily close above the upper trendline, ideally with a retest of that breakout as confirmation. A tight stop could be placed just below the triangle’s lower trendline to manage risk. If executed well, the upside could be very attractive, given gold’s macro fundamentals and the strength of its structural setup.

Gold. Can we run from bull trap? 20/Nov/25Xauusd probably having pullback toward 4185 +/- before a "big surprise " for bull...

Gold Pullback and Downtrend Continuation - Head and Shoulders I am anticipating Gold to continue to drop. But first it looks as though it is pulling back.
My bearish bias will be invalidated if it breaks the 4111 zone.


XAUUSD Breakout & Demand Zone Long Setup (30m Timeframe)This chart shows XAUUSD on the 30-minute timeframe, where price has broken out of a descending trendline, indicating potential bullish momentum. After the breakout, price retested the nearby demand zone (highlighted in pink) and is now pushing upward.
A long (buy) setup has been marked with:
Entry: After trendline breakout & demand zone retest
Stop Loss: Below the demand zone
Take Profit: Toward the major supply/resistance zone above (highlighted in red)
This setup reflects a classic trendline breakout + retest continuation pattern, targeting the next key resistance area.

Hellena | GOLD (4H): LONG to resistance area of 4382.Colleagues, in the last forecast I made a markup of corrective movement (ABC), but the price broke important resistance levels and it means that the price is still in the impulse, namely in the wave “5” of higher order and wave “3” of medium order.
I believe that soon we will see a correction in wave “4”, then an upward movement to the resistance area of 4382.
The correction in wave “4” may reach the support area of 4075, but I still recommend to work with pending orders and look out for long positions.
Fundamental context
The gold market continues to benefit from favourable conditions: demand for safe-haven assets is increasing amid global uncertainty and a weaker US dollar. At the same time, central banks’ purchases of gold remain at record highs, providing a strong structural base for further upside. Despite the recent pullback, the key drivers — low real interest rates and reserve-diversification efforts — remain intact.
Manage your capital correctly and competently! Only enter trades based on reliable patterns!

GOLD → Correction and retest 4150 FX:XAUUSD still retains its bullish structure. The price is entering a correction phase within the trading range. The key support level that may attract the attention of MM is 4150.
The probability of a decline in December fell to 51% (from 63% the day before) after hawkish statements by Fed officials. Government bond yields are rising. These factors are putting pressure on gold.
However, a weak dollar, a flight to safe assets amid global market sell-offs, and uncertainty surrounding US data (September reports may be published, but October data is likely to be lost) are providing support for the bullish trend.
Gold retains its growth potential due to macro risks. A short-term correction is possible due to profit-taking ahead of the weekend, but the $4150 level remains key support.
Resistance levels: 4211, 4239
Support levels: 4161, 4150, 4100
Within the current trading range, the focus is on support at 4161 - 4148. A false breakdown and bulls holding prices above key levels could trigger a rebound and growth to local resistance levels...
Best regards, R. Linda!

LiamTrading – XAUUSD H1 | Gold holds 0.618, prioritize ...💛 LiamTrading – XAUUSD H1 | Gold holds 0.618, prioritize bullish scenario for Wednesday 🎯
Gold continues to recover after the previous decline and is currently right at the 0.618 Fibonacci level on H1 – indicating that buyers still hold the advantage. The price is also clinging to the upward trendline and the thick Volume Profile area around 407x, so today I continue to prioritize the BUY scenario following the trend.
📰 Macro – news context
After the US government reopened, the market is preparing to receive a series of economic data today and tomorrow → USD and gold can both fluctuate strongly according to the news.
President Trump attacked Fed Chairman Powell, calling him "stupid and incompetent," expressing that he wanted to fire him immediately but was prevented by advisors.
👉 Therefore, market sentiment is quite sensitive: just a tilt towards a rate cut scenario in the data could further support gold.
📊 Technical – H1 with Fibonacci, Trendline & Volume Profile
Fibonacci 0.618: The price is at the 0.618 level of the most recent decline; if it holds above this level, the natural target will be the FVG area + resistance above 4120–4150.
Upward trendline H1: The trendline from the most recent bottom is supporting the price very well; each touch back to the trendline results in a rebound → this will be an ideal area to wait for a BUY.
Volume Profile & Liquidity:
Cluster 4075–4080 is the Buy Liquidity area – thick volume, many orders exchanged → very suitable as an entry point if the price retests.
VAL ~4040 and the Support + FVG area around 4020 are the next defense lines if the market is swept deeply.
Upside liquidity: The past FVG on H1 is still open to at least 4150, so if the bullish scenario succeeds, gold can fully extend to this area.
🎯 Reference trading scenario (LiamTrading)
1️⃣ BUY following the trend – main priority
Entry: 4078–4080 (retest trendline + strong volume cluster)
SL: 4073
TP: 4094 → 4120 → 4140 → 4175
💡 Note:
Wait for M5–M15 to have a nice reaction candle (long lower tail, pin bar, or bullish engulfing) around 4078–4080 before entering the order.
When the price moves ~1R, move SL to breakeven to protect the account.
2️⃣ Price area for short scalping
Support – quick buy: 4048 – 4023 (VAL + lower FVG area).
Resistance – quick sell: 4121 – 4151 (FVG + upper liquidity area).
This is just a scalping area, so:
Enter orders on small frames (M5–M15).
Close quickly, do not hold orders through strong news.
✅ Summary
Short-term trend: leaning towards bullish, as the price holds above the H1 trendline and the 0.618 area.
Main plan: wait for BUY 4078–4080, target direction 4120 → 4140 → 4175.
Do you think gold will go straight to 4150 today or will it be swept back to 404x first?
👉 Comment your perspective & Follow LiamTrading channel to receive daily XAUUSD plans on TradingView.

XAUUSD is ready for a deeper correctionA Historical Run
For the last 2 months, Gold ( OANDA:XAUUSD ) was an absolute monster. Near vertical move. All pullback shorts were destroyed. The momentum was just intense.
Corrective Structure
As all impulsive moves must, the rally is now exhausted , and we are in a corrective phase. Price is no longer going up, but it is consolidating.
What's Next?
The current wave down appears to be shaping into a bearish AB=CD.
In a classic AB=CD pattern, the length of the CD leg must equal the length of the AB leg.
I will not be looking for any long setups until price reaches $3700~3770 range, and shows signs of reversal.
Until then, my view is still bearish on XAUUSD. I'm expecting a pullback testing the previous resistance ($4150) then continuation to the down side.
Good Luck!

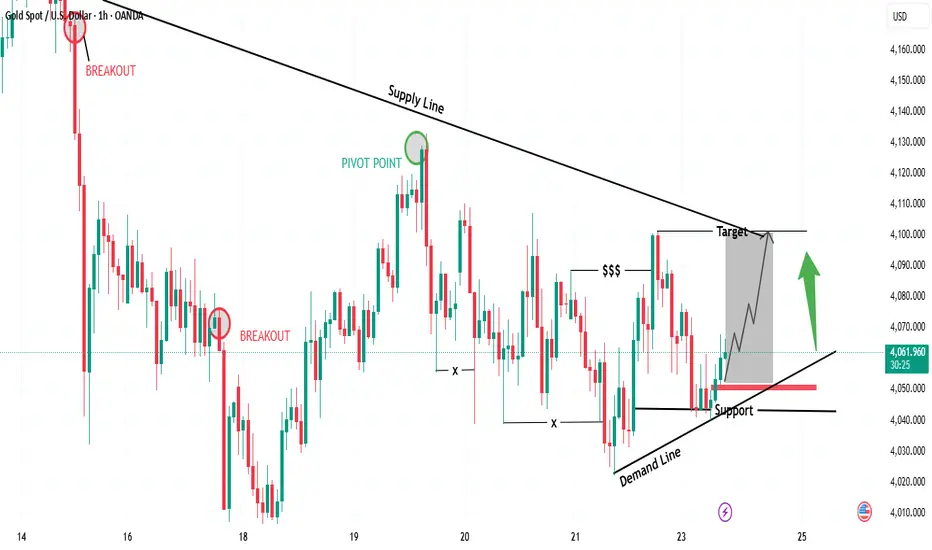
“Gold Rebounding from Demand – Targeting Supply Line Retest🔍 Key Observations
📉 Supply Line (Downtrend Resistance)
Each rally is being capped by the descending supply line
📈 Demand Line (Ascending Support)
Buyers defending higher lows
Strong bullish reaction off support
💰 Liquidity Grab ($$$)
Liquidity was taken below swing lows — bullish signal
Smart money likely securing positions before pushing up
🟢 Bullish Confirmation
If price holds above demand line + support zone
Expect bullish continuation toward supply line retest
🎯 Suitable Target Levels
Target Level (Approx) Status
🥇 First Target 4,095 – 4,105 At supply line retest
🥈 Extended Target 4,120 – 4,130 Breakout continuation
📌 Trade Idea (Bullish Scenario)
Entry Zone: 4,055 – 4,065 🟩
Stop Loss: Below 4,025 ❌
Take Profit 1: 4,100 🎯
Take Profit 2: 4,125 🚀
RR Ratio: 1:2.5 – 1:3 📈
🧭 Market Sentiment
📍 Bias → Short-term Bullish
🛑 But… sellers may reappear at supply line
⚠️ Watch for fakeouts near the target
BEAR TRAP? - PATH TO 5KIllustrated, I am trying to visualize what the path to 5k could look like SHOULD this be a bear trap and 4000 major support price to hold ground.
Fundamentals keep getting bullish for gold, and demand at a central bank level simply does not stop.
The Fiat currency as we know it, is slowly loosing credibility, and the major shift toward a digital era backed by gold is not fiction anymore and rather quite potential.
The US MUST do what it can to save their reputation and economy, by devaluating the USD dollar and re-valuating the price of Gold, in order to artificially lower their debt. At least that's one way they're trying to pull this off...
REMEMBER: The reasons for WHY things happen almost never matter; what truly matters is WHAT is happening...
Gold is stuck in a corrective phase, and in my humble opinion, it's closer to the next bullish move than many might think.
GOOD LUCK,
persa

Gold (XAUUSD): Buy setupGold (XAUUSD): Buy setup. Although it has started its move but I think there is still opportunity for us to enter.
Cheers

XAUUSD 30m – EW Long SetupHi fellow traders,
On the 30m XAUUSD chart, I am applying Elliott Wave principles to outline a potential long setup. Price is forming a clean substructure within the larger wave 5 on the higher timeframe. After completing a corrective move, price is stabilizing above the invalidation level and showing early bullish momentum, suggesting continuation within the internal wave sequence.
I am entering at the current price, with a Stop Loss at 4030.15 and an invalidation level at 4004.72. My Take Profit is set at 4272.15, targeting the next internal wave objective — not the completion of the full higher-degree wave 5.
If price drops below the invalidation level, this substructure count is no longer valid.
Good luck and trade safe!

XAUUSD-1H_BuyShort and Medium Term Gold Analysis
Head and Shoulders Bottom Pattern Formation
Net Profit for Buyer in $4000 Channel
