Gold Key Levels (4000-4400)These are the Gold key levels which I’ll be using for trading.
Here’s how I trade these levels:
- Close above a level → Buy setup
When a candle closes clearly above a level, it confirms bullish momentum and I look to enter long immediately after the close.
- Close below a level → Sell setup
A confirmed candle close below support signals bearish strength, and I enter short right after the close.
- Rejection from a level → Opposite trade
If price shows a strong rejection from a level, I trade in the opposite direction - rejection from resistance = sell setup, rejection from support = buy setup.
These levels works well for both day trading (using 1H candles) and scalping (using 15M or lower timeframes). It keeps trading simple, just reactions to market behaviour.
Trade ideas

XAUUSD meltdown before hitting new all time high$Guess before the price race for the moon we already respected the Weekly Bearish Imbalance nd closed the week with rejection wick...… I anticipate price to target HTF equilibrium and the Monthly FVG before I look for any buys.

Gold Surges, Resuming Bull Market!The bull market is back, and gold prices have risen as expected to above 4100. The opportunity has arrived, and it must be seized. Those who have been following the trend know that after the previous drop to 3888, we advised against excessive bearishness, suggesting a rebound from the lows, targeting 4050. A break above 4050 would trigger a one-sided trend. Although it consolidated for two weeks, Monday's opening saw a direct break above 4050, and the price has now surged to around 4140, a single-day gain of over $100 – this demonstrates the strength of the bulls' counterattack. Undoubtedly, gold is now in a bullish trend, forming a strong one-sided move. Therefore, the next targets for gold are 4186-4250, and a high of 4300.
This week is packed with positive news. The US government resumed its meetings on Monday, potentially ending the shutdown. CPI data will be released on Thursday, and PPI data on Friday. If the US government continues operating normally, the data released on Thursday and Friday will have a significant impact. The current market situation has both a solid foundation and strong intraday performance; it's just missing a data release to influence the market, otherwise the bulls would be even more aggressive. As analyzed on Monday, after gold broke through 4050 this week, we were expecting a one-sided trend, with targets at 4200 and 4300. The trend is now clear; Monday saw a direct break of 4050, a single-day increase of over $100. Having confirmed the one-sided trend, we expect it to continue today. Technically, after the daily chart's bottoming consolidation, the upward movement has broken through the Bollinger Band's middle band resistance. The next target is the upper Bollinger Band at 4300. Whether it breaks through the upper Bollinger Band will depend on the strength of the bulls. Until then, we must maintain our bullish outlook. The 4-hour Bollinger Bands have already widened, indicating the bullish momentum is just beginning. Therefore, there's not much to say; we must maintain a bullish stance and adhere to two principles: go long with the trend, don't try to predict highs, and absolutely avoid shorting. Therefore, the entry point for long positions today is around 4110, which is the support level on the short-term chart. The overall strategy is to buy on dips, targeting 4186, and potentially 4250 with a strong upward move. In summary, Jin Shengfu suggests a short-term trading strategy of buying on dips and selling on rallies. Key resistance levels to watch are 4186-4250, and key support levels are 4110-4115. Please follow the trend closely.
Selling Strategy: Sell gold in batches around 4186-4190, targeting 4160-4150, with a further target of 4130 if it breaks through.
Buying Strategy: Buy gold in batches around 4110-4115, targeting 4150-4190, with a further target of 4250 if it breaks through.

XAUUSD – V-Shark OB Setup Review (Nov 20) Price reacted perfectl“Gold moved exactly as expected this morning.
A clean V-Shark OB setup: Structure – OB – Fibo – Volume all aligned.
Just a small refinement around the Volume Gap can make this setup even more optimal.”
“VNShark – Follow the shark’s footprints with V-Shark OB.”
#XAUUSD #Gold #VNShark #OrderBlock #VSharkOB #Volume
#PriceAction #SmartMoneyConcept #Liquidity #TradingVietNam
#ForexAnalysis #MarketStructure #BearishOB

XAUUSD H4 Market OutlookGold Outlook: Market Flashes Early Reversal Signals
Weekly Overview
- Gold closed the week at $4085.83, up 2.11%, but the rally is already showing cracks. Price failed to stay above the critical 50% monthly retracement at $4133.95, which instantly weakens the bullish narrative. Add the sharp rejection from $4245.20, and you’re looking at a market that’s losing follow-through right where buyers needed to dominate.
Fundamentals
- The 43-day U.S. government shutdown left holes in key economic data; CPI and NFP may never be published, so the Fed is flying partially blind into the December meeting. That uncertainty alone distorts every macro-driven asset, including gold.
- The Michigan Index is down 30% YoY, scraping near 1978-level pessimism. ADP shows job cuts averaging 11,000/week. Confidence is fragile, and the Fed remains split after two rate cuts this year.
Technical Breakdown
- Gold’s biggest job this week was simple: hold above $4133.95. It didn’t. That failure keeps that level as immediate overhead resistance.
Bullish Requirements
- Reclaim $4133.95
- Break and hold above $4245.20
- Only then does a push toward the record high at $4381.44 become realistic
Bearish Threats
- Last week’s rejection from $4245.20 is the textbook starting to point if buyers don’t return fast, sellers have clean downside targets:
- $3886.46 (minor swing low)
- $3846.50 → $3720.25 (retracement zone)
- Momentum already shows signs of fatigue.
Forward Bias
- The long-term trend is still up, but the weekly structure has shifted from “confident rally” to “prove it or lose it.”
- Until price decisively reclaims $4133.95, expect choppy action with a downside lean; especially if Fed minutes or Michigan sentiment reinforce uncertainty instead of relief.

DON'T TRADE THESE SUPPORTS AND RESISTANCES (FOREX GOLD)
When it comes to technical analysis,
the understanding of which support and resistance levels to not trade can be as important as knowing which ones to trade.
In this article, I will show you the structure levels that professional traders avoid to maximize their profits and minimize losses.
Invalidated support and resistance
Invalidated support/resistance is the structure that has a clear historical significance, but that lost its strength and was neglected by the market during the last 2 tests.
Have a look at that key horizontal support.
We can see that in the recent past, the price bounced from that multiple times, confirming its significance.
Then, the price suddenly broke and closed below that support.
According to the rules, that structure should turn into a resistance after a violation.
However, after its test, the price bounced and violated that to the upside.
The structure became invalid , and you should not trade that in future.
Resistance in a Bullish Trend
If the market is trading in a bullish trend, according to the rules its last higher high composes a key horizontal resistance.
USDJPY is trading in a strong bullish trend.
The price dropped once it set a new higher high higher close.
It composes a key horizontal resistance.
Always remember, that in a bullish trend, the price tends to set new higher highs and higher lows over time.
Quite often, the test of the level of the last high leads to a further bullish continuation and a formation of a new higher high.
For that reason, it is better not to trade such resistances.
Support in a Bearish Trend
In a bearish trend, the last lower low is always considered to be a key horizontal support.
Above is a price action on USDCHF.
The pair is bearish and recently set a new lower low.
It is a key horizontal support now.
However, in a bearish trend, the price tends to set a new low after a retracement. Most of the time, it does not respect the support based on the last lower low.
I recommend you not to trade such supports.
I always repeat to my students that key levels work, but they are not equal in their significance. While some of them are very strong, some are better to be avoided.
❤️Please, support my work with like, thank you!❤️
I am part of Trade Nation's Influencer program and receive a monthly fee for using their TradingView charts in my analysis.

Gold Price Balanced Amid Heightened UncertaintyGold Price Balanced Amid Heightened Uncertainty
As the XAU/USD chart shows, last week gold prices fell sharply, interrupting the previous upward trend. This decline was driven by two main factors:
→ End of the US government shutdown. This is believed to have reduced short-term economic risks and lessened demand for gold as a “safe-haven” asset.
→ Hawkish statements from Federal Reserve officials, which lowered market expectations for rate cuts. This pushed up US Treasury yields, traditionally putting downward pressure on non-yielding assets like gold.
This week, the market is awaiting a wave of delayed US economic reports that were postponed during the shutdown, including:
→ Labour market data (Non-Farm Payrolls)
→ Inflation data (CPI)
These releases are expected to give traders greater clarity on the future trajectory of Fed interest rates.
Technical Analysis of XAU/USD
From a technical perspective, the price is currently trading at the intersection of two key lines:
→ Resistance line from the upper boundary of the descending channel originating at the all-time high. Buyers attempted to break through this level last week but were unsuccessful.
→ Support line from the lower boundary of the ascending channel, in place since early autumn.
Given the above, it is reasonable to suggest that:
→ the market is in a balanced position, with traders adopting a wait-and-see approach;
→ a breakout from the symmetrical triangle could indicate the direction of the next significant move in gold prices.
This article represents the opinion of the Companies operating under the FXOpen brand only. It is not to be construed as an offer, solicitation, or recommendation with respect to products and services provided by the Companies operating under the FXOpen brand, nor is it to be considered financial advice.

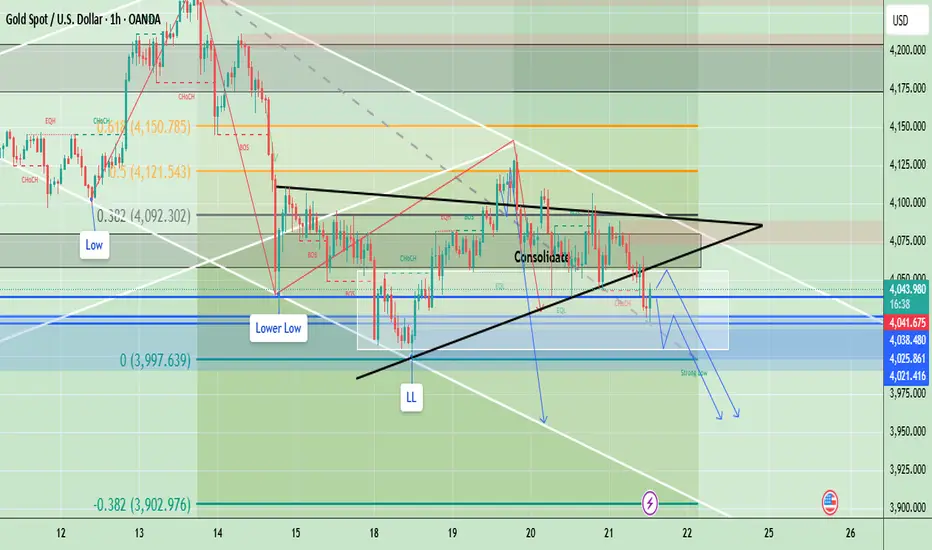
Gold Bearish Structure Continues – Sell Levels UpdatedGold remains bearish after rejecting from the upper consolidation boundary and continuing its pattern of lower highs and lower lows. Price has now broken below the triangle-consolidation zone and is retesting the lower boundary around 4038-45 which aligns with previous liquidity. As long as price stays below the triangle resistance and fails to reclaim 4080 momentum favors further downside. The next bearish targets lie below the Strong Low zone aiming toward deeper liquidity and Fibonacci extensions.
✅ Bias: Sell below 4080
- Sell Zone: 4045 - 4055 (Retest of broken consolidation + minor supply)
- Stop Loss: 4082 (Above triangle resistance + structure break)
- Take Profit: 4025 - 4008 - 3988
- Invalidate: 4082 (Above triangle resistance + structure break)
Note
Please risk management in trading is a Key so use your money accordingly. If you like the idea then please like and boost. Thank you and Good Luck!
Report 16/11/25Macro & Geopolitical Risk Report
The week delivered a meaningful policy pivot on tariffs, a tentative trade détente with Europe and Switzerland, and a muddled, but resilient, risk backdrop. U.S. equities were choppy yet finished essentially unchanged, rescued mid-week by dip-buyers; the Dow gained about 0.3%, the S&P 500 edged up 0.1%, and the Nasdaq slipped 0.5%. Ten-year Treasury yields and gold firmed, while a jump in U.S. natural-gas futures complicated the near-term disinflation narrative. The government re-opened and set Nov. 20 for the first backlogged jobs report, restoring a macro data anchor ahead of the December FOMC.
Policy: The U.S. Walks Back Tariffs, Switzerland Deal Lands, EU Trade Recovers
President Trump ordered tariff cuts on beef, coffee, and dozens of food items, an explicit walk-back of the broad “reciprocal” levies that had lifted consumer prices. The reductions are retroactive to 12:01 a.m. Thursday, Nov. 13. The shift reflects legal risk (recent Supreme Court skepticism of tariff authorities) and political pressure to blunt cost-of-living stresses.
Separately, Washington and Bern clinched a deal cutting U.S. tariffs on Swiss goods to 15% from 39%, a dramatic de-escalation that came alongside Swiss pledges to invest roughly $200 billion in U.S. manufacturing (pharma, gold smelting and more) by 2028. The campaign to unlock the deal involved a sustained Swiss corporate push after tariffs hit in August.
Across the Atlantic, EU exports to the U.S. rebounded in September to €53.1 billion (up 61% m/m; 15.4% y/y), consistent with a summer agreement around a 15% tariff on most U.S. imports that reduced uncertainty and stabilized flows. The U.K., by contrast, saw U.S. exports fall to a post-2022 low, highlighting the asymmetric gains from the EU-U.S. framework.
Finally, the White House floated a “tariff dividend” of at least $2,000 for most Americans, underscoring how central tariff proceeds have become to the fiscal narrative during the shutdown. Markets rightly view this as highly uncertain given legal headwinds and congressional prerogatives over tax-and-spend.
Strategic Take: Inflation Mix Improves on Goods, But Energy & Services Complicate
The tariff roll-back should bleed into lower goods inflation over the next one to two quarters, easing food-at-home CPI components and input-cost pressures for manufacturers. That said, parallel forces pull in the other direction. Natural-gas futures hit their highest levels since the early-2022 shock, with knock-ons to electricity and data-center costs; Kansas City Fed’s Schmid flagged that price pressures are increasingly embedded outside tariff-sensitive goods. With the data blackout ending Nov. 20 (September jobs first), the Fed regains visibility, but officials have already nudged markets away from assuming imminent cuts. Netting it out, the rate path is still “modestly restrictive,” but a clean, linear disinflation is less likely than a bumpy glide.
Trade & Tech: Supply-Chain Easing Offset by Strategic Screening
Trade frictions are easing at the headline level, yet national-security screening is deepening. Beijing plans a “validated end-user” system to expedite rare-earth and critical-material exports to U.S. buyers while filtering out defense-linked end users, potentially smoothing civilian supply chains without loosening controls where they matter most. Parallel skirmishes around critical minerals (e.g., antimony) keep defense-industrial vulnerabilities in focus. Expect a world of narrower, rule-bound trade rather than broad liberalization.
Market Reactions
Equities absorbed early-week AI/tech weakness and a shutdown hangover but were cushioned by reopening momentum and buy-the-dip flows. Notably, OPEC+ paused output-increase plans, helping put a floor under energy even as the growth-inflation mix stayed noisy. Bond markets finished the week wary: term premia remained sticky and the bar for rapid Fed cuts rose.
Asset-By-Asset Outlook
XAUUSD (Gold). Real-rate sensitivity still dominates. The tariff walk-back marginally helps the disinflation case, which is gold-negative at the margin, but the rise in natural-gas prices, fiscal experimentation (e.g., “tariff dividend” chatter), and legal uncertainty around tariff authorities add a tail of macro volatility that supports strategic gold allocations. Near term, gold tracks the 10-year TIPS move and the Nov. 20 jobs print; soft labor data with sticky energy would be gold-constructive into December.
S&P 500 / Dow Jones. Lower food/input costs and a calmer transatlantic trade setting are constructive for U.S. cyclicals and staples, while policy clarity should compress risk premiums in rate-sensitive defensives. The Dow’s relative resilience versus the Nasdaq aligns with a market that is re-rating profit stability over capex-heavy AI stories, at least tactically. Use drawdowns linked to the data backlog catch-up as opportunities in cash-generative, domestic-tilted names; fade spikes in depreciation-heavy mega-cap AI spends until free-cash-flow inflections prove durable.
DXY / USDJPY. Goods disinflation from tariff relief is dollar-negative on the margins via a softer expected Fed path, but services/energy stickiness tempers that. For USDJPY, the path of least resistance is range-bound drift rather than trend reversal until Japanese policy tightens more meaningfully; watch U.S. jobs and the November PCE for any repricing of 2026 cut timing. A narrowly weaker DXY into year-end is plausible if U.S. data re-soften and the EU-U.S. trade thaw sustains EUR-positive flows.
Crude Oil. OPEC+’s decision to pause planned output increases stabilizes the back of the curve, while the Swiss deal and EU-U.S. détente reduce tail risks to European demand. Offsetting that, sanctions frictions and shipping security still inject episodic volatility. Base case is a sideways-to-firming bias into winter on inventory draws and power-sector gas-to-oil switching under extreme weather.
Fiscal and Political Implications
Tariffs have been performing double duty: as negotiating leverage abroad and as a fiscal plug at home. The Supreme Court’s skepticism introduces a non-trivial risk that the revenue tap narrows, complicating claims of a deficit downshift and rendering any “tariff dividend” politically appealing but operationally fragile without congressional buy-in. Markets will parse the post-shutdown data for signs the fiscal impulse is fading before any 2026 rate-cut cycle is fully priced.
Risks
The biggest near-term macro risk is legal: an adverse ruling on tariff authorities would force a redesign of the administration’s trade architecture and shrink near-term revenue. Geopolitically, the materials “VEU” channel is promising but untested; any breakdown would revive supply-chain tightness in magnets, chips and defense inputs. Energy-price spikes tied to weather or logistics could re-accelerate headline inflation just as goods disinflation arrives, re-widening the policy-error window.
Opportunities
In multi-asset portfolios, lean into beneficiaries of easing goods inflation and steadier trade, U.S. staples, select industrials with U.S. cost bases, and EU exporters tied to the U.S. cycle, funded against depreciation-heavy AI stories still in the “show me” phase. Maintain strategic gold for tail-risk hedging and keep a tactical long bias in high-quality energy on OPEC+ discipline and winter demand hedging. For FX, express a modestly weaker dollar via EURUSD on improved EU-U.S. trade optics, but keep USDJPY hedged given asymmetric BoJ timing risk.
Asset playbook, catalysts, and Europe-centric positioning (continuation)
The tape is now swinging between AI-capex euphoria and depreciation math, with policy and energy acting as the macro governors. Two near-term facts anchor the next leg: first, the return of official U.S. data prints after the shutdown, including September nonfarm payrolls scheduled for release on Nov. 20 and a Fed communication cadence that has already cooled the probability of a December rate cut; second, an oil complex that just lost an expected OPEC+ supply increase for this week, even as China’s policy and trade signals selectively ease cross-border frictions. The odds of a December trim fell below one-half as multiple Fed officials tamped down expectations, a shift that has tended to support the dollar at the margin and raise the bar for an equity multiple expansion that is already rich by historical standards. On the commodity side, OPEC+’s pause on output hikes keeps the market tighter into year-end than many desks had penciled in, giving crude an upside skew on supply surprises.
For equities, I would treat the next 2–4 weeks as a volatility-harvesting window rather than a trend-chasing one. The S&P 500’s advance/decline and breadth indicators remain fragile, and “AI build-out” leadership is more rate-sensitive than the marketing decks imply because capex is now colliding with credit. Incoming work from both the Journal and Barron’s shows the AI data-center program is constrained by transformer and power bottlenecks and is being financed with a growing mix of public bonds, private loans, and securitized structures. That mix has already pushed credit-default protection on prominent hyperscaler-adjacent borrowers sharply wider since September, and sell-side houses are openly discussing hundreds of billions in AI-linked IG issuance over the coming year. In plain English: the cash flow to service this build arrives later than the funding, so the carry cost matters; when the market doubts that bridge, equity volatility rises and credit leads.
Within that context, the S&P 500 and Dow Jones remain buys on disorder, not on green candles. The tactical equity trade is to fade spikes in real yields that are not backed by fresh “hot” data and to sell strength into hawkish repricings that are not corroborated by the incoming labor prints. The near-term policy setup is explicitly data-dependent, with the Fed signaling that every meeting is “live” while emphasizing that the bar for easing isn’t met simply by forward-looking narratives around AI productivity. Odds for a December move have already reset lower, and that alone limits the multiple expansion argument unless we get a clean growth-without-inflation surprise in the resumed releases.
For gold (XAUUSD), the near-term playbook is constructive on dips. The metal has been rising alongside, not opposite, parts of the rates complex, classic late-cycle behavior when investors want both duration-light hedges and convexity against “fat-tail” policy mistakes. Weekly market color shows gold advancing even as 10-year yields ticked up, which is consistent with demand for balance-sheet insurance into a bumpy capex-and-credit regime and with lingering geopolitical risk premia. As long as the Fed is jawboning optionality rather than locking in a rapid cutting cycle, the dollar can stay firm while gold still works as a crash-hedge, producing the counterintuitive positive correlation witnessed in recent weeks.
For the dollar (DXY) and USDJPY, the skew remains to modest dollar strength into the Nov. 20 jobs data and the December FOMC, for the same reason equity multiples face resistance: the market has walked back the certainty of a near-term cut. With front-end U.S. rates repriced a touch higher and Japanese policy still characterized by gradualism, USDJPY dips are likely to be shallow unless we see an explicit shift in BoJ guidance or an outsized U.S. labor miss. The policy-news asymmetry is simple: a soft U.S. payrolls resumption that drags down cut odds is dollar-positive; an upside surprise in unemployment or downside surprise in earnings would break that. I would pair any USDJPY longs with tight risk to a sustained drop in U.S. rate-cut odds and watch DXY’s reaction around the Fed-sensitive headlines.
On crude, the path of least resistance is sideways-to-higher volatility with a mild upward bias into year-end. The OPEC+ decision to pause planned hikes arrived just as positioning had been leaning to surplus narratives, delivering a supply-side floor without guaranteeing a trend. A prudent stance is to buy front-month weakness that originates in growth-fear headlines but is not validated by inventory data, and to lighten up when the move turns into a blanket “risk-off” dollar surge. Importantly, the AI-build energy bottlenecks and transformer shortages are not just capex trivia; they micro-transmit into the gas-power-oil complex via higher peaking-plant utilization and slower time-to-power for new capacity, which reinforces the idea that near-term dips in fossil-energy can be transitory if demand surprises.
For “Big Tech vs. the tape,” respect the two-sidedness. Investors are plainly anxious: depreciation schedules have been lengthened to five-to-six years for data-center gear, which flatters near-term EPS but loads future expense, while vendor hiccups can derail ramp schedules and spark sharp de-ratings in the “neoclouds.” At the same time, the aggregate capex and balance-sheet strength of the incumbents, plus their access to cheap credit, argues against a 2000-style cascade, more like a digestion phase with higher day-to-day beta. Until the first clean tranche of AI revenue scale arrives outside advertising and developer tools, the market will treat capex beats as “show me” and sell any sign of financing complexity. That’s a trading environment, not an allocation one: sell rips in crowded AI-plumbing names into credit-spread widening, and add on disorder when spreads tighten.
Politically and fiscally, keep one eye on trade and one on the “tariff dividend” discourse. A partial U.S.–China de-escalation has already knocked worst-case scenarios off the table for markets by trimming reciprocal tariff rates and shelving some blacklist expansions; the mechanical effect is to lift sentiment for exporters and relieve margin anxiety along exposed supply chains. In parallel, Washington’s discussion of recycling tariff revenue into household checks (“tariff dividends”) remains an explicit policy variable that can backstop consumption optics if needed. The first narrows left-tail geopolitical risk; the second cushions growth optics if the data disappoint in Q4-Q1. For cross-asset risk, both reduce the probability that a growth wobble turns into an equity-credit spiral.
For your Warsaw-based book, the European addendum is straightforward. A measured thaw in U.S.–China tensions plus stronger U.S. data releases is a tailwind to Europe’s external demand and to Germany-centric value chains in CEE. EU exports to the U.S. already showed a powerful rebound into late summer, with autos, industrial equipment, and electronics driving the bounce; that favors Poland’s manufacturing corridor via order-book pass-through and supports PLN on current-account optics, all else equal. Against that, European growth remains uneven and rate-cut timing is less market-convincing than headlines imply, so I would express the European risk as relative value rather than outright beta: e.g., long DAX vs. a U.S. cyclicals basket on tariff-relief headlines, long EURPLN on strong German PMI prints, and selectively long WIG20 components with U.S. end-demand exposure.
Putting it all together for the named assets: XAUUSD is a buy-the-dip convexity hedge while policy remains “optionality-first” and credit jitters percolate; S&P 500 and Dow Jones are range-bound trades with a bias to add on data-induced drawdowns and to trim on rate-repricing rallies; USDJPY and DXY hold a mild long skew into Nov. 20 with tight stops tied to the labor print and any dovish Fed-speak surprise; crude oil is a volatility-premium long on supply-side support and infrastructure bottlenecks; and European cyclicals tied to trans-Atlantic trade deserve a measured bid as long as the détente holds. If the resumed U.S. labor release undershoots sharply or if credit spreads lurch wider on AI-deal complexity, flip the book: take down equity exposure, keep gold, stay long dollar, and press crude only if the move is inventory-validated.
Position-management annex
Between now and the first full slate of delayed U.S. data on Thursday, Nov. 20, I want the book staged light, liquid, and event-optional. The core stance remains: buy disorder, not euphoria, and express policy uncertainty with convex hedges rather than oversized directional bets. I split the playbook into three micro-windows, pre-event (now–Nov. 19), event day (Nov. 20), and follow-through (Nov. 21–Dec policy meetings), and anchor triggers to how the labor print shifts front-end rate expectations and real yields.
For U.S. equities (S&P 500 and Dow), I will only add on weakness that comes with a “cooling but not collapsing” labor mix. If the print shows payrolls in roughly the 50–125k band, unemployment edging up 0.1–0.2pp and average hourly earnings at or below 0.2% m/m, that combination eases near-term cut odds without flashing recession. I buy into the first −0.8% to −1.5% impulse lower on SPX/DJIA, but I scale in over the second hour after the release, not the first five minutes, and I insist on fading any intraday bounce in real yields before committing size. The stop is a daily close below the prior swing low on cash indices; the first profit gate is the fill of the event gap and an implied-vol reversion of roughly 3–4 points from the post-print spike. If instead the print is “hot”, payrolls north of ~200k or wages ≥0.4% m/m, I sell strength into the knee-jerk rally that sometimes follows the headline because the rate path will reprice hawkishly; I cut cyclicals, tighten tech, and immediately layer 1–2-week SPX put spreads (about 3–5% out-of-the-money) sized at ~50 bps of NAV, financed in part by trimming covered calls I keep on high-beta winners. In the genuinely “bad” tail (payrolls <25k and unemployment up ≥0.3pp), I assume a credit-led equity draw: I slash gross, keep only defensive exposure, and pivot to my hedges (see below) rather than trying to catch the first knife.
For gold (XAUUSD), the directive is buy-the-dip convexity while policy remains “optionality-first.” Into Nov. 20 I maintain a core long sized at ~50–60 bps of NAV with room to add another ~40 bps if the dollar pops and real yields jump on a hot print, producing a reflex dip. My add trigger is a retrace toward the 20-day trend anchor or the prior breakout zone (use your platform levels), and I protect the augmented position with a two-to-three-week call-spread overlay (strikes staggered ~1.5–3.0% above spot) so that gold’s “risk-off” upside pays for drawdowns elsewhere without over-spending theta. If we get the “bad labor” tail and real yields sink, I let the core run and harvest half once we’ve reclaimed the event-day high.
For the dollar complex (DXY) and USDJPY, I keep a mild pre-event long-USD skew and make the position event-optional with options. Spot, I prefer to be long USDJPY in small with a stop under last week’s swing low because the asymmetric policy signaling still favors the dollar if the market walks back near-term cut odds. Into the release, I layer inexpensive yen calls (USDJPY puts) one to two weeks out, about 1.5–2.0% out-of-the-money, sized to cover roughly two-thirds of the spot notional; that seagull-like shape caps my topside but pays if the print is soft and the pair slides. If the labor data is “Goldilocks” (cooling wages, okay payrolls), I expect DXY to hold a bid without a trend; I keep the light long and roll protection down a strike. If it’s hot, I add to USDJPY on the first pullback that coincides with U.S. front-end yields re-widening and I trail the stop daily. If it’s bad, I flip: the options do the initial work; I close spot longs and will only re-engage once the curve has bull-steepened and credit is stable for a session.
For crude oil (WTI), I treat the event as volatility, not a regime break. The supply side is intact into year-end, so my bias is to buy weakness that is macro-headline driven but not inventory-validated. Practically, that means I set alerts to add on a fast −2% to −3% flush that coincides with equity and dollar shocks, then I confirm that the move isn’t accompanied by a bearish inventory surprise before scaling. I prefer calendar-month exposure with a slight long-gamma profile; where options liquidity is ample, I run a collar (own the underlying or delta via futures, buy a 2–3-week 4–5% OTM put, finance with a 5–6% OTM call) sized at ~75 bps of NAV. If the labor data is hot and the dollar surges, I expect an initial oil wobble; I add only once the dollar impulse fades intraday. If the data is bad, I fade the first oil rally unless inventories corroborate genuine tightening or geopolitical headlines do the lifting.
On position sizing and aggregate risk, I cap single-asset directional risk at 60 bps of NAV pre-event and 100 bps post-print only after spreads and realized vol normalize. Net equity beta stays ≤0.35 into the release, rising toward ~0.55–0.60 if we get a “cooling but not collapsing” outcome and credit is calm; if it’s hot, beta drops toward ~0.20 and I let the dollar and gold hedges carry. I monitor the 2s/10s and 5y real yield as my macro governors; a persistent post-event rise in real yields alongside wider credit spreads is my cue to cut beta irrespective of index level. I define “wider” as a sustained two-day move that breaches the prior month’s wides on your preferred IG/HY benchmarks, no heroics against credit.
Hedge architecture is simple and deliberate. I keep a “gamma umbrella” worth roughly 1.0–1.2% of NAV spread across weekly SPX 3–5% OTM puts through the data window, refreshed on green closes and harvested into vol spikes. I pair it with a gold call-spread ladder so that part of the umbrella is funded by metal convexity. In FX, I maintain the USDJPY seagull described above; for broader USD risk I prefer EURUSD 1-week strangles when pricing is benign, sized tiny, because they catch both “hot” and “bad” tails when DXY jolts. In crude, the collars serve as both discipline and carry buffer; if the market runs, the foregone topside is a trade-off I accept for balance-sheet stability. If the event turns into a disorderly credit day, I add a short-dated HYG or LQD put spread as a fast hedge rather than dumping core equity at the lows.
Execution discipline matters more than the macro take. I will not buy the first spike lower in equities; I wait for the second test once the first round of systematic flows have fired. I scale in thirds and accept that missing the exact low is cheaper than catching the wrong trend. I never average down in options on event day; I roll or cut. Intraday, my triggers are time-based as well as price-based: I only add risk after both the headline and the key revisions/details (labor force participation, average weekly hours) have crossed and been digested for at least 15 minutes. I do not carry new, sizeable positions unhedged into the weekend while the policy calendar is dense.
For the Europe-centric sleeve you run out of Warsaw, I keep the relative-value tilt that benefits from a modest U.S.–China thaw and stronger U.S. demand without paying full U.S. multiple risk. I am long DAX versus a U.S. cyclicals basket only on tariff-relief-friendly days and only after the labor print has not tightened U.S. financial conditions; the stop is a daily close where DAX underperforms by ~150 bps versus the basket from the event open. In FX, I like EURPLN on any upside surprise in German PMIs that follows the U.S. data week; I enter small with a stop under the most recent local low and I take half off at the first +0.8% move because PLN’s beta to global risk can turn quickly. On the WIG20, I express it through exporters with U.S. end-demand and I cap single-name risk at 40 bps until we clear the December central-bank communications.
Putting it into a single action sequence: I keep gross exposure modest into Wednesday; I widen hedges on green closes; I let the first post-print hour play out; I buy equities and oil only if the mix is “cooling but not collapsing,” and I do it in thirds with stops on daily closes; I hold or add to gold on any rates-induced dip and lock in half on a retest of highs; I keep a small USDJPY long but let the options do the heavy lifting if the dollar breaks; and I reassess beta through the lens of credit and real yields, not just index points. If the data surprises hot, I shift the book quickly toward dollar-positive, equity-light, duration-neutral with fresh SPX protection; if it is bad, I cut gross, keep convexity on, and wait for credit to settle before redeploying.

GOLD I Weekly CLS I Model 2 - Target 50% I Eventually ATH...Hi friends, new range created. As always we are looking for the manipulation in to the key level around the range. Don't forget confirmation switch from manipulation phase to the distribution phase to make the setup valid. Stay patient and enter only after change in order flow. If price reaches 50% of the range take partial or full close.
📌 HTF - Higher Timeframe view
🧩 Complete proces and Strategy explained 👇 Click Below
🎯 Why your market approach also should be mechanical ?
NO Fixed Mechanical Trading Logic - You are guessing random patterns
NO Defined trading plan - Every trade different logic
NO Same logic in each trade - Not possible to backtest
NO Backtests on at least 300 trades - Not knowing Statistics
➡️ No Statistics ➡️ No Edge ➡️ Mindset ProblemS
🧠 Core of mindset problems
If you don't know your statistics on large enough data sample. You don't know your probabilities of win rate once the losing streak happen and it happens to every strategy. You will start doubting, hesitating to take next trade because you don't know statistics of your losses. In the end you will be doubting strategy and then jump to different one. You will be in the endless loop for years, looking for new better strategy. 👊 Your ultimate goal as a trader is not to be a generalist who knows 10 000 patterns. But rather create one system with narrowed criteria of each element of the trade to remove subjective and emotional decisions as much as possible and stick to this system no matter what. Practice it 10 000 times become a MASTER.
✨ Trading Mastery is reflection of your life
Have a longterm plan, No Alcohol & Drugs, Ignore others, Focus on your journey , Backtest regularly, Review your weeks, Journal mistakes, Exercise, Sleep well, Read books, Walks in nature (no phone) , Meditate, Reduce social media time, Spend time with family, Live Life.
Trading is hard, but not impossible. I believe in you 💪
David Perk aka Dave Fx Hunter

Seeing What Price Alone Can’t Show: The Power of Volume ProfileElements of a Volume Profile
The Volume Profile is a powerful charting tool that shows how trading volume is distributed across different price levels.
While normal volume bars appear below the chart showing activity per candle, the Volume Profile appears horizontally on the price scale, showing where most buying and selling took place.
It helps traders understand which price levels attracted the most interest, and where the market might find support or resistance in the future.
Price and Volume Relationship
The core idea of a Volume Profile is that price levels with high volume indicate fair value zones, where both buyers and sellers agree on a price.
On the other hand, low-volume areas indicate rejection zones, where price moved quickly because there was little interest to trade there.
Value Area (VA)
This is one of the most important parts of the profile.
The Value Area represents the range of price where approximately 70% of total trading volume occurred during a selected period.
Value Area High (VAH): The upper boundary of the value area.
→ Above this level, price is considered expensive or overvalued.
Value Area Low (VAL): The lower boundary of the value area.
→ Below this level, price is considered cheap or undervalued.
When price sustains out of the value area, it often indicates that new momentum or trend activity is beginning.
Point of Control (POC)
The POC is the price level with the highest traded volume within the profile.
It represents the price where the market spent the most time and volume. The level often acts as a magnet for future price movements.
Traders watch this level closely as it often becomes a strong support or resistance zone.
High Volume Nodes (HVN)
These are thick areas on the Volume Profile, showing where the market traded heavily (less than POC)
They indicate acceptance zones that is, the price levels where many transactions happened because buyers and sellers agreed on value.
When price returns to an HVN, it often pauses or consolidates before choosing direction again
Low Volume Nodes (LVN)
These are thin or narrow areas on the profile where very little trading occurred.
They mark rejection zones that is, the areas where price moved quickly without much interest.
When price approaches an LVN, it often moves rapidly through it again, because there is less resistance.
Profile Shapes
The overall shape of the Volume Profile also tells a story about market behavior:
D-shaped Profile: Balanced market - fair value established (typical during consolidation).
P-shaped Profile: Short-covering rally - bullish bias
b-shaped Profile: Long liquidation - bearish bias
Double Distribution: Two separate areas of interest - potential trend continuation.
For more on Volume Profile shapes refer
Key Takeaways
The Volume Profile helps traders see where the market traded most heavily at each price level.
Key elements such as the Value Area, POC, High and Low Volume Nodes, and profile shape reveal how the market perceives value and interest.
Understanding these elements helps traders identify strong support/resistance zones, potential breakout areas, and market balance or imbalance situations.
Do you use Volume Profile in your trading? Share your thoughts in the comments below!

XAUUSD – H2 & H4 Technical Breakdown📌 H2 Chart (Left) – Short-Term Retracement
H2 maintains a clean bearish structure with lower highs along the descending trendline.
Price broke short-term support and is now retracing into a liquidity area at 4,050–4,065.
Expectation: a small liquidity grab → continuation lower.
➡️ Bias: SELL on retracement
➡️ Targets: 4,000 → 3,985
📌 H4 Chart (Right) – Bearish Continuation
H4 confirms a higher timeframe bearish trend after the CHoCH around 4,130.
The Liquidity Zone 4,062–4,082 aligns with trendline resistance.
This zone is likely to produce a rejection for the next push down towards HTF liquidity.
➡️ HTF Target: 3,965 – 3,980
🎯 SPHYN Final Bias
🔻 Overall Bias: Bearish
🔻 Optimal SELL zone: 4,060–4,082
🔻 Main Target: 3,965

QuyetP | Gold Just Flippep - 3900 in SightTVC:GOLD ’s tone changed fast — and flipping bearish wasn’t optional, it was necessary.
DXY holding above 103.5 keeps pressure on anything anti-USD, and gold is reacting cleanly to that.
Short-term yields picked up ~8bps, enough to kill any shallow bounce gold tried to build.
Liquidity sits around 3900, and with momentum fading, the market usually moves toward the cleanest pool.
Bias stays down until price shows real defense.
No hero moves — just following the flow.
Anyone else seeing how forced those recent gold bounces look?
Check last post:

Gold’s Next Rebound May Break 4100 for 4120-4140 RangeCurrently, gold’s attempt to break through 4100 has failed, and it has pulled back to around 4080. If it rebounds again, it will most likely break through 4100 directly and fluctuate within the 4120 - 4140 trading range
Accurate signals updated daily. They serve as a reliable guide for trading issues – feel free to refer to them. Hope they help!

How to properly seize gold trading opportunities?Gold Technical Analysis: Reviewing yesterday's gold price performance, it showed a clear downward trend overall. Specifically, the gold price moved downwards along the five-day moving average. This trend often suggests a short-term weak market from a technical analysis perspective. During the US session, the gold price experienced a significant decline, which undoubtedly exacerbated the tense atmosphere in the market.
From the daily chart analysis, gold closed yesterday with a medium-sized bearish candlestick with upper and lower shadows. This candlestick pattern contains a wealth of market information. The presence of the upper and lower shadows indicates that both the bulls and bears exerted their strength briefly during the struggle, but ultimately the bears prevailed, pushing the price lower and closing with a bearish candlestick. This forms a "three-day losing streak" pattern on the daily chart, indicating a short-term weak trend. From a trend perspective, the bearish pattern in the gold market remains unchanged.
Based on the above technical analysis and market trends, we can make a reasonable prediction for the future price movement of gold. We expect the price to further test the support level of the daily chart's lower trendline. Therefore, our trading strategy for today remains unchanged: shorting on rallies. Specifically, we will focus on the 10-day moving average as our entry point for shorting. On the downside, we will first look at yesterday's low. If the price breaks below yesterday's low, we can expect it to fall further. Taking into account various factors, we have identified the following specific resistance and support levels. The resistance levels are 4050-4070 and 4100, respectively. These levels have historically exerted downward pressure on prices and are key resistance areas that we need to pay close attention to during trading. The support levels are 4005-3980 and 3930, respectively. These levels are crucial points where prices may find support and rebound. Regarding trading recommendations, we suggest entering short positions in the 4050-4070 range. It is important to note that the market is fraught with uncertainty and risk, and the above trading strategy is for reference only. When making investment decisions, investors should fully consider their own risk tolerance and investment goals, and make decisions prudently. We hope every investor can have good luck in the market and achieve their investment goals. In summary, today's gold trading strategy is to primarily sell on rallies and secondarily buy on dips. The key resistance level to watch in the short term is 4050-4070, and the key support level is 4005-3980. Please keep up with the pace.

XAUUSD in rangbound At moment market is in rangbound from 4030-4080 area rejected multiple times .
What are my conditions For Today's setup?
-I’m watching for a buy trade at 4030-4040 zone and my target remains 4080 then 4120 in extension.
Secondly if H4 closed below 4025 then market will test 3975-3985.
Unmute FOREXLAB for 24/7 updates

XAUUSD Next Week Bull/Bears?The results of the analysis on xauusd, using ICT strategy.Please note: This is just an illustration.Trade according to your analysis and research Use good risk management

XAUUSD Trapping sellers & BuyersXAUUSD is bearish on short term although my stance are only buy the Dips till New ATH.
What are my conditions For This setup?
- 1st buying area will be 3975-4085 and target will be 4130 & 4145
CONDITION:
H4 candle closing should be above 3980 for long.
Second if H4 closed above 4045 then also my POI buy will there.
My Target will be 4130 & 4145.

XAUUSD Bullish Retracement Setup from Support Zone Toward Key Re1. Market Structure
Price is currently trading near a major support zone (~4055–4060 area), highlighted in blue.
Multiple rejections from this zone in the past indicate strong buying interest.
The structure shows higher lows forming intraday, suggesting bullish pressure building.
2. Key Zones
🔵 Support Zone (Entry Region)
Marked around 4055–4060.
Price dipped into this zone and bounced, showing a potential demand area for long positions.
🔵 Resistance Level (First Target Region)
Around 4081–4098.
This is the first major resistance the price is likely to test after bouncing.
🔵 Final Target Zone
4120 area, the upper major resistance.
Previous highs around this level show strong selling interest historically.
3. Expected Price Movement
The chart suggests a potential bullish move:
Price bounces from the support (entry) area.
Climbs toward 4081 (minor resistance).
Retraces slightly.
Continues upward toward 4097–4100.
Final push toward 4120 target zone.
This is a classic retracement + continuation bullish structure.
4. Trade Idea
Bias: Bullish
Entry: 4055–4060 (support zone)
First TP: 4081
Second TP: 4097–4100
Final Target: 4120
Stop Loss: Below 4050 (beneath support zone)

Gold Prices May Fall to $4,000Gold Prices May Fall to $4,000
Chart Analysis: Gold prices tested the $4,050 support level, a key price level distinguishing bullish and bearish trends.
A break below this level could lead to another significant drop in gold prices.
Strategy:
Sell: $4,080-$4,090
Stop Loss: $4,110
Take Profit: $4,050-$4,015-$4,000
Avoid going long today.
The strategy remains the same as yesterday: treat this as an opportunity to short at higher levels. If you haven't made money, contact me.

QuyetP | XAUUSD Rises on Point — Waiting for the Key LevelTVC:GOLD ’s move up wasn’t noise — it lined up with the broader market tone.
U.S. real yields dipped again this week (10y TIPS down ~4 bps), and that almost always gives gold a little oxygen to breathe.
TVC:DXY also stalled under 104.5, not breaking higher, which removes short-term pressure on XAUUSD.
And yeah… the inverse head & shoulders played out clean. Not explosive, but directional. Real.
Now I’m watching how price reacts at $4k1. That zone matters because that zone last shown the equal strength of buyers n sellers. If buyers step in with conviction, the move continues. If they hesitate… then waiting is the smarter trade.
We’re traders, not prophets.
Chart goes first — we react after.
See the previous analysis in the link below.

4067 or 4093 drop to 40114067 or 4093 drop to 4011
just a concept to retest 2 red candle zone on 1h TF
Looks like retracing up always depends on 1H candle

XAU/USD Near Breakdown – Bears Eying Liquidity SweepGold remains under pressure after a stronger-than-expected NFP print reduced near-term Fed rate-cut expectations.
The USD stays moderately supported, while weak risk sentiment keeps gold in a cautious, defensive phase.
📊 Technical Snapshot (H1–M30)
Price continues to reject the descending trendline and the supply zone 4,054–4,078.
Lower highs structure intact → bearish momentum remains dominant.
Liquidity pockets sit at 4,013 and especially 3,989, a key downside magnet.
Any pullback toward 4,054 is likely just a retest before continuation lower.
🎯 MMF Intraday Plan
Primary Bias: SELL – follow the trend
Sell 4,054–4,078
SL: 4,090
TP: 4,013 → 3,989 → 3,975
Countertrend BUY (only at deep liquidity):
Buy 3,985–3,990
SL: 3,972
TP: 4,013 → 4,054
⚡️ MMF View
As long as price stays below the trendline and lower-high structure, gold remains in distribution.
A sweep of the 3,99x liquidity zone is highly likely before any meaningful reversal can form.
