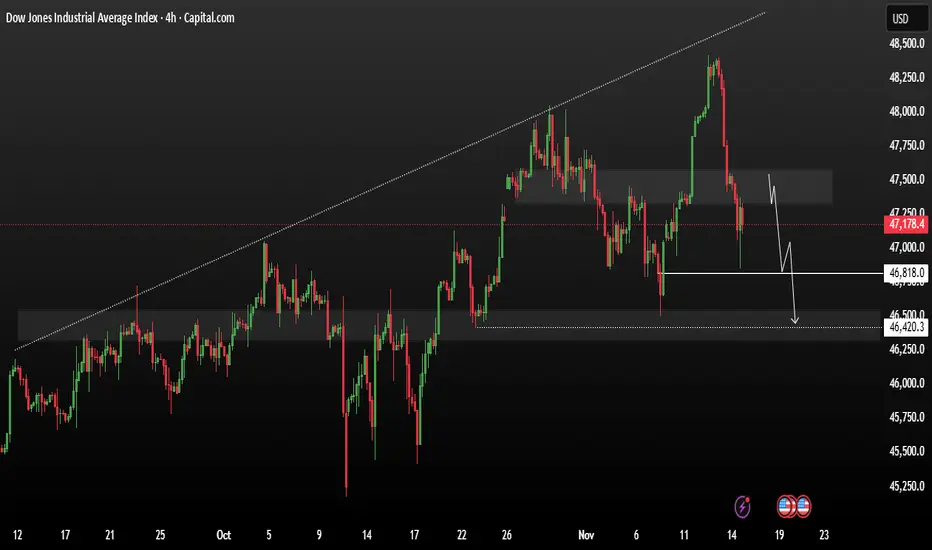
US30 remains in a bearish trend toward support levels.US30 remains in a bearish trend. The price may first retest a resistance zone, but unless there is a confirmed bullish breakout, the expectation is for another decline toward support levels.
From a market sentiment perspective, U.S. indices closed mixed on Friday as investors look ahead to Nvidia’s upcoming earnings release next week and remain cautious due to concerns that the Federal Reserve may delay cutting interest rates in December.
If price fails to hold above 47,500 and closes below resistance and price move to downside and there potentially target point will be 46,818 to 46,420
You may find more details in the chart,
Trade wisely best of Luck.
Ps; Support with like and comments for better analysis Thanks for Supporting.
Trade ideas
Dow jonesChart is self evident but let me explain.
Top of weekly channel 5yr resistance
(YELLOW)
Top of tariff rebound channel
(WHITE)
Outside weekly and daily bollingerband
Basically we are at extreme resistances really overbought.. imagine trying to break through something while being low on fuel.
The candle pattern " 3 white soilders" from the bullflag breakout has played out. The 4th candle usually completes the sequence
So now I think this is a channel trade and we head back to support 50sma or 47,000
From there if we lose 47,000 or 50sma then we head back to 44,900
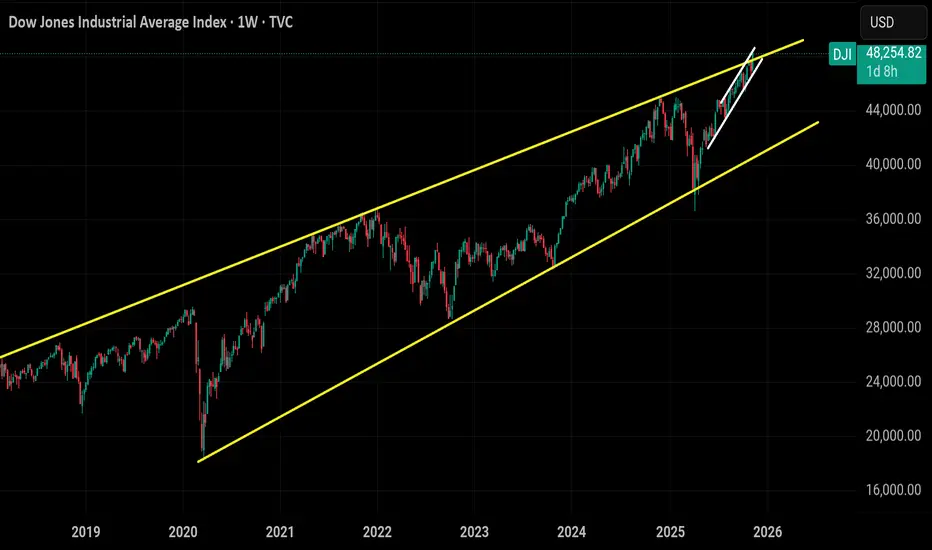
DOW JONES Will the 1D MA100 save the day?Dow Jones (DJI) has been trading within a 6-month Channel Up and in the past 4 days it has been correcting on its latest Bearish Leg. By doing so, it broke below the 1D MA50 (blue trend-line) and is approaching the 1D MA100 (green trend-line) right at the bottom of the pattern.
This is the Channel's last Support. As long as it closes the daily candles above it, we will be bullish on Dow, targeting 49000, which represents a +7.25% rise, something all previous 3 Bullish Legs did.
---
** Please LIKE 👍, FOLLOW ✅, SHARE 🙌 and COMMENT ✍ if you enjoy this idea! Also share your ideas and charts in the comments section below! This is best way to keep it relevant, support us, keep the content here free and allow the idea to reach as many people as possible. **
---
💸💸💸💸💸💸
👇 👇 👇 👇 👇 👇

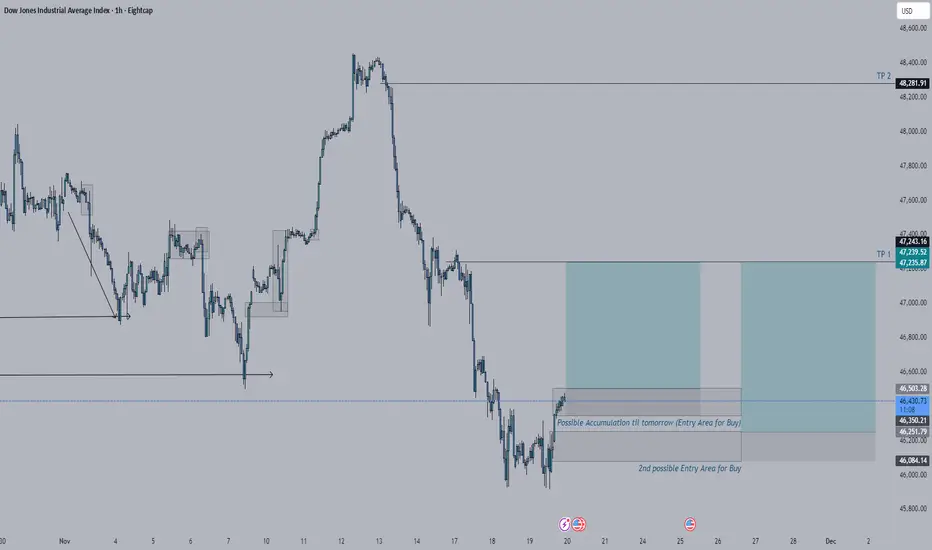
US30 Bullish MovementI'm biased for buy on US30. I have 2 area that I'm watching for entry but I think the market will just be accumulating in one area make a bit of a push to the downside within the area where it is currently accumulating then continue to push the market tomorrow. For TP, I'm actually eyeing more in the TP 2 but there will be going to be a reaction around the TP 1 that will be something to look at for another entry for buy.
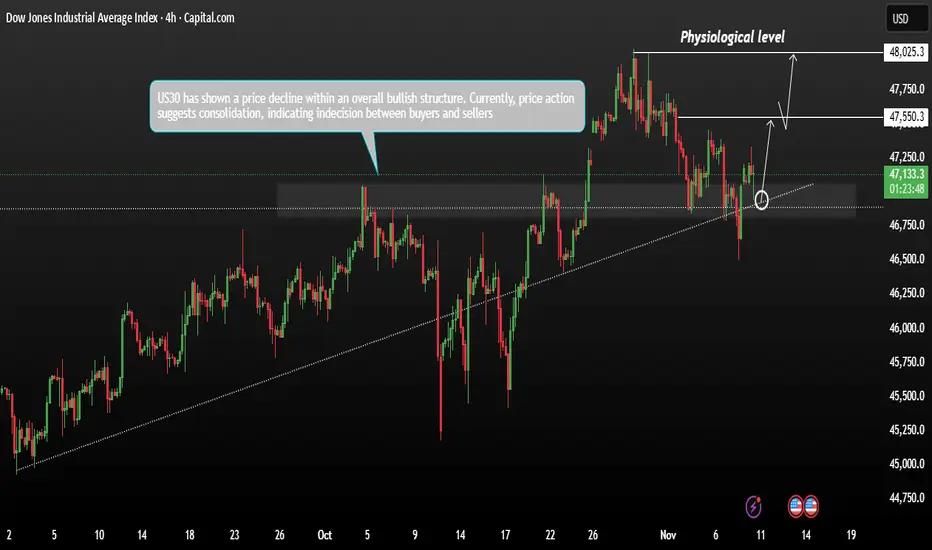
US30 Price decline within an overall bullish structureUS30 has shown a price decline within an overall bullish structure. Currently, price action suggests consolidation, indicating indecision between buyers and sellers. the index has pulled back but remains above key support zones, suggesting the potential for a rebound toward recent swing-high resistance levels.
If bulls maintain control, a continuation of the uptrend could follow after this consolidation phase. However, if momentum weakens, a deeper retracement could occur before any sustainable upside move resumes then Next expected target would be 47,550 to 48,025 lets see and how does price should react.
You may find more details in the chart,
Trade wisely best of Luck Buddies.
Ps; Support with like and comments for better analysis Thanks for Supporting.
Dow Weakens Under Key Resistance | Sellers in ControlUS30 | Overview
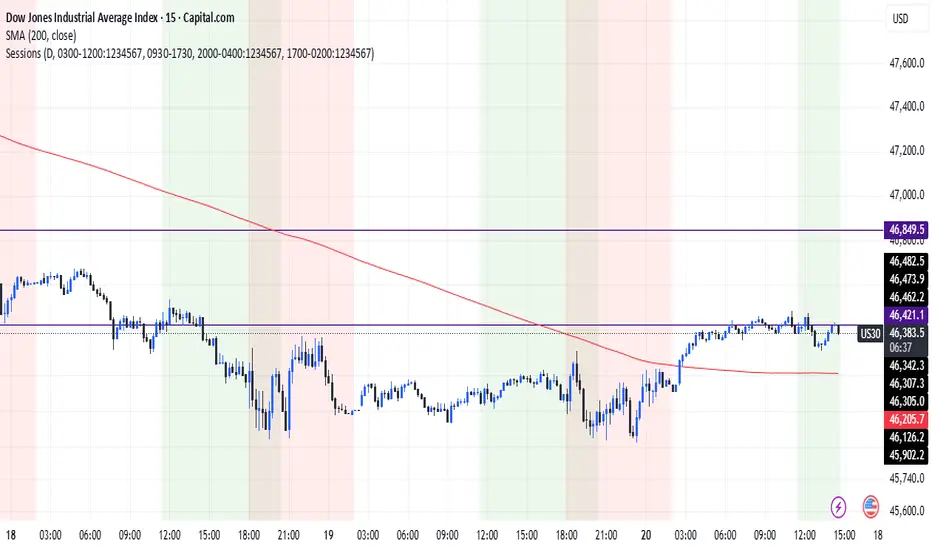
The Dow Jones maintains a bearish trend while trading below 46410, with momentum favoring a move toward 46000, and a further decline toward 45680 if that level breaks.
A bullish recovery will only be possible if the price closes above 46600, which would open the path toward 46920.
Key Levels
Pivot Line: 46410
Support: 46000 · 45800 · 45290
Resistance: 46600 · 46910
Outlook:
US30 remains bearish while below 46410, targeting 46000–45680.
A confirmed break above 46600 would shift momentum toward 46920.

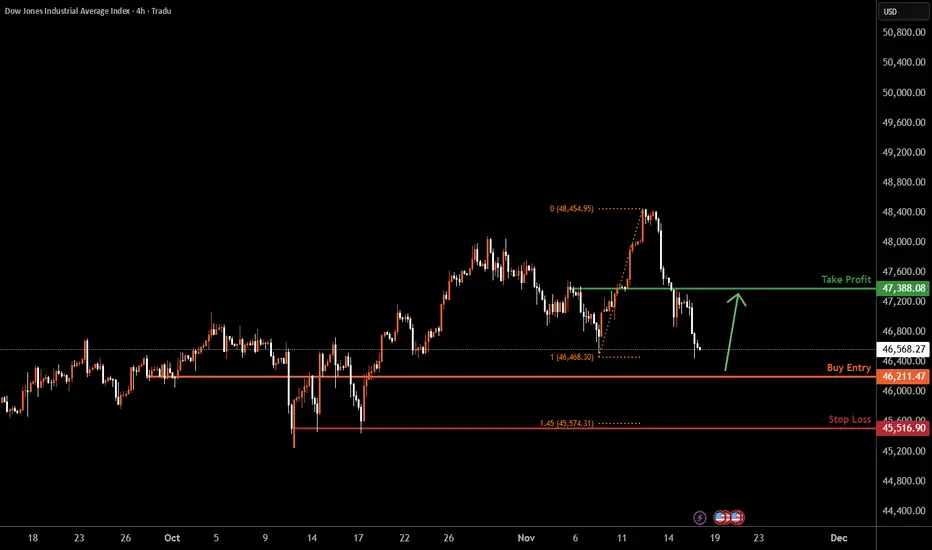
US30 H4 | Bullish Reversal SetupMomentum: Bullish
The price is currently retracing toward the buy entry, which aligns with a key pullback support level.
Buy Entry: 46,211.47
Pullback support
Stop Loss: 45,516.00
Multi swing-low support
145% Fibonacci extension
Take Profit: 47,388.08
Pullback resistance
High Risk Investment Warning
Stratos Markets Limited (tradu.com ), Stratos Europe Ltd (tradu.com ):
CFDs are complex instruments and come with a high risk of losing money rapidly due to leverage. 70% of retail investor accounts lose money when trading CFDs with this provider. You should consider whether you understand how CFDs work and whether you can afford to take the high risk of losing your money.
Stratos Global LLC (tradu.com ): Losses can exceed deposits.
Please be advised that the information presented on TradingView is provided to Tradu (‘Company’, ‘we’) by a third-party provider (‘TFA Global Pte Ltd’). Please be reminded that you are solely responsible for the trading decisions on your account. Any information and/or content is intended entirely for research, educational and informational purposes only and does not constitute investment or consultation advice or investment strategy. The information is not tailored to the investment needs of any specific person and therefore does not involve a consideration of any of the investment objectives, financial situation or needs of any viewer that may receive it. Past performance is not a reliable indicator of future results. Actual results may differ materially from those anticipated in forward-looking or past performance statements. We assume no liability as to the accuracy or completeness of any of the information and/or content provided herein and the Company cannot be held responsible for any omission, mistake nor for any loss or damage including without limitation to any loss of profit which may arise from reliance on any information supplied by TFA Global Pte Ltd.
US30: Growth & Bullish Continuation
The price of US30 will most likely increase soon enough, due to the demand beginning to exceed supply which we can see by looking at the chart of the pair.
Disclosure: I am part of Trade Nation's Influencer program and receive a monthly fee for using their TradingView charts in my analysis.
❤️ Please, support our work with like & comment! ❤️

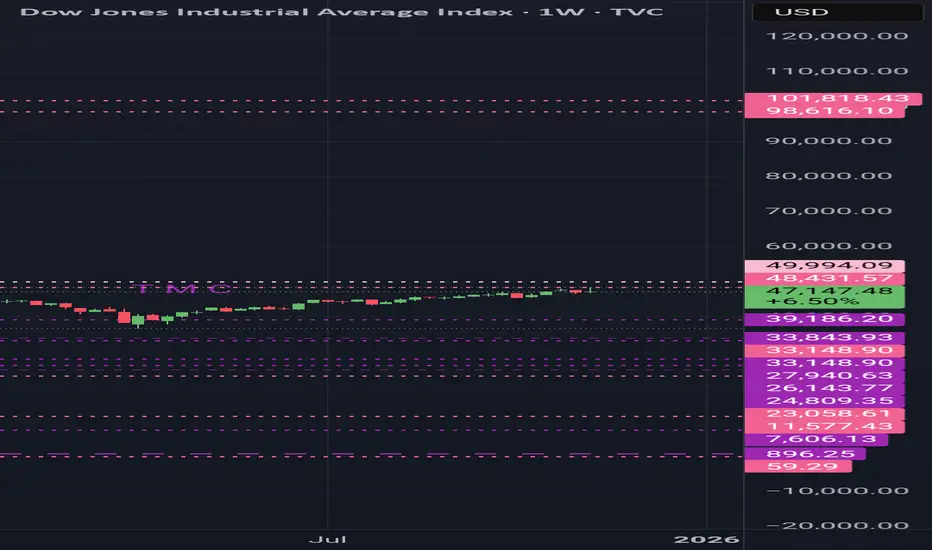
DECODED Technical Analysis DJI (DOW JONES)DECODED Technical Analysis DJI (DOW JONES)
What a remarkable historical chart
DJI, in its yearly first complete grand pattern, faces strong resistance at $48,431, the previous high, and $49,994, signaling a potential reversal. If not, corrections are at $33,843, $33,148, $27,940, $26,143, and $24,144
If the pattern restores, it could continue to test resistance at $98,616 and $101,818, completing its cycle in 2030/2031.
Lowest skip supports are at $23,000, $11,570, $1,210, and $59. These act like missing pillars; if price moves above them without testing, the structure becomes unstable, and sooner or later, the market will return to test them.
This message is for educational purposes only.
Always DYOR.
The Anatomy of a Good Trade: Focus on Decisions, Not ResultsLet's find out - what is a good trade?
Most beginners answer: a trade that makes money.
But in professional trading, a good trade has nothing to do with the outcome.
It has everything to do with the quality of the decision.
1️⃣ A good trade starts with an A-Setup:
An A-Setup is not a feeling — it’s a repeatable pattern with structure and logic.
✔ Clear market context
✔ Direction aligned with market structure
✔ Liquidity levels identified
✔ Entry trigger confirmed
✔ Risk defined before the trade
If one of these is missing, it’s no longer an A-Setup — it’s hope.
2️⃣ A good trade has positive expectancy:
Winning one trade means nothing. Winning a sample size of 100 tells you everything.
A positive expectancy means your setup:
loses small - wins bigger - and performs consistently over time
You don’t need to win every trade — you need a system where the average outcome is in your favor.
3️⃣ A good trade follows process, not emotion:
A professional doesn’t judge a trade by profit or loss. They judge it by one question:
“Did I execute my plan without breaking the rules?”
If yes → it was a good trade. Even if it ended in a loss.
Because long-term success comes from repeatable behavior, not from chasing single outcomes.
The Truth:
➡️ A good trade is not defined by green or red.
➡️ A good trade is defined by discipline, structure, and execution.
If beginners understood this idea, half of their frustration would disappear.
Thanks for reading, and have a great start to your trading week!
Let us know in the comments if you found this post valuable - and we might create a full series on applied trading psychology.
Jonas Lumpp
Speechless Trading
Disclaimer: This tutorial is for educational purposes only and does not constitute financial advice. Its goal is to help traders develop a professional mindset, improve risk management, and make more structured trading decisions.
Is a Market Correction Coming? 10 Warning Signs You Can’t Ignore🚨 Markets look euphoric… but data says otherwise.
Hello @TradingView users, hope you are doing well
Here are 10 reasons why we think a sharp pullback could be near
(Not financial advice — just signals stacking up.)
1) Record yield-curve inversion: The 10y–2y spread was negative for a record ~783 days before ending in Sept 2024; such inversions have preceded every U.S. recession in recent decades.
2) Q1 2025 GDP dipped, Q2 rebounded: BEA shows real GDP fell in Q1 2025 (revised −0.6%), then rose +3.8% in Q2 2025. One more weak quarter would meet the “technical” definition, but Q2 strength complicates that path.
3) Cuts usually come with stress: Markets are pressuring the Fed to cut; historically, rate-cut cycles often start when growth/inflation risks tilt weaker (not typically in “booming” conditions).
4) LEI turned down again: After a tiny July uptick, the Conference Board’s LEI fell −0.5% in Aug 2025 and is −2.8% over the last 6 months, pointing to softer momentum (the “15+ straight months” stat is no longer current).
5) Valuations are stretched: The Shiller CAPE > 40, the highest since the dot-com era—historically linked to weaker forward returns.
6) Labor market showing cracks at the margin: Unemployment ~4.3% (Aug 2025) and job openings ~7.2M (Aug)—down from the 2022 peak—suggest some cooling, even if not severe. (I removed the unsourced “+35% layoffs” figure.)
7) Buffett’s record cash: Berkshire now holds roughly $381–$382B in cash & T-bills, an all-time high—interpreted by many as “waiting for better prices.” (Replaces the older $347.7B figure.)
8) Government shutdown risk/drag: The U.S. is in a prolonged federal shutdown (30+ days), with credible estimates of a material GDP hit if it persists—an added macro headwind.
9) Parabolic leaders, dot-com déjà vu vibes: Today’s rally is narrow and AI-led, and valuation gauges echo late-1990s extremes—a setup that can amplify drawdown risk on disappointments.
markets.businessinsider.com
10) Clustering of risks: Yield-curve history + LEI weakness + stretched valuations + policy uncertainty = elevated correction risk, even if timing is uncertain.
Please be cautious, more signals are starting to align, suggesting a potential market drop. From Warren Buffett holding significantly more cash, to the ongoing government shutdown, and even the recent sharp rally that mirrors patterns seen right before the dot-com bubble, the puzzle pieces are starting to fit together.
This message isn’t to cause panic, but rather to remind you to trade carefully and stay prepared either by keeping some cash ready to invest if the market drops, or by simply sticking to your existing long-term investment plan if you have any.
Comment below what YOU think, is this a healthy dip incoming or the start of something bigger?
@TradingView Appreciate it if you guys can feature this post so more traders and investors get the warning and stay safe if the drop happens.
Thank you
Alain M(Coach)
WTW Team
NYSE:DOW NASDAQ:NDX SP:SPX

DOW JONES INDEX GOES 'CUP AND HANDLE' PATTERN. HERE'S WHYA cup and handle is a bullish technical analysis pattern that signals a continuation of an uptrend and a potential buying opportunity. It appears as a U-shape (cup), followed by a slight decline or consolidation (handle), after which further price gains are expected. The pattern was popularized by William O'Neil in 1988.
Cup and Handle
Cup: A U-shaped movement that forms when an asset's price, after a rally, initially pulls back and then recovers to its previous highs.
Handle: After completing the cup, a slight correction or consolidation occurs, appearing as a downward-sloping line, sometimes shaped like a small cup. The handle typically forms on lower trading volume.
How it works
Buy: Traders look for a breakout from the handle amid rising trading volume, which is considered a buy signal. Trend Continuation: The pattern indicates that after a short pause, the asset is likely to continue its upward movement.
Target Calculation: The target price is often calculated by measuring the cup height and adding it to the breakout price to forecast the potential price movement.
What to Consider
The pattern can form on various timeframes, from intraday to monthly charts.
It is important to pay attention to the depth of the cup and handle, as well as the trading volume that confirms the signal.
Due to nearly 50% retrace we consider to take it up rn.
--
Best wishes,
@PandorraResearch Team

Dow Jones - Looking To Sell Pullbacks In The Short TermH1 - Strong bearish move.
No opposite signs.
Expecting bearish continuation until the two Fibonacci resistance zones hold.
If you enjoy this idea, don’t forget to LIKE 👍, FOLLOW ✅, SHARE 🙌, and COMMENT ✍! Drop your thoughts and charts below to keep the discussion going. Your support helps keep this content free and reach more people! 🚀
-------------------------------------------------------------------------------------------------------------------

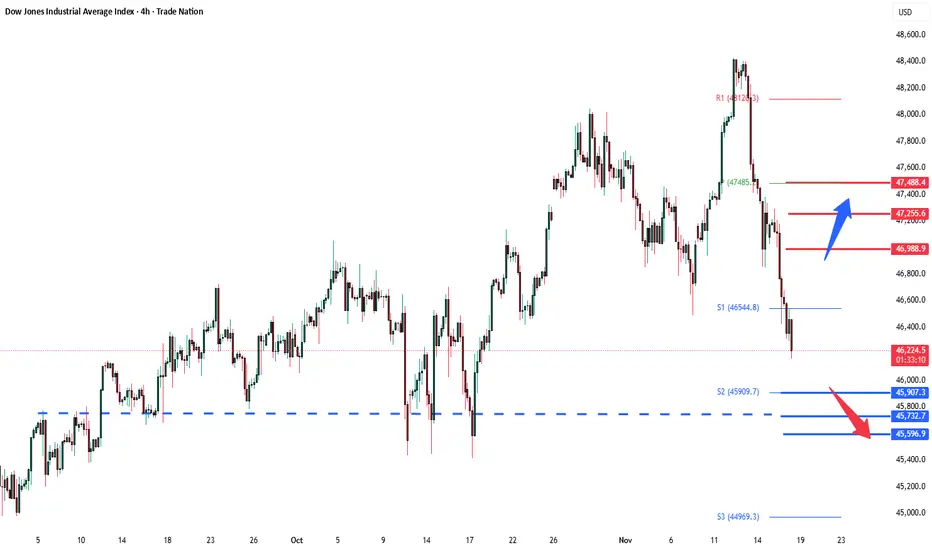
DowJones Key Trading LevelsKey Support and Resistance Levels
Resistance Level 1: 46988
Resistance Level 2: 47255
Resistance Level 3: 47488
Support Level 1: 45907
Support Level 2: 45732
Support Level 3: 45600
This communication is for informational purposes only and should not be viewed as any form of recommendation as to a particular course of action or as investment advice. It is not intended as an offer or solicitation for the purchase or sale of any financial instrument or as an official confirmation of any transaction. Opinions, estimates and assumptions expressed herein are made as of the date of this communication and are subject to change without notice. This communication has been prepared based upon information, including market prices, data and other information, believed to be reliable; however, Trade Nation does not warrant its completeness or accuracy. All market prices and market data contained in or attached to this communication are indicative and subject to change without notice.
US30 - Corrective Drop Completed? Next Push Up AheadUS30 has pulled back sharply and is now forming a corrective structure near the lows.
If the current sub-waves continue to align, the next leg could be an impulsive push upward to complete the broader wave pattern. Short-term fluctuations are expected, but the wave structure as a whole still favours an upward continuation once the correction is fully completed.
Disclosure: We are part of Trade Nation's Influencer program and receive a monthly fee for using their TradingView charts in our analysis.

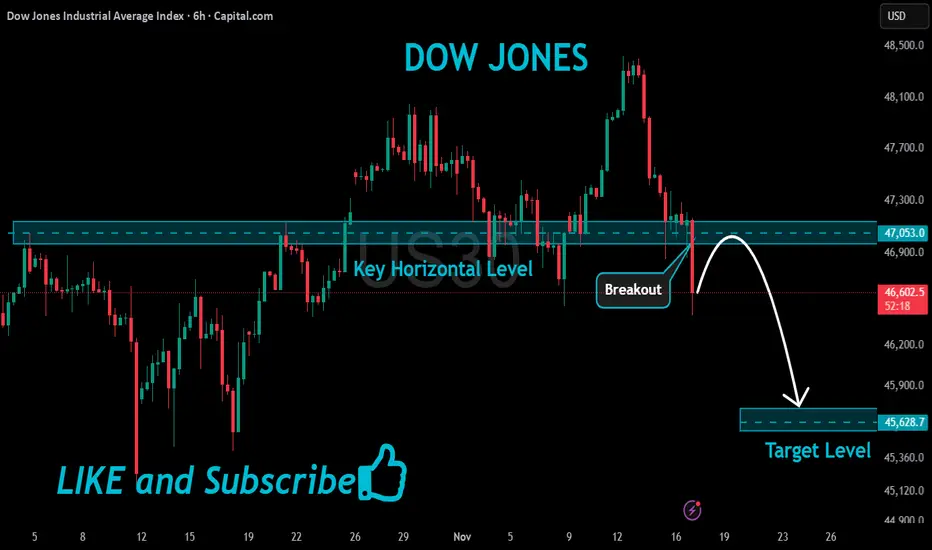
US30 Bearish Breakout!
HI,Traders !
#US30 made a bearish
Breakout of the key horizontal
Level of 47053.0 and the
Breakout is confirmed
So we are bearish biased
And we will be expecting
A further bearish move down !
Comment and subscribe to help us grow !
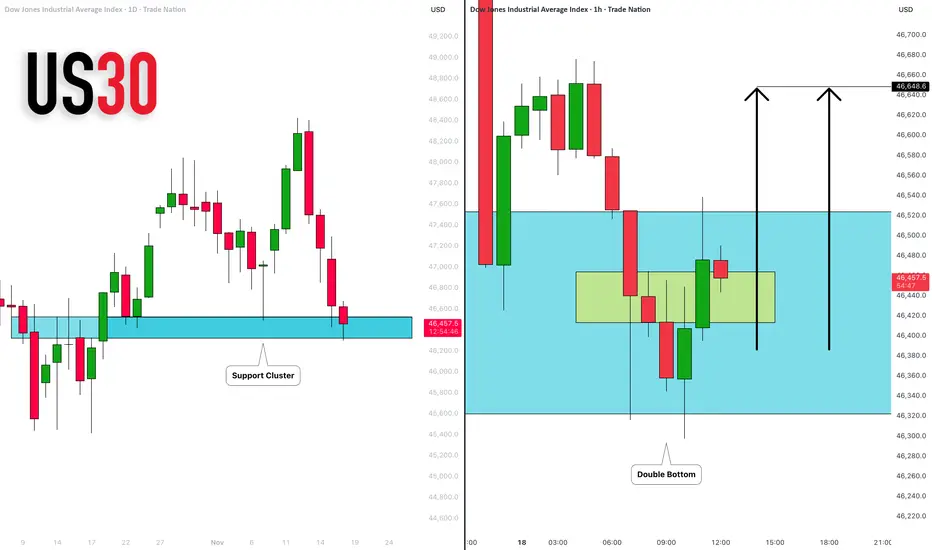
DOW JONES INDEX (US30): Time to Buy?!
It feels like US30 has finally found a bottom.
I see a strong buying interest after a test of a key
historic support cluster.
I anticipate a pullback at least to 46648
❤️Please, support my work with like, thank you!❤️
I am part of Trade Nation's Influencer program and receive a monthly fee for using their TradingView charts in my analysis.
U.S. Futures Slip as Fed Cut Bets Fade | US30 Holds Below 47460US30 | Overview
U.S. Futures Decline as Bets on a December Fed Rate Cut Recede
U.S. indices pulled back as traders scaled back expectations for a Federal Reserve rate cut in December, leading to mild risk-off sentiment across equity markets.
The Dow Jones (US30) continues to trade lower as investors await further economic data to gauge the Fed’s policy trajectory.
Technically:
The price has stabilized below the pivot line at 47460, confirming a bearish bias in the short term.
As long as the index trades below 47460, momentum favors a decline toward 47230 and 47080.
However, a 4H candle close above 47460 would invalidate this view and shift sentiment toward a bullish recovery targeting 47700 and 47850.
Pivot Line: 47460
Resistance: 47570 · 47700 · 47850
Support: 47230 · 47080 · 46920

USS30 BUY WITH LIMIT ORDER!!!!!!US30 Created new highs as my structure highs am looking forward to see price made a minor pull back into my 50% zone and also take out my inducement to my order block zone(47,160 limit order) for a buy.....

US30 - Entry Setups (1H Confirmation for Precision)Entry Setups (1H Confirmation for Precision)
Focus on price-action triggers at key levels. Use 1H for entries, 4H for context. All based on structure—no indicators.
Setup 1: Bullish – Buy the Support Bounce (Preferred, High Probability)
Rationale: Aligns with overall bull trend; 47,346.8 has held multiple times on 4H.
Entry Trigger: 1H bullish reversal candle (e.g., hammer or engulfing) at 47,346.8 (±20 points).
Entry Price: 47,350–47,370 (market or limit).
Stop Loss: 47,280 (below level + buffer; risk ~70 points).
Take Profits:
TP1: 47,523.2 (current 1H close) → +173 points.
TP2: 47,624.7 (prior 4H close) → +274 points.
TP3: 48,000 → +650 points.
Risk:Reward: 1:2.5–1:9.
Confluence: Strong volume on bounce; no 1H close below level.
Invalidation: 1H close <47,346.8 → switch to bearish setup.
Setup 2: Bearish – Short the Breakdown (If Triggered)
Rationale: Confirms short-term weakness if 1H/4H breaks support.
Entry Trigger: 1H close below 47,346.8, followed by retest from below (now resistance).
Entry Price: 47,330–47,340 (on retest rejection).
Stop Loss: 47,420 (above retest high; risk ~80 points).
Take Profits:
TP1: 47,000 → +340 points.
TP2: 46,987.3 → +353 points.
TP3: 46,527.3 → +813 points.
Risk:Reward: 1:4+.
Confluence: Increasing volume on drop; bearish 1H candles (e.g., marubozu).
Invalidation: Price reclaims >47,420 with bullish close → exit and flip long.
Follow me for more updates

IS IT A VALID BREAKOUT RIGHT NOW?Broken strong uptrend is a sign of the bull trend has ended.
I would SELL with SL on the ATH and see how low the bear could go.
CHEEERRRSSS..!!!
