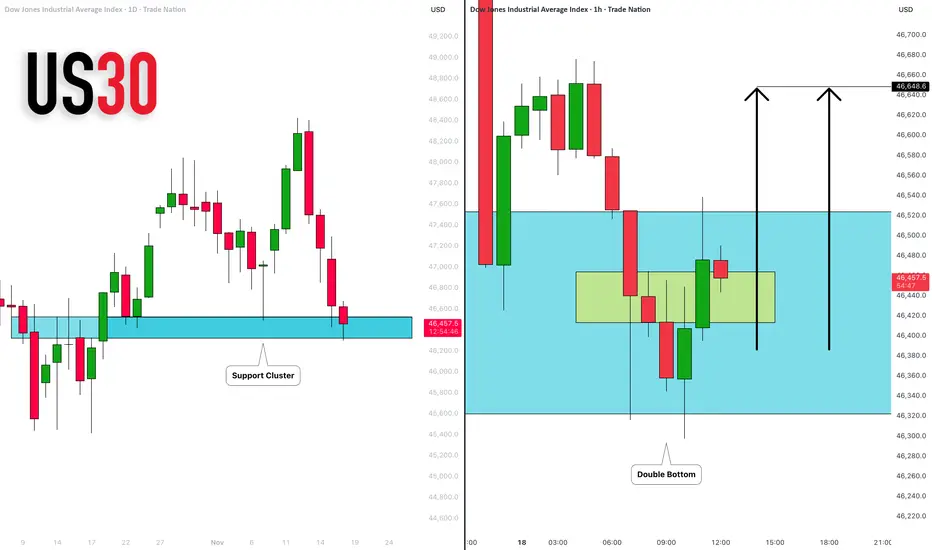
DOW JONES INDEX (US30): Time to Buy?!
It feels like US30 has finally found a bottom.
I see a strong buying interest after a test of a key
historic support cluster.
I anticipate a pullback at least to 46648
❤️Please, support my work with like, thank you!❤️
I am part of Trade Nation's Influencer program and receive a monthly fee for using their TradingView charts in my analysis.
Trade ideas
us30 bullishDow Jones can start its bullish move from 46,411 toward 46,681, keeping in mind the critical level at 46,298. CMCMARKETS:US30

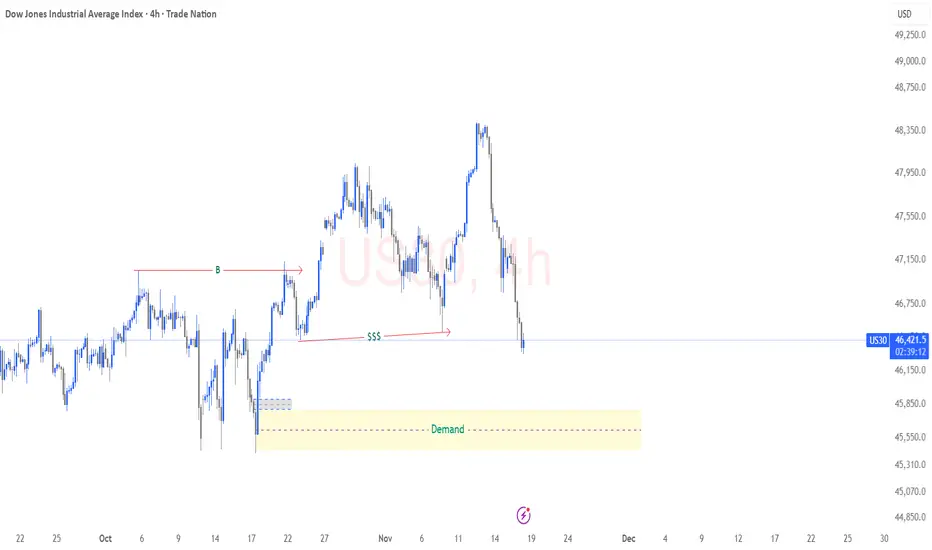
US30 – Potential Buy Setup into Higher-Timeframe Demand 4HPrice has already printed a Break of Structure (BOS), confirming bullish order flow on the 4H timeframe. The current sell-off is corrective, not a trend reversal. As price retraces, it sweeps internal liquidity (SSS) and taps into a strong 4H demand zone – the same zone that caused the BOS.
This area offers discounted pricing for a potential continuation of the bullish move. If lower-timeframe confirmations appear inside the demand zone, we can expect price to rotate upward and target the imbalance and highs left above.
A value-driven buy: wait for confirmation, then aim for bullish continuation in line with the structural bias.
Bull US30We have the HL arround price level 46,952 created from last week correction. So price maintains its bull structure.
But we still have a resistance level around 47,298 . If price breaks through our bullish trade will be activated.
Let's keep an eye on any high impact news.

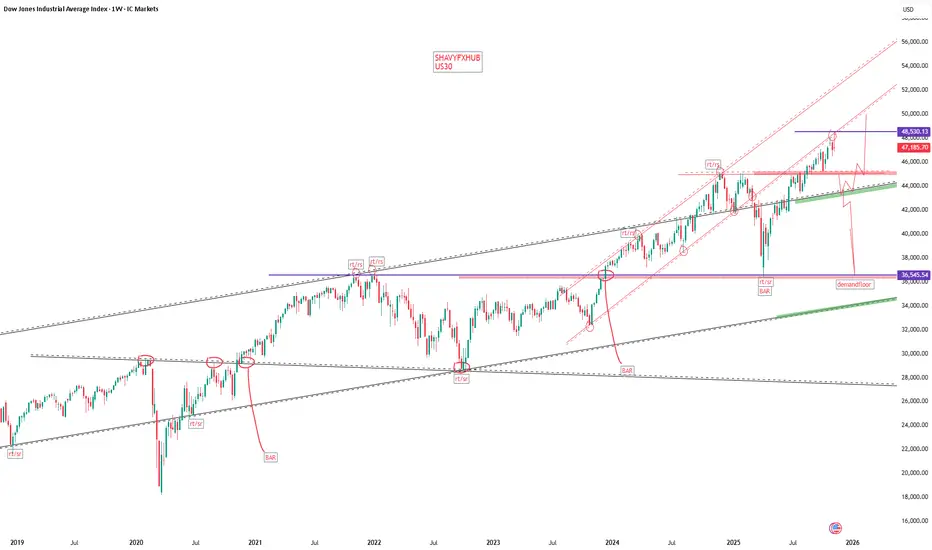
US30 WEEKLY PERSPECTIVE AND SUMMARY OF PRICEACTION FOR THE YEARUS30 rejected 48,530-4800 zone on weekly time frame ,by strategy the next demand floor will be 44,899-43,618.
the us30 rally could be calling for more correction into our psychological demand floor in the zone of 36,545.54.
the ascending trendline remain valid for sell arrangement on daily time frame .
US30 FUNDAMENTAL OUTLOOK.
The US30 is commonly referred to as the Dow Jones Industrial Average (DJIA),US30 is a stock market index that measures the performance of 30 large, publicly-owned blue-chip companies listed on stock exchanges in the United States. It is one of the most widely followed equity indices and serves as a barometer of the U.S. stock market and overall economic health.
The US30, or the Dow Jones Industrial Average (DJIA), is composed of 30 major U.S. blue-chip companies across diverse industries (excluding transportation and utilities). As of 2025, the companies making up the US30 are:
Company Names Ticker Symbol
3M Company MMM
American Express Company AXP
Amgen Inc. AMGN
Apple Inc. AAPL
Caterpillar Inc. CAT
Chevron Corporation CVX
Cisco Systems, Inc. CSCO
Dow Inc. DOW
Honeywell International Inc. HON
Intel Corporation INTC
International Business Machines (IBM) IBM
Johnson & Johnson JNJ
JPMorgan Chase & Co. JPM
McDonald's Corporation MCD
Merck & Co., Inc. MRK
Microsoft Corporation MSFT
Nike, Inc. NKE
salesforce.com, inc. CRM
The Boeing Company BA
The Coca-Cola Company KO
The Goldman Sachs Group, Inc. GS
The Home Depot, Inc. HD
The Procter & Gamble Company PG
The Travelers Companies, Inc. TRV
The Walt Disney Company DIS
UnitedHealth Group Inc. UNH
Verizon Communications Inc. VZ
Visa Inc. V
Walgreens Boots Alliance, Inc. WBA
Walmart Inc. WMT
These companies represent a cross-section of the U.S. economy, covering technology, finance, consumer goods, healthcare, industrials, and more.
How the US30 Works:
Comprises major U.S. companies across various industries (excluding transportation and utilities).
Price-weighted index, meaning companies with higher stock prices have more influence on the index’s movement.
Influences investor sentiment and is used as a benchmark for portfolio performance.
Impact of the Dollar Index (DXY) on US30:
The DXY measures the strength of the U.S. dollar against a basket of major currencies.
A stronger dollar (higher DXY) can pressure the US30 because multinational companies in the index earn revenue in foreign currencies; a strong dollar reduces those earnings when converted back to USD.
Conversely, a weaker dollar (lower DXY) tends to support the US30 by boosting the competitiveness and profitability of U.S. exporters in the index.
Impact of the US 10-Year Treasury Yield (US10Y) on US30:
The US10Y yield influences borrowing costs and investor risk appetite.
Rising yields often pressure equities like the US30 since higher bond yields increase discount rates for future corporate earnings, making stocks less attractive.
Higher yields can also signal inflation concerns or expectations of Fed tightening, which may cause market volatility.
Conversely, falling yields usually support equity markets by lowering financing costs and enhancing relative attractiveness of stocks.
Investor sentiment on the US30 often hinges on currency strength and bond market movements, reflecting economic growth and monetary policy expectations.
#us30 GOODLUCK

US30 LongsBias: Bullish continuation, but with caution given proximity to resistance.
Setup: If price breaks cleanly above the resistance zone with momentum (i.e., a strong bullish candle, minimal wick, decent follow-through) then a long entry is justified. Entry could be placed just above the breakout candle high.
Alternative: If price rejects the resistance zone (e.g., bearish pin bar, engulfing candle, then broken trendline) then a short counter-trend trade might be viable — but only for experienced traders with tight risk control, because the broader trend is still up.
Stop-loss: For the long trade, consider placing a stop just below the breakout candle low or below the trendline pivot, whichever is tighter. For the short trade, a stop above the recent swing high/resistance zone.
Target: For the long trade, the next logical target is the next major supply area (perhaps historical highs or measured move from the consolidation). For the short trade, target near the trendline support or prior swing lows.
The chart shows a clear uptrend over the intermediate term, with a series of higher highs and higher lows.
Price has respected key structure zones (off the weekly and daily frames) and is now approaching a significant resistance region.
Volume data is not shown, but the price action suggests momentum has been backing this move (i.e., relatively strong candles, visible follow-through after retests).

Dow Jones Rises on Shutdown Optimism | Bulls Eye 48500 ZoneUS30 | Overview
The price pushed up sharply ahead of the expected end of the U.S. government shutdown, reflecting renewed optimism across equity markets.
This momentum suggests a continuation of the bullish trend, with buyers maintaining control as long as the price trades above 48020.
As long as price action holds above this pivot level, the index is likely to advance toward 48210, and a break above that zone could extend gains toward 48500.
However, if the price drops below 47850, a bearish correction may develop, targeting 47450.
Pivot Line: 48020
Resistance: 48210 · 48500
Support: 47850 · 47710 · 47460


US30 Trade Set Up Nov 18 2025Price is showing strong bearish movement, creating LL/LH on the 1h and 15m and has BOS on the 15m so first id want to see price sweep internal BSL and tap into 15m or 1h FVG before looking for a continuation back down to lower SSL and 4h FVG

US30 FREE SIGNAL|LONG|
✅US30 taps a key demand zone after a clean liquidity sweep, signaling potential displacement higher. If bullish orderflow sustains, a premium retracement toward the target zone is likely.
—————————
Entry: 46,590
Stop Loss: 46,408
Take Profit: 46,808
Time Frame: 4H
—————————
LONG🚀
✅Like and subscribe to never miss a new idea!✅

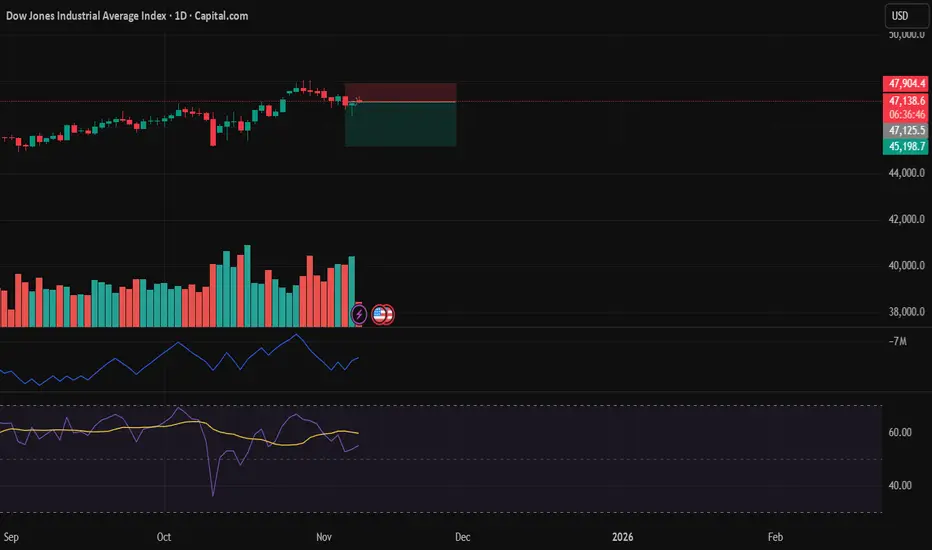
Short idea on US30After a long rally, a small correction was due signaled strongly by RSI and Volume.

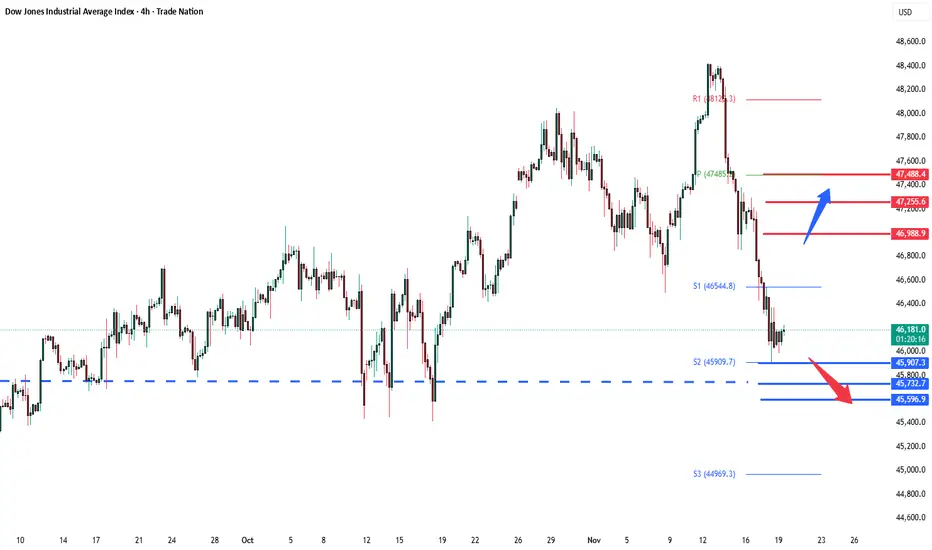
DowJones support retest at 45907Key Support and Resistance Levels
Resistance Level 1: 46988
Resistance Level 2: 47255
Resistance Level 3: 47488
Support Level 1: 45907
Support Level 2: 45732
Support Level 3: 45600
This communication is for informational purposes only and should not be viewed as any form of recommendation as to a particular course of action or as investment advice. It is not intended as an offer or solicitation for the purchase or sale of any financial instrument or as an official confirmation of any transaction. Opinions, estimates and assumptions expressed herein are made as of the date of this communication and are subject to change without notice. This communication has been prepared based upon information, including market prices, data and other information, believed to be reliable; however, Trade Nation does not warrant its completeness or accuracy. All market prices and market data contained in or attached to this communication are indicative and subject to change without notice.
US30 Trade Set Up Nov 19 2025Us30 is still in a overall bearish trend but there is a lot of daily imbalance above that needs to be filled eventually if we sweep SSL and stay closed above, i will look for internal 1m-5m IFVG/CISD to target BSL/PDH

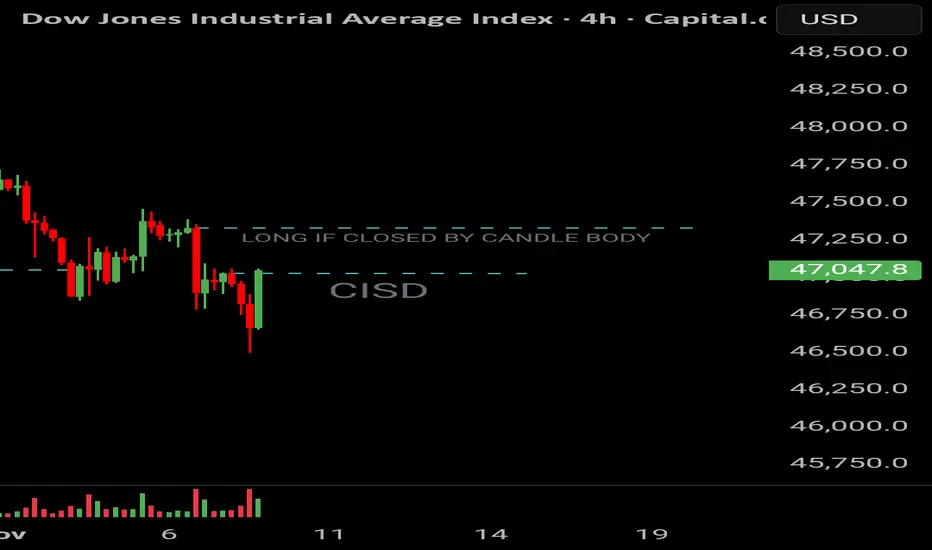
Possible entryWe can see that the price may go up if closed with the body in that upper line ( by my strategy).
US30 Trade Secured 1500 PipsSet up played out perfectly, BOS on the 1h, sweep SSL, 5m IFVG and engulfing candle to move up towards BSL

DowJones The Week Ahead Key Trading LevelsKey Support and Resistance Levels
Resistance Level 1: 47447
Resistance Level 2: 47570
Resistance Level 3: 47673
Support Level 1: 46985
Support Level 2: 46820
Support Level 3: 46708
This communication is for informational purposes only and should not be viewed as any form of recommendation as to a particular course of action or as investment advice. It is not intended as an offer or solicitation for the purchase or sale of any financial instrument or as an official confirmation of any transaction. Opinions, estimates and assumptions expressed herein are made as of the date of this communication and are subject to change without notice. This communication has been prepared based upon information, including market prices, data and other information, believed to be reliable; however, Trade Nation does not warrant its completeness or accuracy. All market prices and market data contained in or attached to this communication are indicative and subject to change without notice.

US30 H4 | Bearish Reaction off Key ResistanceMomentum: Bearish
Price is currently below the ichimoku cloud.
Sell entry: 47,458
- Strong overlap resistance
- 61.8% Fib retracement
- 61.8% FIb projection
Stop Loss: 47,801.28
- Swing high resistance
- 78.6% Fib retracement
Take Profit: 47,078.49
- Overlap support
Stratos Markets Limited (tradu.com/uk ):
CFDs are complex instruments and come with a high risk of losing money rapidly due to leverage. 68% of retail investor accounts lose money when trading CFDs with this provider. You should consider whether you understand how CFDs work and whether you can afford to take the high risk of losing your money.
Stratos Europe Ltd (tradu.com/eu ):
CFDs are complex instruments and come with a high risk of losing money rapidly due to leverage. 70% of retail investor accounts lose money when trading CFDs with this provider. You should consider whether you understand how CFDs work and whether you can afford to take the high risk of losing your money.

Dow Jones: Pressure Builds for a Topside BreakCoiling within an ascending triangle just beneath record highs, Dow Jones Industrial Average traders should be on alert for a potential bullish breakout.
The slingshot price action of recent days has delivered an obvious bullish message, with the three-candle morning star pattern completed on Monday proving prescient in signalling what was to come. Now trading just below 48,000—a level it’s struggled to overcome over the past month—we’re approaching what could be a key moment for medium-term directional risks. With the ascending triangle spanning thousands of points, a clean topside break could trigger significant upside.
With RSI (14) sitting above 50 but not yet overbought, upside pressure is strengthening. MACD is confirming, having staged a bullish crossover in positive territory earlier this week. The ducks are lining up for a potential bullish breakout.
Should we see a clean break above 48,000, longs could be established above the former highs with a stop beneath for protection. Unless we see a close above that level, the preference would be to wait for a pullback, test and bounce from the former highs using a shorter timeframe before entry.
While convention suggests a breakout from the triangle could eventually see the price trade north of 50,000, implying that could be a target, others may prefer to take their cues to exit from price action should an obvious topping signal or pattern emerge.
Even though a topside break is favoured, if the bullish move continues to stall around 48,000, there’s scope to flip the setup, allowing for shorts to be placed beneath the level with a stop above the highs, targeting 47,400 or the October uptrend. This screens as a lower-probability play given recent price and momentum signals despite previous success for shorts around these levels.
Good luck,
DS

US30 – Testing Long-Term Trendline SupportUS30 has reached a key long-term trendline that has historically acted as dynamic support. While the weekly momentum is starting to lean bearish, price action suggests a potential short-term push higher before any confirmed downside break.
We’ll be watching for rejection signs near the short-term resistance zone — or a clean break below the trendline to confirm the start of a larger reversal.

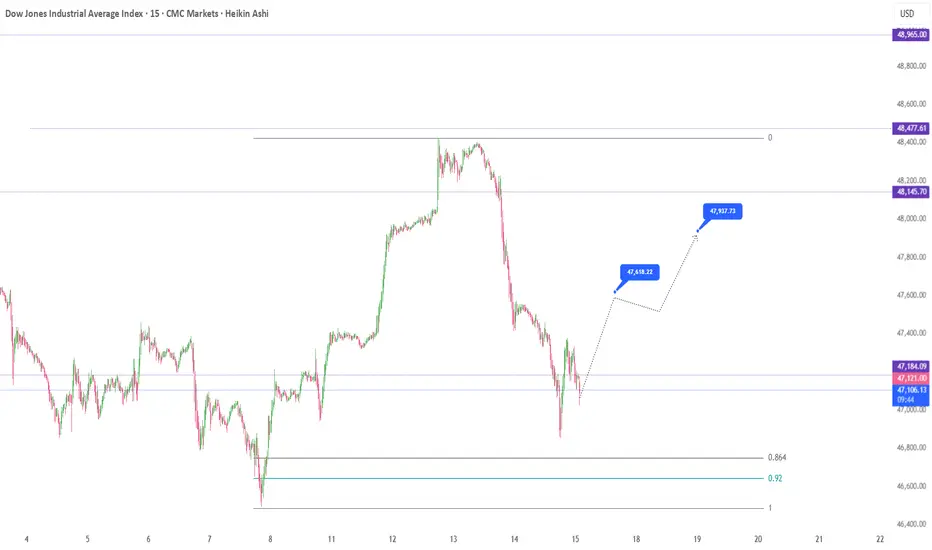
US30 : Bulls Regaining Control!After a clean correction, US30 (Dow Jones) looks set for another push upward. If structure holds, we could see momentum building toward new highs before the next potential pullback. Stay alert for confirmation around 47,400–47,600 levels!
Disclosure: We are part of Trade Nation's Influencer program and receive a monthly fee for using their TradingView charts in our analysis.
