Trade ideas

us30Dow Jones on the 4H timeframe is moving in a downtrend in my view. Based on the data on the chart, it’s time for a correction. The price may rise to the highlighted area 1 hour timeframe before continuing the corrective targets shown on the chart, or it may complete the correction around the 50% Fibonacci retracement level. It’s unlikely to rise beyond that level."

$DJIDJI is showing signs of weakness we may be entering a correction phase.
With the government searching for capital to “keep America great,” it’s coming at a big cost.
We could see a sell-off of weaker assets to clear the path for the next bullish wave in 2026. 📉➡️📈

us30bias: sell
setup EW (Ride Wave 5)
EP: fvg-h4 (pening US Open)
SL: Previous Daily High
TP: Previous Daily Low

US30 Trade Set Up Nov 4 2025Price pushed down hard during Asia and London and is making bearish structure so i will be looking for sells either after a sweep of BSL and tap into 4h FVG or if we invert this 15m FVG with a retest i will take sells down to SSL/London lows and lower 4h FVG

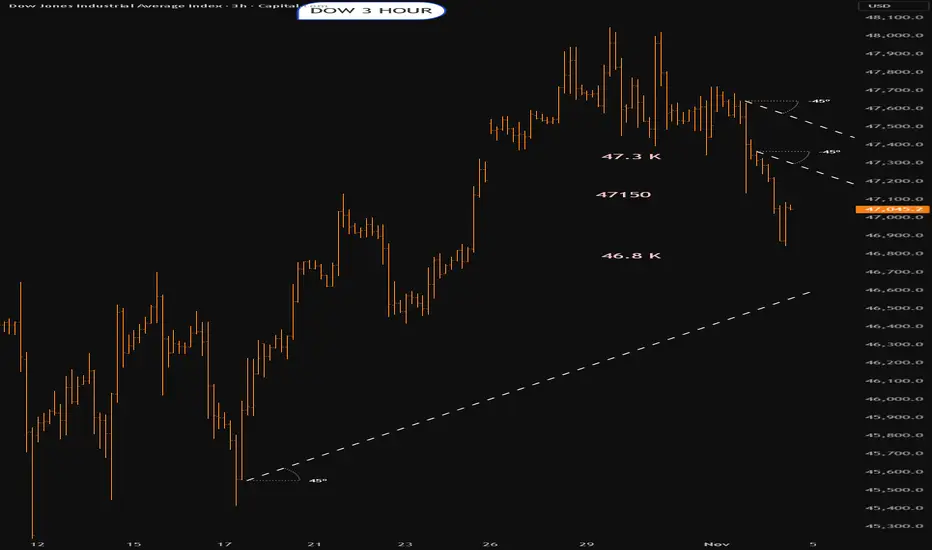
Dow into the open.Tuesday 4th NOVEMBERIn a possible bounce area
47150 seems to be some sort of pf pivot area
Lets see what happens
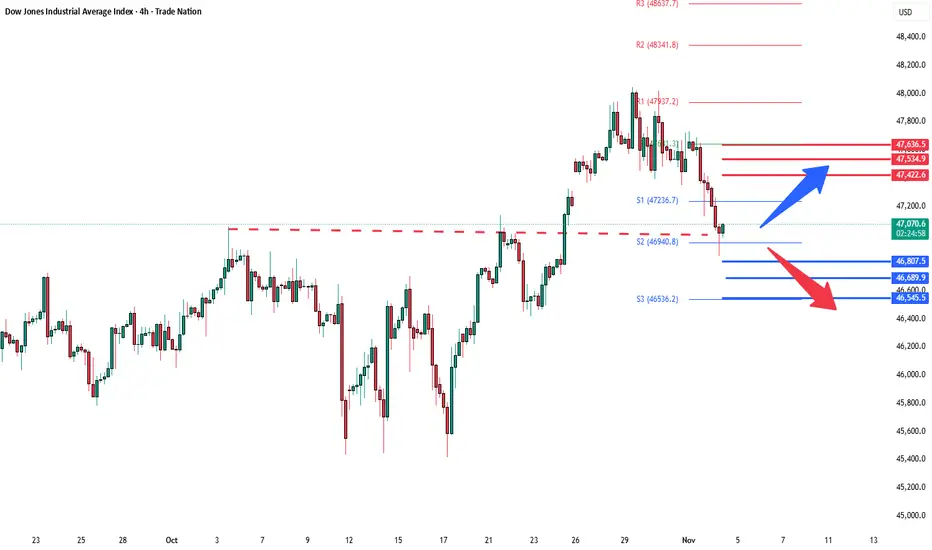
DowJones - Pullback or Reversal?Key Support and Resistance Levels
Resistance Level 1: 47433
Resistance Level 2: 47534
Resistance Level 3: 47636
Support Level 1: 46807
Support Level 2: 46690
Support Level 3: 46545
This communication is for informational purposes only and should not be viewed as any form of recommendation as to a particular course of action or as investment advice. It is not intended as an offer or solicitation for the purchase or sale of any financial instrument or as an official confirmation of any transaction. Opinions, estimates and assumptions expressed herein are made as of the date of this communication and are subject to change without notice. This communication has been prepared based upon information, including market prices, data and other information, believed to be reliable; however, Trade Nation does not warrant its completeness or accuracy. All market prices and market data contained in or attached to this communication are indicative and subject to change without notice.
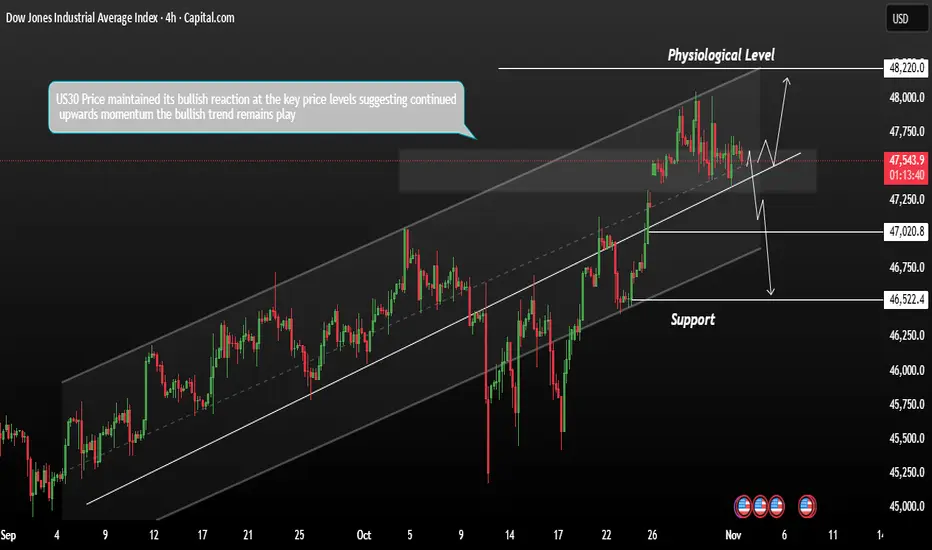
US30 Technical Outlook – Bullish Momentum IntactThe US30 maintained its bullish reaction at key price levels, suggesting continued upward momentum. As November begins, the index futures gained on Monday, supported by optimism around U.S.–China trade relations and stronger demand sentiment.
Currently, the bullish trend remains in play. If price continues to react positively to current support zones, we could see a potential move toward the next major psychological resistance level at 48,220.
However, if price fails to hold above current levels and we see a bearish reaction, a pullback could be triggered toward the support area between 47,030 and 46,520.
You may find more details in the chart.
Trade wisely best of Luck Buddies,
Ps; Support with like and comments for better analysis Thanks for Supporting.
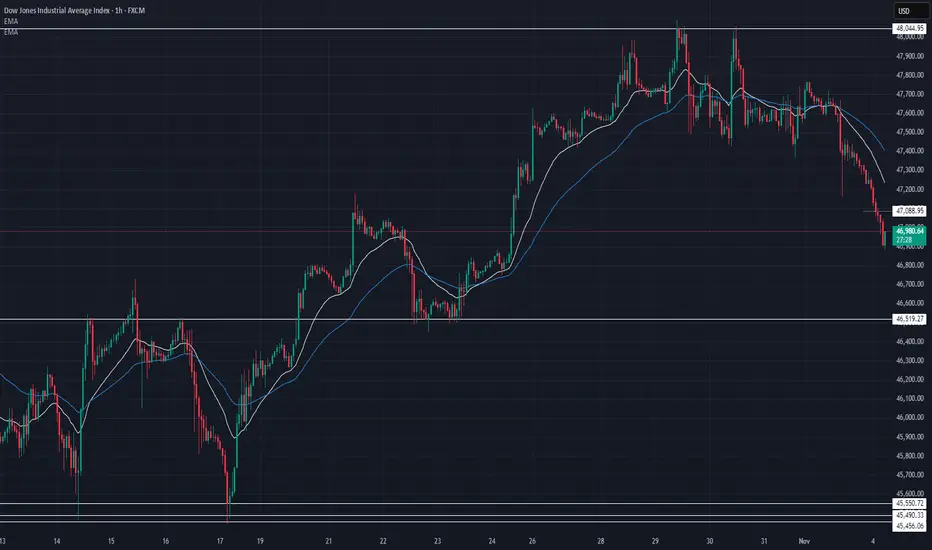
US30 Technical Breakdown – 11/04/2025📍 US30 Technical Breakdown – 11/04/2025
US30 faced heavy selling pressure after rejecting the 48,000 psychological resistance 🚫 The index has been in a steady decline since, currently sitting near 46,950, testing the mid-range structure support 👀
📊 Market Behavior:
🔹 Clean rejection from 48,000 → clear short-term shift in sentiment
🔹 Price trading below both EMAs → momentum favoring sellers
🔹 47,000 area acting as temporary support — watch for a bounce or breakdown
📌 Key Levels:
🔹 Resistance Zones:
47,400 → intraday EMA resistance
47,700 → lower high zone
48,000 → key breakout barrier
🔹 Support Zones:
46,900 → current structure support
46,520 → major demand area
46,000 → deeper correction level
🧠 Bias:
Short-term bearish ⚠️
➡️ Below 46,900 → sellers in control
⬆️ Break above 47,400 → potential reversal zone
US30 - Bearish Momentum Extends After 1.5% DropUS30 – MARKET OUTLOOK | Bearish Momentum Extends After 1.5% Drop 🇺🇸
The Dow Jones remains under pressure after a sharp 1.5% decline, with sellers maintaining control in the short term.
🔽 Below 46,920: Bearish continuation toward 46,800 → 46,600 → 46,410.
🔼 Above 46,920: Bullish recovery toward 47,100 → 47,440.
Pivot: 46,920
Support: 46,790 · 46,450 · 46,020
Resistance: 47,100 · 47,440 · 47,560
US30 stays bearish while below 46,920, but a confirmed 1H close above this level could shift tone to bullish in the near term.

US30 H4 | Bullish Bounce Off OBUS30 is having a temporary correction towards the downside. However, there is a Fair Value Gap and Order Block present, which could cause price to bounce from that area.
Our buy entry is in between the FVG and OB, at 46,883, which also aligns with the 75% FIbonacci retracement level.
The stop loss is at 46,509, which is at the swing low support level, while the take profit is at 47,460, which is at the pullback resistance level.
Stratos Markets Limited (tradu.com/uk ):
CFDs are complex instruments and come with a high risk of losing money rapidly due to leverage. 68% of retail investor accounts lose money when trading CFDs with this provider. You should consider whether you understand how CFDs work and whether you can afford to take the high risk of losing your money.
Stratos Europe Ltd (tradu.com/eu ):
CFDs are complex instruments and come with a high risk of losing money rapidly due to leverage. 70% of retail investor accounts lose money when trading CFDs with this provider. You should consider whether you understand how CFDs work and whether you can afford to take the high risk of losing your money.

Us30 long US30 (Dow Jones Index) – Market Outlook & Trade Setup
Currently observing a potential bullish reaction from the demand zone around the 47,500 region after multiple rejections at this level.
If price maintains above this support, I’m anticipating a continuation toward the 48,180 area — aligning with prior liquidity and supply levels.
This setup combines:
• Structure confirmation from previous higher lows
• Demand zone retest for potential entry
• Clear risk-to-reward framework with defined targets
Patience and precision remain key. Let’s see how price action develops going into the next session. 📊
#US30 #MarketAnalysis #TradingInsights #DowJones #TechnicalAnalysis #FinancialMarkets

Bullish bounce off?DJ30 is falling towards the support level, which is a pullback support that aligns with the 38.2% Fibonacci retracement and could bounce from this level to our take-profit.
Entry: 47,0090.29
Why we like it:
There is a pullback support that aligns with the 38.2% Fibonacci retracement.
Stop loss: 46,642.72
Why we like it:
There is an overlap support that is slightly below the 50% Fibonacci retracement.
Take profit: 48,056.22
Why we like it:
There is a swing high resistance level.
Enjoying your TradingView experience? Review us!
Please be advised that the information presented on TradingView is provided to Vantage (‘Vantage Global Limited’, ‘we’) by a third-party provider (‘Everest Fortune Group’). Please be reminded that you are solely responsible for the trading decisions on your account. There is a very high degree of risk involved in trading. Any information and/or content is intended entirely for research, educational and informational purposes only and does not constitute investment or consultation advice or investment strategy. The information is not tailored to the investment needs of any specific person and therefore does not involve a consideration of any of the investment objectives, financial situation or needs of any viewer that may receive it. Kindly also note that past performance is not a reliable indicator of future results. Actual results may differ materially from those anticipated in forward-looking or past performance statements. We assume no liability as to the accuracy or completeness of any of the information and/or content provided herein and the Company cannot be held responsible for any omission, mistake nor for any loss or damage including without limitation to any loss of profit which may arise from reliance on any information supplied by Everest Fortune Group.


US30 Trade Set Up Nov 3 2025For price to go bullish i want to see a test of the 15m FVG and respect it to then make internal 1m-5m IFVG/CISD to target BSL/London highs but if price inverts the 15m gap i will look for sells to PDL

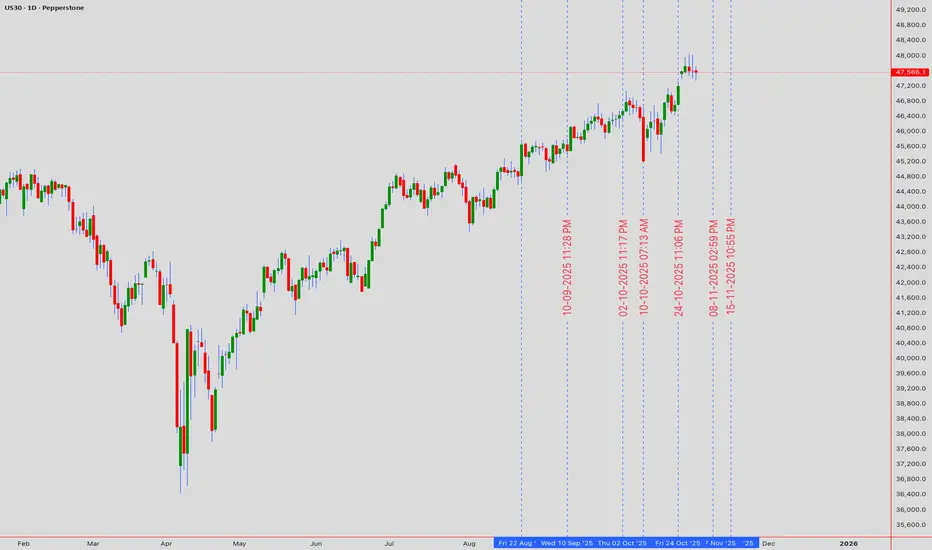
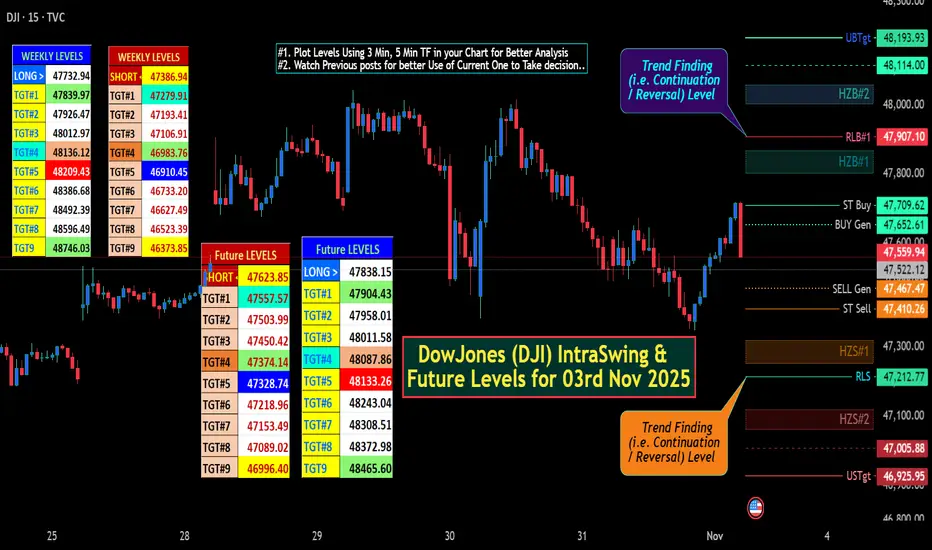
DowJones (DJI) IntraSwing & Future Levels for 03rd Nov 2025✍🏼️ "Future IntraSwing Levels" mentioned in BOX format.
✍🏼️ "WEEKLY Levels" mentioned in BOX format.
L#1: If the candle crossed & stays above the “Buy Gen”, it is treated / considered as Bullish bias.
L#2: Possibility / Probability of REVERSAL near RLB#1 & UBTgt
L#3: If the candle stays above “Sell Gen” but below “Buy Gen”, it is treated / considered as Sidewise. Aggressive Traders can take Long position near “Sell Gen” either retesting or crossed from Below & vice-versa i.e. can take Short position near “Buy Gen” either retesting or crossed downward from Above.
L#4: If the candle crossed & stays below the “Sell Gen”, it is treated / considered a Bearish bias.
L#5: Possibility / Probability of REVERSAL near RLS#1 & USTgt
HZB (Buy side) & HZS (Sell side) => Hurdle Zone,
*** Specialty of “HZB#1, HZB#2 HZS#1 & HZS#2” is Sidewise (behaviour in Nature)
Rest Plotted and Mentioned on Chart
Color code Used:
Green =. Positive bias.
Red =. Negative bias.
RED in Between Green means Trend Finder / Momentum Change
/ CYCLE Change and Vice Versa.
Notice One thing: HOW LEVELS are Working.
Use any Momentum Indicator / Oscillator or as you "USED to" to Take entry.
⚠️ DISCLAIMER:
The information, views, and ideas shared here are purely for educational and informational purposes only. They are not intended as investment advice or a recommendation to buy, sell, or hold any financial instruments. I am not a SEBI-registered financial adviser.
Trading and investing in the stock market involves risk, and you should do your own research and analysis. You are solely responsible for any decisions made based on this research.
"As HARD EARNED MONEY IS YOUR's, So DECISION SHOULD HAVE TO BE YOUR's".
Do comment if Helpful .
In depth Analysis will be added later (If time Permits)
Golds overperformance relative to the Dow will be dramatic !!The place to invest during the following decade is gold!!
The Dow Jones is projected to lose 96% relative to gold from now until August 2036!! (if history repeats itself as it did in 1968-1980).
In 12 years time, the DOW to GOLD ratio is expected to reach 0.44.
By 2026, we will be able to sell our gold by buying the Dow with less than half an ounce of gold (currently, it takes 12 ounces of gold to buy the Dow).
We're talking about a 24x outperformance!!
DO NOT ignore the historic break down in the stock market relative to gold which is happening right now !! For those who think that the gold bull is over: it is just about to start !!
This is a ratio graph, so don't get me wrong: the DOW could still hit 100'000 USD but that would imply that Gold would rise above 100'000 USD an ounce !

US30 | Dow Jones Extends Gains Above 47,565 SupportUS30 – MARKET OUTLOOK | Bullish Momentum Holds Above Pivot Zone 🇺🇸
The Dow Jones remains bullish after stabilizing above the pivot line at 47,565, supported by positive sentiment in earnings and broader risk appetite.
🔼 Above 47,565: Bullish bias toward 47,760 → 47,920 → 48,040.
🔽 Below 47,565: Bearish correction toward 47,460 → 47,250 → 47,100.
Pivot: 47,570
Support: 47,460 · 47,250 · 46,920
Resistance: 47,760 · 47,920 · 48,040
US30 stays bullish while above 47,565, but a break below could trigger a short-term pullback toward lower supports.

US30 LONG SETUP Price is trading on a downward channel which makes this trade a high risk trade. Find entries on 47.5... or lower

US30US30 is almost completing correction before further upside follows.
Disclosure: We are part of Trade Nation's Influencer program and receive a monthly fee for using their TradingView charts in our analysis.

US30How to become successful in forex and stock trading:
1.Master fundamentals and technical analysis.
2.Build and follow a solid trading plan.
3.Apply strict risk management (4–6% rule).
4.Stay disciplined—control fear and greed.
5.Record and analyze every trade.
6.Focus on high-quality setups only.
7.Diversify across assets and markets.
8.Keep evolving—study, adapt, and grow daily.

The Dow or gold ?The downward trend in the Dow versus gold ratio is clearly bearish. It's impossible to know when gold will be worth more than the Dow.

US30 DOW JONES | Elite Technical Analysis & Trading Masterclass 🔵 US30 DOW JONES | Elite Technical Analysis & Trading Masterclass | 47,566.1 🔵
📊 INSTITUTIONAL GRADE MULTI-TIMEFRAME BREAKDOWN | NOV 3-7, 2025 FORECAST 📊
Current Level: 47,566.1 | Analysis Timestamp: November 1, 2025, 00:54 UTC+4
▬▬▬▬▬▬▬▬▬▬▬▬▬▬▬▬▬▬▬▬▬▬▬▬▬▬▬▬▬▬▬▬▬▬▬▬▬▬▬▬
🎯 EXECUTIVE MARKET BRIEFING & STRATEGIC OVERVIEW
The Dow Jones Industrial Average trades at 47,566.1 , positioned at a critical inflection point that will define the market's trajectory for Q4 2025. Our institutional-grade analysis reveals a bullish bias with caution as price tests the upper boundary of a major ascending channel. This week's forecast combines classical technical analysis with modern algorithmic insights to deliver precision entry and exit strategies for both scalpers and position traders.
Institutional Support Zones: 🛡️
Primary Defense: 47,450 - 47,480 (High-frequency algo support)
Secondary Buffer: 47,350 - 47,380 (Volume-weighted anchor)
Critical Floor: 47,200 - 47,250 (Weekly pivot cluster)
Major Foundation: 47,000 - 47,050 (Psychological & structural)
Resistance & Target Matrix: 🎯
Immediate Cap: 47,650 - 47,680 (Intraday supply zone)
Secondary Barrier: 47,750 - 47,800 (Daily resistance band)
Breakout Zone: 47,900 - 47,950 (Pattern completion area)
Major Target: 48,100 - 48,150 (Weekly extension objective)
▬▬▬▬▬▬▬▬▬▬▬▬▬▬▬▬▬▬▬▬▬▬▬▬▬▬▬▬▬▬▬▬▬▬▬▬▬▬▬▬
📈 WEEKLY TIMEFRAME (1W) - MACRO STRUCTURE ANALYSIS
Elliott Wave Grand Supercycle: 🌊
We're navigating Intermediate Wave (3) of Primary Wave 5 within the grand supercycle. The current consolidation represents a Wave 4 triangle with explosive Wave 5 potential targeting 48,500-49,000. Alternative bearish count suggests completion of Wave B with Wave C decline risk below 47,000.
Wyckoff Method Application: 📚
Current Phase: Late Stage Re-Accumulation
- Preliminary Support (PS): 46,800
- Selling Climax (SC): 46,500
- Automatic Rally (AR): 47,800
- Secondary Test (ST): Successfully held 46,900
Next: Sign of Strength (SOS) breakout above 47,800
Ichimoku Cloud Master Analysis: ☁️
Weekly cloud remains decisively bullish with price trading above both Senkou spans. Chikou Span shows clear space - no resistance overhead. The lagging span at 47,200 confirms the uptrend integrity. Cloud thickness of 450 points provides substantial support cushion.
Advanced Harmonic Recognition: 🦋
Developing Bullish Bat pattern with critical ratios:
- XA retracement: 0.886 at 47,350 ✅
- AB extension: 0.382-0.5 zone active
- BC projection: Targeting 1.618-2.618 at 48,200-48,500
- Pattern invalidation: Below 47,100
▬▬▬▬▬▬▬▬▬▬▬▬▬▬▬▬▬▬▬▬▬▬▬▬▬▬▬▬▬▬▬▬▬▬▬▬▬▬▬▬
📊 DAILY TIMEFRAME (1D) - SWING TRADING BLUEPRINT
Master Candle Analysis: 🕯️
Yesterday's Hammer candlestick at 47,450 support confirms buyer absorption. The long lower shadow indicates institutional accumulation . Today's confirmation above 47,600 would complete a Morning Star reversal pattern.
Chart Pattern Mastery:
Currently resolving a Symmetrical Triangle with apex at 47,600. Breakout implications:
- Upside breakout: Targets 48,150 (measured move)
- Downside break: Targets 47,100 (risk scenario)
- Volume requirement: 20% above average for validation
Bollinger Bands Strategy: 📈
Upper Band: 47,720 (resistance)
Middle Band (20 SMA): 47,480 (support)
Lower Band: 47,240 (oversold zone)
Band Width: Contracting - Squeeze imminent
%B Reading: 0.72 (bullish momentum)
RSI Divergence Analysis:
Daily RSI at 58 with hidden bullish divergence detected. The RSI trend line from October lows remains intact. Overbought threshold at 70 provides 12 points of upside momentum potential.
▬▬▬▬▬▬▬▬▬▬▬▬▬▬▬▬▬▬▬▬▬▬▬▬▬▬▬▬▬▬▬▬▬▬▬▬▬▬▬▬
⚙️ 4-HOUR TIMEFRAME (4H) - TACTICAL POSITIONING
Gann Theory Application: 📐
Price respecting the 2x1 Gann angle from October low at 46,200. Current intersection at 47,550 acting as dynamic support. Next Gann resistance levels:
- 1x1 angle: 47,750
- 1x2 angle: 47,920
- Square of 9: 48,100
Dow Theory Confirmation:
Primary Trend: Bullish (higher highs/lows intact)
Secondary Trend: Consolidation phase
Minor Trend: Testing resistance
Volume Confirmation: Accumulation on dips
Breadth Analysis: 70% of Dow components bullish
Moving Average Orchestra:
EMA 20: 47,520 (immediate support)
EMA 50: 47,440 (strong support)
SMA 100: 47,350 (critical support)
SMA 200: 47,180 (major trend support)
Pattern Alert: ⚡
Textbook Bull Flag formation with pole from 47,200 to 47,800. Flag consolidation between 47,500-47,650. Breakout above 47,650 projects 48,250 target.
▬▬▬▬▬▬▬▬▬▬▬▬▬▬▬▬▬▬▬▬▬▬▬▬▬▬▬▬▬▬▬▬▬▬▬▬▬▬▬▬
💫 1-HOUR TIMEFRAME (1H) - INTRADAY PRECISION
Micro Pattern Development: 🔬
Inverse Head & Shoulders building:
- Left Shoulder: 47,480
- Head: 47,420
- Right Shoulder: Forming at 47,490
- Neckline: 47,580
- Target upon breakout: 47,740
VWAP Strategy Matrix:
Daily VWAP: 47,535
Weekly VWAP: 47,485
Monthly VWAP: 47,320
Upper Band 1: 47,610 (first target)
Upper Band 2: 47,685 (second target)
Lower Band 1: 47,460 (first support)
Support & Resistance Precision Map:
R3: 47,750 | R2: 47,680 | R1: 47,620
PIVOT: 47,566 (current price)
S1: 47,510 | S2: 47,450 | S3: 47,380
▬▬▬▬▬▬▬▬▬▬▬▬▬▬▬▬▬▬▬▬▬▬▬▬▬▬▬▬▬▬▬▬▬▬▬▬▬▬▬▬
⚡ 30-MINUTE SCALPING LABORATORY (30M)
Micro Structure Dynamics: 🎪
Ascending channel with precise boundaries:
- Upper channel: 47,620-47,640
- Mid-channel: 47,550-47,570
- Lower channel: 47,480-47,500
Volume Profile Insights: 📊
Point of Control (POC): 47,540
Value Area High (VAH): 47,590
Value Area Low (VAL): 47,490
High Volume Node: 47,500-47,550 (accumulation zone)
Scalping Execution Zones:
Long Zone A: 47,520-47,530 (VWAP test)
Long Zone B: 47,490-47,500 (channel bottom)
Short Zone A: 47,620-47,630 (channel top)
Short Zone B: 47,680-47,690 (resistance cluster)
▬▬▬▬▬▬▬▬▬▬▬▬▬▬▬▬▬▬▬▬▬▬▬▬▬▬▬▬▬▬▬▬▬▬▬▬▬▬▬▬
🏃 15-MINUTE & 5-MINUTE HYPERSPEED TRADING
15-Minute Lightning Setups: ⚡
Bullish Pennant completion imminent at 47,580. Breakout targets:
- Target 1: 47,620 (+40 points)
- Target 2: 47,660 (+80 points)
- Stop Loss: 47,540 (-40 points)
5-Minute Algo Trading Signals:
Entry Triggers:
- RSI < 30 + VWAP touch = Long signal
- RSI > 70 + Resistance = Short signal
- MACD crossover + Volume spike = Trend entry
Exit Rules:
- 20-point profit target OR
- RSI extremes (>80 or <20) OR
- VWAP band 2 touch
Session-Based Trading Plan: 🕐
Asian Session: Range 47,520-47,580 (60 points)
London Open: Breakout potential above 47,600
NY Premarket: Volatility increase to 80+ points
NY Session: Directional move 100+ points
NY Close: Position squaring near 47,550
▬▬▬▬▬▬▬▬▬▬▬▬▬▬▬▬▬▬▬▬▬▬▬▬▬▬▬▬▬▬▬▬▬▬▬▬▬▬▬▬
📅 WEEK AHEAD PLAYBOOK (NOVEMBER 3-7, 2025)
Monday, November 3: 🚀
Gap probability: 70% bullish to 47,620+
Strategy: Buy dips to 47,520, target 47,680
Key levels: Support 47,480, Resistance 47,700
Tuesday, November 4: 🗳️
Election Day volatility - 150+ point swings expected
Strategy: Straddle positions, tight stops
Range forecast: 47,350-47,750
Wednesday, November 5: 💥
Post-election directional breakout
Strategy: Follow the breakout with size
Bullish above 47,800, Bearish below 47,300
Thursday, November 6: 📊
Fed speak and data releases
Strategy: Fade extremes with mean reversion
Expected range: 47,500-47,900
Friday, November 7: 🎯
Weekly options expiry - gamma pinning likely
Strategy: Sell premium around 47,750 strike
Weekly close above 47,750 = Bullish continuation
▬▬▬▬▬▬▬▬▬▬▬▬▬▬▬▬▬▬▬▬▬▬▬▬▬▬▬▬▬▬▬▬▬▬▬▬▬▬▬▬
⚖️ PROFESSIONAL RISK MANAGEMENT FRAMEWORK
Intraday Risk Protocol: 🛡️
Position size: 1-2% risk per trade maximum
Risk-Reward: Minimum 1:2, target 1:3
Daily loss limit: -3% circuit breaker
Consecutive losses: Max 3, then stop
Profit protection: Trail stop at 50% of max profit
Break-even: Move stop to entry at +30 points
Swing Position Architecture: 📈
Core position: 40% at 47,450-47,500
Scale-in levels: 30% at 47,350, 30% at 47,250
Stop loss: Below 47,150 (all positions)
Target 1: 47,850 (30% exit)
Target 2: 48,100 (40% exit)
Target 3: 48,350 (20% exit)
Runner: 48,500+ (10% moon bag)
▬▬▬▬▬▬▬▬▬▬▬▬▬▬▬▬▬▬▬▬▬▬▬▬▬▬▬▬▬▬▬▬▬▬▬▬▬▬▬▬
🔴 BEARISH CONTINGENCY & RISK SCENARIOS
Invalidation Triggers: 🐻
Hourly close below 47,450 = Caution signal
4H close below 47,350 = Bearish shift likely
Daily close below 47,200 = Trend reversal warning
Weekly close below 47,000 = Major bearish confirmation
Black Swan Risk Matrix: 🦢
• Geopolitical escalation (200+ point gaps)
• Federal Reserve surprise (150+ point moves)
• Corporate earnings shocks (100+ point swings)
• Technical failures (flash crashes)
• Algorithmic liquidations (cascading stops)
▬▬▬▬▬▬▬▬▬▬▬▬▬▬▬▬▬▬▬▬▬▬▬▬▬▬▬▬▬▬▬▬▬▬▬▬▬▬▬▬
🎯 HIGH-CONVICTION CONFLUENCE ZONES
Golden Buy Zone: ✅
47,450-47,500
(Multi-timeframe support + Fibonacci cluster + Volume POC + Moving average confluence)
Premium Sell Zone: ❌
47,850-47,900
(Major resistance + Pattern targets + Round number + Weekly R1 pivot)
Breakout Confirmation: 🚀
47,680-47,720
(Triangle breakout + Flag completion + Bollinger Band penetration)
▬▬▬▬▬▬▬▬▬▬▬▬▬▬▬▬▬▬▬▬▬▬▬▬▬▬▬▬▬▬▬▬▬▬▬▬▬▬▬▬
💎 MASTER TRADER'S FINAL VERDICT
The Dow Jones at 47,566.1 presents a high-probability bullish setup with clearly defined risk parameters. The convergence of technical indicators, pattern completions, and volume dynamics creates an asymmetric risk-reward opportunity favoring longs above 47,450.
Week's Best Trade Setups: 🏆
Swing Long: 47,450-47,500 zone → Target: 48,100
Breakout Long: Above 47,680 → Target: 47,900
Scalp Long: VWAP touches at 47,535 → Target: 47,620
Success Keys: 🔑
Trade with the trend, but protect your capital. Size positions appropriately. Honor stop losses religiously. Let winners run with trailing stops.
"In trading, the disciplined mind triumphs over the brilliant mind" - Master the process, profits follow! 💰
▬▬▬▬▬▬▬▬▬▬▬▬▬▬▬▬▬▬▬▬▬▬▬▬▬▬▬▬▬▬▬▬▬▬▬▬▬▬▬▬
#US30 #DowJones #DJI #TechnicalAnalysis #Trading #StockMarket #Indices #DayTrading #SwingTrading #ElliottWave #Wyckoff #GannTheory #PriceAction #TradingStrategy #MarketAnalysis #InstitutionalTrading #OrderFlow #VolumeProfile #TradingView #SPX500 #MarketForecast
🔔 Follow for Institutional-Grade Analysis Daily! | Excellence in Execution 📊
Risk Disclosure: Trading involves substantial risk. Past performance is not indicative of future results. Always conduct thorough research and implement strict risk management protocols.