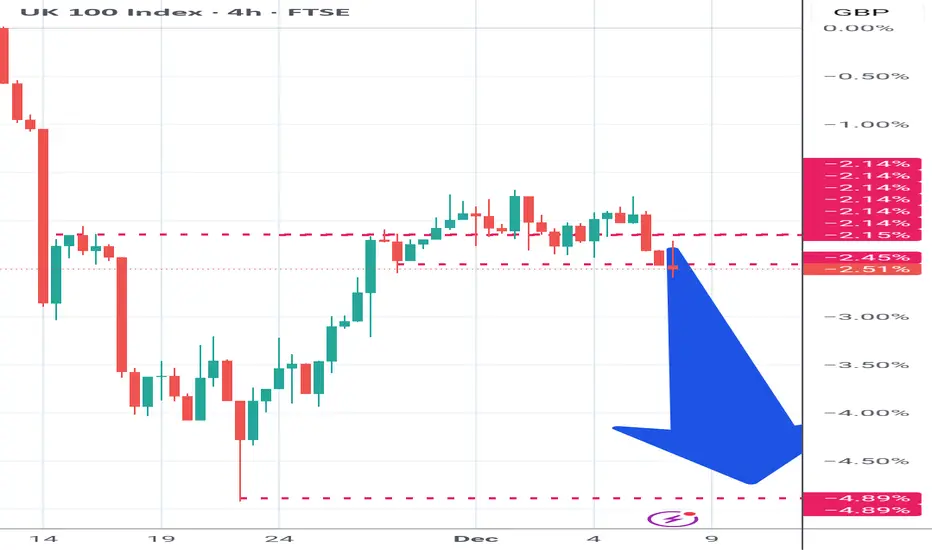
Price action Uk100 has already started showing cracks to the downside all im waiting for is clear break of structure
About UK 100, Daily
The FTSE UK Index Series is designed to represent the performance of UK companies, providing market participants with a comprehensive and complementary set of indices that measure the performance of all capital and industry segments of the UK equity market.
FTSE100 post-Budget rally: Inverse Head & Shoulders eyes 9800Chancellor Reeves unveiled tax rises worth £26 billion annually by 2029-30 but showed fiscal discipline by committing to reduce government spending as a share of GDP each year and more than doubling the fiscal headroom buffer to £21.7 billion, reassuring bond markets still scarred by the Liz Truss m

FTSE bullish breakout supported at 9655The FTSE remains in a bullish trend, with recent price action showing signs of a breakout within the broader uptrend.
Support Zone: 9655 – a key level from previous consolidation. Price is currently testing or approaching this level.
A bullish rebound from 9655 would confirm ongoing upside momentu

UK 100 Index – Psychological 10000 level Within Sight!As the dust settles on the UK Chancellor’s Autumn budget that was released on Wednesday it’s potentially a good time to assess the current backdrop for the UK 100 moving into early December.
First things first, Wednesday’s budget didn’t lead to an immediate rush to sell UK assets, which most nota

FTSE 100 index UK Beware BuyersFTSE 100 index UK Beware Buyers
i am expecting price fall little lower.
Sellside liqudity sitiing below.
wait for tab in point of intrest .
start sweeping high,s and running low,s.
i will open my short position.
best of luck

FTSE UK100 Daily Trade SetupsIn this update we review the recent price action in the FTSE UK100 and identify the next high-probability trade opportunity and price objectives to target. To review today's video analysis clcik here!


FTSE100 support retest at 9655The FTSE remains in a bullish trend, with recent price action showing signs of a breakout within the broader uptrend.
Support Zone: 9655 – a key level from previous consolidation. Price is currently testing or approaching this level.
A bullish rebound from 9655 would confirm ongoing upside momentu

FTSE This chart shows a clear change.
The upside swing has lost the 90 degree angle.
The bearish swing was volatile.
The bullish swing was, until it wasnt.
Clear 4hr change in delivery.
Momentum lost .


See all ideas
Displays a symbol's price movements over previous years to identify recurring trends.
Frequently Asked Questions
UK 100, Daily reached its highest quote on Nov 12, 2025 — 9,932.0 GBP. See more data on the UK 100, Daily chart.
The lowest ever quote of UK 100, Daily is 4,780.8 GBP. It was reached on Mar 23, 2020. See more data on the UK 100, Daily chart.
UK 100, Daily is just a number that lets you track performance of the instruments comprising the index, so you can't invest in it directly. But you can buy UK 100, Daily futures or funds or invest in its components.