Nasdaq-100 Wave Analysis – 10 November 2025- Nasdaq-100 reversed from support level 25000.00
- Likely to rise to resistance level 26250.00
Nasdaq-100 index recently reversed up with the daily Hammer from the support zone between the round support level 25000.00 and the support trendline of the daily up channel from May.
This support zone was strengthened by the 61.8% Fibonacci correction of the sharp upward impulse from October.
Given the clear daily trend, Nasdaq-100 index can be expected to rise to the next resistance level 26250.00 (top of the previous impulse wave i).
Trade ideas

NAS100 Intraday Technical AnalysisNAS100 Intraday Technical Analysis - 10 Nov 2025
Nasdaq 100 at 25,454 (2:05 PM UTC+4) — multi-chart confluences signal breakout setup.
📌 Market Context: Wyckoff Phase D re-accumulation; Dow Theory primary uptrend intact; Gann Square-of-9 vibration levels 25,520/25,320.
🗺️ Multi-Timeframe Breakdown:
1D: Broadening wedge; RSI 63 (mild bearish divergence); Ichimoku cloud support 25,180; bullish engulfing pattern intact.
4H: Rising wedge 25,280-25,520; Elliott Wave (3) mid-extension; anchored VWAP from Oct 29 = 25,180 (buy anchor).
1H: Cup-and-handle breakout base at 25,360; BB expanding; VWAP reclaimed post-morning dip.
30M: Symmetrical triangle; hidden bull divergence (RSI higher lows); volume contracting pre-breakout.
15M: Bull flag over 25,340; Tenkan>Kijun bullish; stochastic RSI reset—ready for push.
5M: Falling wedge retest 25,420; hammer candlestick confirms demand; watch bull trap on volume weakness.
🎯 PRIMARY LONG SETUP
Entry: 25,360-25,390 (VWAP + flag support) — wait for bullish 15M close above 25,380.
Stop Loss: 25,300 (below symmetrical triangle base).
Target 1: 25,480 (+26 pips).
Target 2: 25,540 (+86 pips).
Target 3: 25,620 (+166 pips — harmonic alt bat PRZ).
Confirmation: RSI >55, volume >20% of 20-day avg, VWAP slope upward.
⚡ MOMENTUM ADD-ON: Scale above 25,520 ONLY if RSI>65 & volume surge confirmed; trail stop to 25,460 once first target prints.
🔻 REVERSAL SHORT SETUP
Entry: 25,600-25,640 (supply zone) — trigger on bearish engulfing + RSI divergence.
Stop Loss: 25,700 (above rising wedge).
Targets: 25,500 → 25,420 → 25,320 (Gann support).
Confirmation: 5M/15M RSI bearish divergence; BB upper band rejection.
🚨 BREAKOUT & BREAKDOWN ALERTS:
BULL: 1H close >25,540 confirms Wave (3) extension; target 25,720; move stop to BE+20.
BEAR: 1H close <25,300 with volume expansion opens 25,180 cloud base test; watch VWAP support.
📊 INDICATOR SNAPSHOT: BB squeeze (30M) expanding; MACD histogram positive; VWAP slope UP; EMA21>EMA50>EMA200 (bullish stack).
⚠️ PATTERN ALERTS: Harmonic bat completes 25,620; rising wedge failure <25,320 = Wyckoff UTAD signal; H&S only valid if neckline 25,260 breaks.
📈 TIMING & RISK: Gann 90° window 15:30 UTC; ATR(14)=90 pts; CPI whispers & Fed speakers elevate volatility. Risk ≤1% per setup; lock partials; avoid sub-average volume chases.
Educational purposes only. Align with your plan, manage risk, adapt to real-time action.
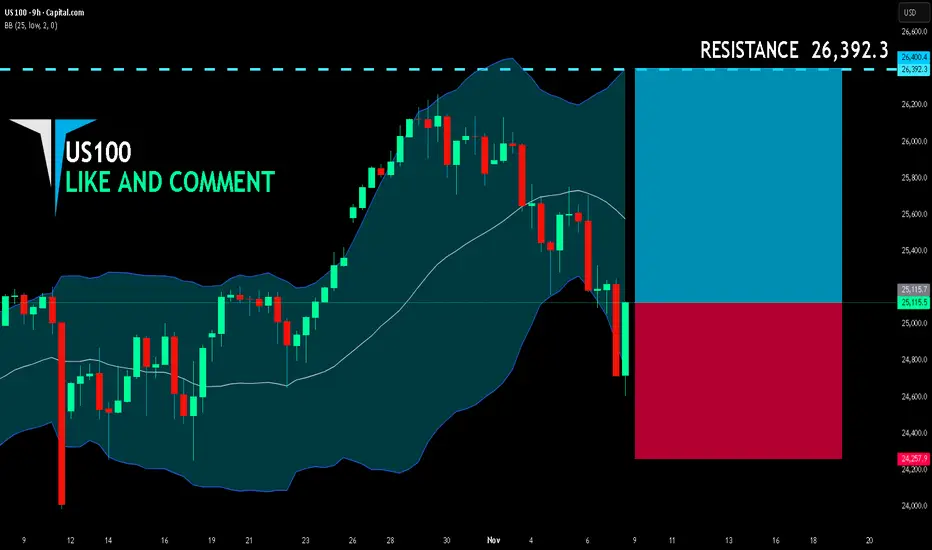
US100 LONG FROM SUPPORT
US100 SIGNAL
Trade Direction: long
Entry Level: 25,115.7
Target Level: 26,392.3
Stop Loss: 24,257.9
RISK PROFILE
Risk level: medium
Suggested risk: 1%
Timeframe: 9h
Disclosure: I am part of Trade Nation's Influencer program and receive a monthly fee for using their TradingView charts in my analysis.
✅LIKE AND COMMENT MY IDEAS✅
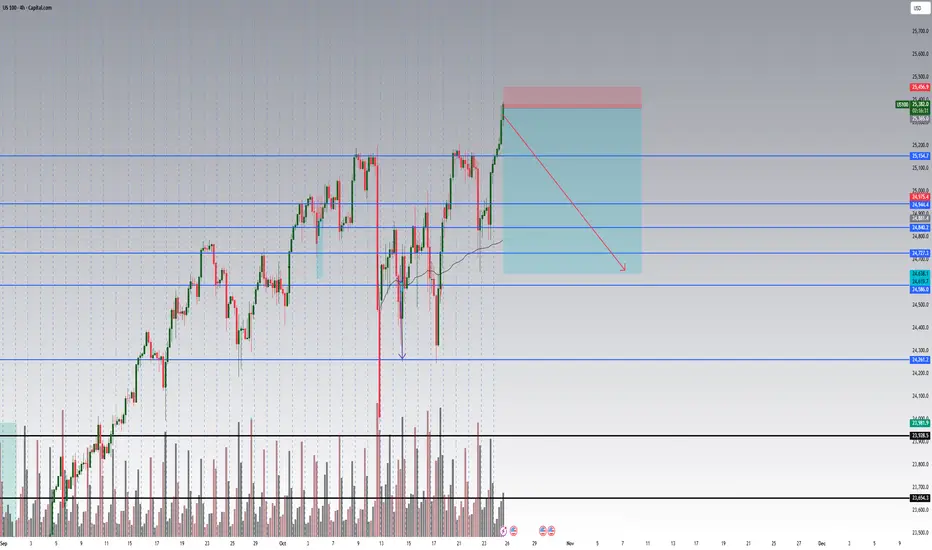
Nasdaq slides as volatility growsNasdaq was pushed down to the local support area, as the sentiment for the stock market has worsened due to a certain degree of deleveraging for stocks and investors moving to safety.
VIX (S&P 500 volatility index) has climbed above 20, which pushes the market’s volatility expectations higher and may trigger nervous reactions for tech stocks. The longest duration of downswings for Nasdaq is about 15-17 days, which allows us to project the downward move to a longer time period, with a further development of the bullish pullback, as shown at the chart.
Don't forget - this is just the idea, always do your own research and never forget to manage your risk!

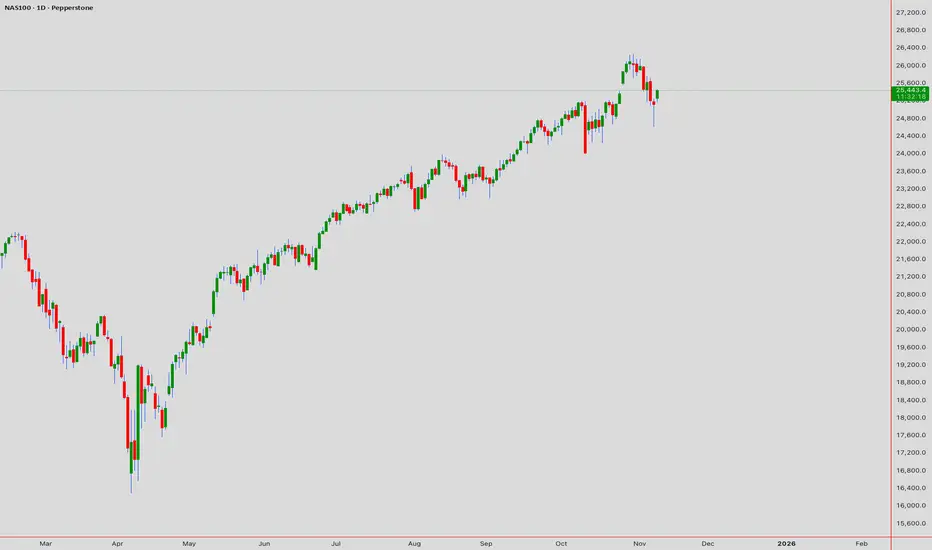
Nasdaq’s Battle at the Golden Support!On the NASDAQ 100 (NDX) chart, the index has pulled back after a strong rally to around 26,000, now testing a critical support zone near 25,000–25,200. This area is technically significant because it aligns with three key factors:
1. The main ascending trendline (blue line)
2. The 50-day moving average
3. A previous horizontal support level
In the short term, if the index holds above 25,000 and forms a bullish reversal candle, it could rebound toward the next resistance around 26,200–26,500. The stop loss for this bullish scenario would be a confirmed breakdown below 24,800.
However, if the price drops below 24,800 and stays there, a deeper correction toward 23,800–24,000 becomes likely — which aligns with the lower boundary of the medium-term channel.
From a long-term perspective, as long as the index trades above its 50-day moving average (currently around 20,300), the primary trend remains bullish, with potential upside targets between 27,000 and 28,000.
In short, this current zone represents the dividing line between trend continuation and a medium-term correction for the Nasdaq 100.


bullish or bearish continuation Idea for todaygoing down
Based on 1 hour trend reversal
Im only writing this because trading view wants more of a description

Nasdaq NAS100 Bulls Regain Control: What I’m Watching Next📈 On the 4-hour NASDAQ chart, we can clearly see a break in structure to the upside, signaling strong bullish momentum entering the market. 🟩 The buyers are showing strength, and I’ll be looking to capitalize on this momentum — but only if we see a confirmed break of the current swing high, followed by a retracement into the retest zone. 🔁
However, patience is key. ⏳ I’ll only look to engage if today’s New York session data release aligns with and supports the bullish bias. Fundamentals and technicals must work together before I take a position.
As mentioned in the video, if the anticipated price action fails to materialize, we’ll simply abandon this setup and move on — staying disciplined is crucial. 🚫
⚠️ Disclaimer: This analysis is for educational purposes only and not financial advice.

Nasdaq 100 – A Quiet Accumulation Before the Next PushThe Nasdaq 100 (US100) is showing early signs of a structural rebalancing after the recent correction. Price is currently hovering near 25,600, retracing modestly after a short-term rebound from the 25,280 demand zone — a level where Smart Money seems to have re-entered quietly.
💭 1️⃣ Market Structure – A Story of Displacement and Repricing
The current chart reveals a clear Break of Structure (BOS) followed by a corrective pullback.
After the previous sell-off, price found support at the 25,280 – 25,300 range — a discount zone aligning with both an order block and a trendline confluence.
This zone likely served as institutional demand, where Smart Money began accumulating long positions before the upward displacement.
The recent retracement, however, remains within a corrective structure, meaning we could still see one more liquidity sweep before the market decides its next major leg.
🩶 2️⃣ Supply & Demand Zones – The Footprints of Institutions
Karina is currently tracking three zones that matter most to the structure:
Demand Zone:
25,280 – 25,300: The base of institutional accumulation and current structural support.
Supply Zones:
25,970 – 26,160: A major bearish order block where Smart Money previously distributed positions — likely the next liquidity target.
The most probable scenario: a retest of the lower demand → a liquidity grab → bullish displacement toward 25,970 – 26,160 → reversal back to equilibrium.
🧭 3️⃣ Liquidity Flow – The Path of Least Resistance
Above the current range lies buy-side liquidity resting at 26,000+, while below, sell-side liquidity has already been swept near 25,280.
This suggests that the next move could be an engineered push upward — designed to collect liquidity above 25,970 – 26,160 before potential continuation back into the demand zone.
Such a move would mirror the classic SMC liquidity cycle:
Accumulate → Displace → Manipulate → Distribute.
🌙 4️⃣ Trading Outlook – Patience Before Precision
Karina’s bias for the day is moderately bullish, anticipating a short-term expansion toward the upper liquidity pool.
However, she remains cautious — waiting for confirmation near the demand zone before entering long.
Buy Idea:
Entry: 25,280 – 25,300
Stop Loss: below 25,200
Target 1: 25,970
Target 2: 26,160
If the liquidity sweep at 26,160 completes, Karina expects a controlled retracement — a potential short setup back into equilibrium around 25,400.
🌷 5️⃣ Reflection – When the Market Whispers, Smart Money Listens
The chart right now feels calm, methodical — like the quiet before a decisive wave.
Smart Money rarely rushes. It absorbs, manipulates, and moves when most traders stop paying attention.
For Karina, this is one of those moments where patience becomes the most powerful strategy.
The next move will not be random — it will be precise, intentional, and elegant, just like the rhythm of liquidity itself 🌙
This analysis reflects Karina’s personal perspective and is not financial advice.
How do you see the US100’s next move? Is Smart Money gearing up for another liquidity sweep above 26k? Let’s discuss below 💬


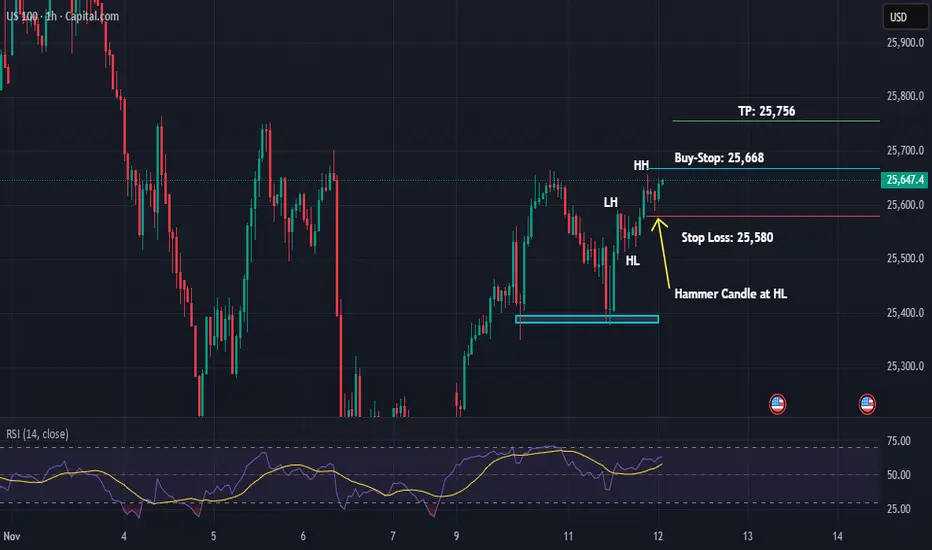
US100 Buy-Stop Setup on 1HNasdaq is in a Bullish Trend on 1H timeframe... It looks like it can go further up.
Let's take a 1:1 Long Trade here.
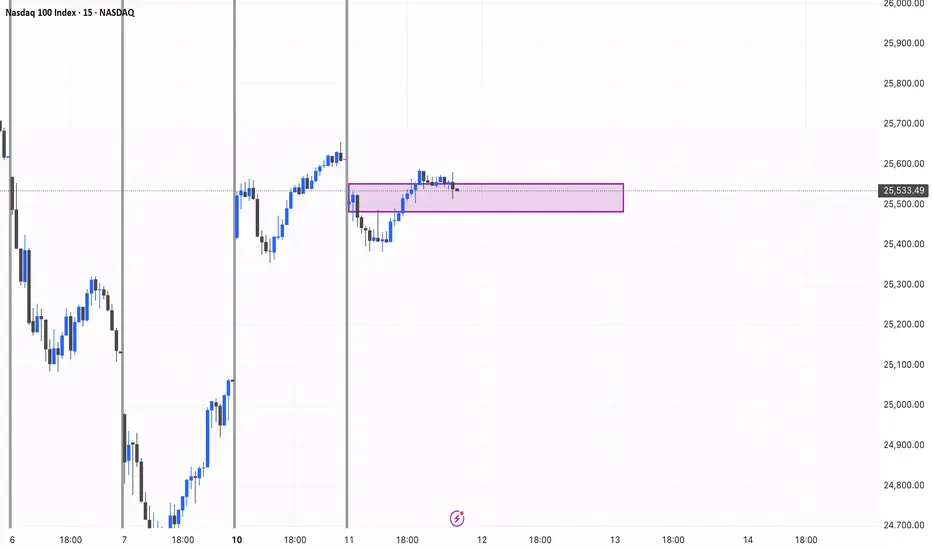
NASDAQ 100 — Key Intraday Reaction Zone (12 Nov)NASDAQ 100 (NDX) is currently trading inside a crucial intraday reaction zone around 25,551–25,480.
This area marks the intersection of previous structural resistance and short-term order flow buildup.
A clear break above this zone could signal continuation of bullish momentum, while failure to sustain may invite a short-term pullback.
Keeping an eye on how price behaves here during the U.S. session — this zone is likely to define the next directional move.
#NDX #NASDAQ100 #USMarket #PriceAction #TradingView #MarketAnalysis
US100 PRICE MAY DECLINE!The H4 chart shows there could be a good probability for a sell as price just reacted off 25,705 a sell opportunity is envisaged. I anticipate price to decline. I’m selling short US100

Is this OTE or the beginning of a bear market?Is this OTE or the beginning of a bear market?
ICT OTE Theory defines the .62 retracement of a given range as the Optimum entry for the continuation of the bullish trend. Seeking Liquidity above the previous high.
We can compare this to the supply and demand theory using SMA 10 20 50. The moving averages indicate. Price currently sits below the value area between the 10 and 20 and has reacted off the 50.
Which put us in No mans land.
the 10 & 20 being above the 50 indicate the a bullish Bias.
If we are going bearish then we want to see the 10 & 20 below or crossing the 50 and price below the 50. This would be a strong setup and signal to go short. with price targets of 24224 & 22683.
HTF analysis : The M,W,D charts are still extremely bullish.
Current Sentiment: You tube videos and News reports are warning of a reversal and/or short term bearish move lower.
My Conclusion: WE are Bullish until proven differently. Next week will either support my conclusion or prove otherwise. So Stay flat and/or hedge your current positions to protect yourself the market response.

Weakness PersistsI'm loathe to make a prediction here since I've been wrong so many times but I feel that today might be a bull trap. I still feel strongly the NASDAQ is in a bubble and I do hold a short in SNAS.AX. I'm thinking a close today below the rising blue trend line implies the breakdown is still in effect.

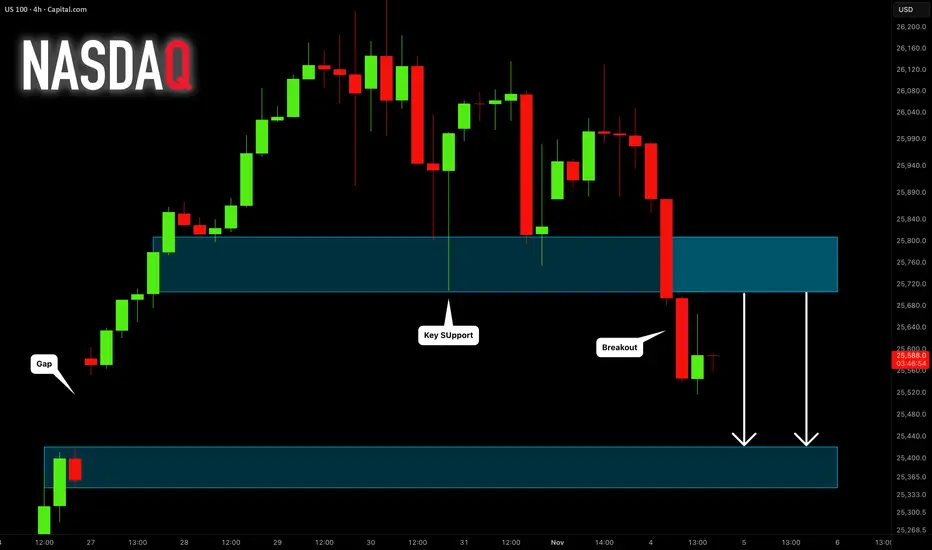
NASDAQ INDEX (US100): Forgotten Gap
A week ago, US100 formed a gap up opening.
It looks like the index is finally ready to fill it.
A breakout of a major horizontal support is a strong bearish signal.
Expect a bearish continuation to 25420.
❤️Please, support my work with like, thank you!❤️
I am part of Trade Nation's Influencer program and receive a monthly fee for using their TradingView charts in my analysis.
Nasdaq long then short: Expecting one last wave upIn this analysis, I talk about the wave structure for Nasdaq and highlighted that wave 1 is currently the longest wave and that means wave 5 cannot be longer than wave 3. This gives us a maximum target of 26300 that is already hit on 30th Oct. So while I do expect another up wave for Nasdaq, this will likely be a double top with the same high as 30th Oct before we start on a longer-term move down.

NASDAQ BullishThe NASDAQ is currently reacting at a key daily market structure level.
Heading into the New York session, I’m anticipating a potential sweep of sell-side liquidity levels before price shifts upward, possibly targeting new all-time highs
#NASDAQ #US100 #Indices #TechnicalAnalysis #TradingView

US100 – 1H Demand Zone Bounce | Bullish Reversal SetupTechnical Outlook
Price tapped into a clean 1H demand block.
Early bullish reaction from intraday support.
Potential retracement targets: 25,800 → 26,200
Setup invalid if price closes below 25,270
💰 Trade Plan (Example)
Entry: 25,380–25,400
Stop Loss: Below 25,270
Take Profit: 26,200
🧠 Bias: Bullish (Short-term bounce expected)
🎯 Focus on confirmation candle or structure break above 25,600 for momentum continuation.
#US100 #NASDAQ100 #Indices #TradingView #TechnicalAnalysis #PriceAction #SmartMoneyConcepts #SwingTrade #StockMarket #IndexTrading

US100 Price is near a strong selling zone.
I expect a possible rejection from this level.
Targets are shown in the attached analysis.
This is not financial advice, just personal analysis.

NAS100 Trade Set Up Nov 5 2025Price remains under bearish pressure as long as price respects this 4h FVG i will look for internal bearish structure on the 1m-5m to take sells to SSL/Asia lows

NAS BEARISH SETUP Price has broken the ascending channel after rejecting new highs clearly on D1 chart. A fall towards 24.500 is forecast. Early entries a valid now but price might test 25.718 first before it falls

Lower CPI Data – But Don’t Be Fooled by “Good” Inflation Numbers
Summary:
Markets cheered on lower CPI data, but the optimism might be misplaced. A softer inflation print gives the FED more flexibility, yet it also reduces the urgency for two rate cuts this year — something traders had already priced in.
Logic:
CPI came in weaker → short-term bullish sentiment.
But the real driver of rates is not CPI alone — it’s the balance between inflation and growth.
With inflation easing and economic activity still stable, the FED doesn’t need to cut twice in 2025.
Futures market (CME FedWatch) was pricing two cuts, which means that optimism is already priced into NASDAQ valuations.
Scenario Outlook:
If CPI remains stable and growth holds → only one cut or delay, not two.
That means tech valuations might need to reprice lower, especially high beta names.
NASDAQ could revisit support around 17,000–17,200 before finding balance again.
Trading View:
Watch for rejection near 18,000–18,200 (overextension after CPI rally).
Short-term bias: bearish / correction mode.
Long-term bias: still bullish, but needs valuation reset.