NIKKEI 5-month pattern points to a rise to 47300Nikkei (NI225) has been trading within a 5-month Channel Up and is on its latest Bearish Leg since the September 19 High.
As you can see, the index has had another 4 such pull-backs within this pattern, all of which touched the Buy Zone and the 1D RSI Support Zone before initiating the new Bullish Leg.
All Bullish Legs have peaked on their 1.786 Fibonacci extensions. As a result, our Target on the medium-term is 47300.
-------------------------------------------------------------------------------
** Please LIKE 👍, FOLLOW ✅, SHARE 🙌 and COMMENT ✍ if you enjoy this idea! Also share your ideas and charts in the comments section below! This is best way to keep it relevant, support us, keep the content here free and allow the idea to reach as many people as possible. **
-------------------------------------------------------------------------------
💸💸💸💸💸💸
👇 👇 👇 👇 👇 👇
NIKKEI trade ideas


Nikkei short at All time HighThis idea is bias off the fact that I believe we have completed a 5 wave structure and that currently we are at all time high. The stop loss will be above the all time high, maybe 100 points above. And the take profit will be the previous wave 4 of a higher degree.
Good luck!

JPN225 H4 | Bearish Momentum to ExtendBased on the H4 chart analysis, we can see that the price has rejected off the sell entry at 45,015.82, which is a pullback resistance and could drop from this level to the downside.
Stop loss is at 45,921.36, which is a swing high resistance.
Take profit is at 43,822.81, which is a pullback support that aligns with the 50% Fibonacci retracement.
High Risk Investment Warning
Trading Forex/CFDs on margin carries a high level of risk and may not be suitable for all investors. Leverage can work against you.
Stratos Markets Limited (tradu.com ):
CFDs are complex instruments and come with a high risk of losing money rapidly due to leverage. 65% of retail investor accounts lose money when trading CFDs with this provider. You should consider whether you understand how CFDs work and whether you can afford to take the high risk of losing your money.
Stratos Europe Ltd (tradu.com ):
CFDs are complex instruments and come with a high risk of losing money rapidly due to leverage. 66% of retail investor accounts lose money when trading CFDs with this provider. You should consider whether you understand how CFDs work and whether you can afford to take the high risk of losing your money.
Stratos Global LLC (tradu.com ):
Losses can exceed deposits.
Please be advised that the information presented on TradingView is provided to Tradu (‘Company’, ‘we’) by a third-party provider (‘TFA Global Pte Ltd’). Please be reminded that you are solely responsible for the trading decisions on your account. There is a very high degree of risk involved in trading. Any information and/or content is intended entirely for research, educational and informational purposes only and does not constitute investment or consultation advice or investment strategy. The information is not tailored to the investment needs of any specific person and therefore does not involve a consideration of any of the investment objectives, financial situation or needs of any viewer that may receive it. Kindly also note that past performance is not a reliable indicator of future results. Actual results may differ materially from those anticipated in forward-looking or past performance statements. We assume no liability as to the accuracy or completeness of any of the information and/or content provided herein and the Company cannot be held responsible for any omission, mistake nor for any loss or damage including without limitation to any loss of profit which may arise from reliance on any information supplied by TFA Global Pte Ltd.
The speaker(s) is neither an employee, agent nor representative of Tradu and is therefore acting independently. The opinions given are their own, constitute general market commentary, and do not constitute the opinion or advice of Tradu or any form of personal or investment advice. Tradu neither endorses nor guarantees offerings of third-party speakers, nor is Tradu responsible for the content, veracity or opinions of third-party speakers, presenters or participants.

JP225 Long D1Buy Stop Entry @ 38649.60
S/L @ 30467.20
T/P1 @ 46877.70
T/P2 @ ---------
R.R.R. @ 1/1
Pure Price Action analysis based on Breakout of target level.

Nikkei 225 Extends Uptrend Within Ascending ChannelThe Nikkei 225 index continues its strong upward trajectory, maintaining a well-defined ascending channel since mid-2025. Recent price action shows a sharp rally to the upper boundary of the channel, supported by sustained bullish momentum.
Both moving averages confirm the prevailing uptrend — the 50-day SMA (blue) remains above the 200-day SMA (red), reflecting a healthy technical structure. The latest surge pushed prices well above these averages, suggesting strong market conviction despite the steep short-term rise.
Momentum indicators paint a similar picture:
The MACD histogram remains positive, with the MACD line comfortably above the signal line, indicating ongoing upward momentum.
The RSI (14) has climbed above 70, signaling overbought conditions that may precede a brief pause or consolidation, especially as the index approaches the top of its trend channel.
In summary, the Japan 225 maintains a robust bullish trend within its established ascending channel. While momentum remains favorable, traders may watch for potential cooling or pullback signals near the channel’s upper boundary before assessing the next directional phase.
-MW

NI225: The Market Is Looking Down! Short!
My dear friends,
Today we will analyse NI225 together☺️
The price is near a wide key level
and the pair is approaching a significant decision level of 45,769.45 Therefore, a strong bearish reaction here could determine the next move down.We will watch for a confirmation candle, and then target the next key level of 45,521.01.Recommend Stop-loss is beyond the current level.
❤️Sending you lots of Love and Hugs❤️

Sellers Proven at Key Highs - Return Trade Loaded at 45K📊 **To view my confluences and linework:**
Step 1️⃣: Grab the chart
Step 2️⃣: Unhide Group 1 in the object tree
Step 3️⃣: Hide and unhide specific confluences one by one
💡 **Pro tip:** Double-click the screen to reveal RSI, MFI, CVD, and OBV indicators alongside divergence markings! 🎯
Title: ⚠️ J225: Sellers Proven at Key Highs - Return Trade Loaded at 45K
The Market Participant Battle:
The Nikkei 225 is showing a classic setup where institutional sellers have established dominance after retail bulls pushed price to the 45,200 zone (marked as point 2). At point 3, price broke decisively below the critical 44,400 level established at point 1, proving a set of solid sellers exist. Now at point 4, we're witnessing the classic return trade - price has come back to this proven area of institutional sellers around 45,000-45,200, giving these smart money players another opportunity to reload shorts. The battle narrative is clear: retail bulls who bought the breakout above 45,000 are now trapped, while institutional sellers wait at this resistance cluster to continue driving price lower. The expectation is for price to reject from this 45,000-45,200 resistance zone and return downward toward 44,400 and potentially 43,800 levels, punishing late-arriving bulls. 📉
Confluences:
Confluence 1: Volume Footprint & Order Flow Analysis (1H Timeframe)
The volume footprint chart (Image 1) reveals critical institutional positioning. The green horizontal line around 45,157 marks a high-volume node where significant sellers absorbed buying pressure. The volume profile shows a prominent value area high that was tested multiple times, with price consistently rejecting from this zone. The delta readings show numerous periods of negative delta at higher prices, indicating aggressive selling into strength. At the current market price around 45,015-45,044, we're seeing continued sell-side pressure with negative cumulative delta visible in the order flow. The numbered points on the chart confirm the thesis: point 1 established initial resistance, point 2 confirmed sellers, point 3 broke below proving strength of sellers, and now point 4 brings us back to the seller zone for another potential rejection. AGREES ✔
Confluence 2: Market Structure & Anchored Tools (1H Timeframe)
The market structure analysis (Images 2-4) shows a developing Point of Control (POC) near the 45,100-45,200 level that's acting as strong resistance. The anchored VWAP from point 1 shows price closed above the upper standard deviation before collapsing back below, reaching point 2's standard deviation zone - a classic sign of institutional entries and liquidation of late bulls. The volume profile overlay demonstrates that price rejected from the value area high and is now closing below the POC, signaling distribution rather than accumulation. The pink/cyan volume clusters show heavy trading occurred in this zone, and the subsequent breakdown to point 3 confirmed these as sellers, not buyers. Most critically, price is now making lower highs while MFI, RSI, and CVD candles are showing bearish divergence - price makes higher highs but indicators make lower highs. AGREES ✔
Confluence 3: Technical Indicators - RSI, MFI, OBV, CVD Divergences (1H Timeframe)
Image 5 reveals multiple powerful bearish divergences across all major indicators. The RSI shows a clear "Bear" divergence marked on the chart - price at point 4 reached similar highs to point 2, but RSI made a significantly lower high, dropping from around 70 to below 50. The MFI (Money Flow Index) displays even more pronounced bearish divergence, with the indicator trending downward throughout the rally while price made higher highs - classic smart money distribution. The CVD (Cumulative Volume Delta) candles show a declining trend with more red (sell delta) candles appearing during the rally toward point 4, indicating weakening buying pressure and increasing selling. The OBV (On-Balance Volume) and BB (Bollinger Bands) indicators both confirm the deteriorating momentum. Most importantly, both MFI and RSI are showing oversold conditions, but in a bearish context this suggests exhaustion of buying rather than imminent reversal upward. AGREES ✔
Confluence 4: Multi-Timeframe Structure & Anchored Indicators (1H Timeframe)
Image 6 provides the cleanest view of the complete setup with all anchored tools visible. The red moving average overlay shows price has repeatedly failed to sustain above the key resistance zone between 45,000-45,200. The anchored developing POC (Point of Control) clearly marks the resistance area near point 2, and the anchored VWAP shows price stretched above the upper standard deviation before collapsing - a textbook overextension and reversal pattern. The volume profile to the left demonstrates that the 45,100-45,200 zone represents the highest volume node in this range, meaning maximum seller conviction exists here. Price closing below this area after testing it multiple times (visible in the red circled markers) confirms rejection. The fact that we're seeing delta absorption at the point 4 high (as noted in your analysis) further supports the thesis that sellers are active and accumulating short positions at this level. AGREES ✔
Web Research Findings:
- **Technical Analysis:** The J225 recently traded around 44,780 points on October 2, 2025, gaining 0.51%, and reached its all-time high of 45,852.75 on September 19, 2025. Tec hnical analysts identify 45,000 as a key short-term pivotal support level, with resistances at 46,430-46,870. Mul tiple analysts are calling for near-term bearish setups: one analysis suggests a rejection from 45,015.82 pullback resistance could drive price to 43,822.81, whi le support levels are identified at 43,400, 43,000, and 42,500, with resistance at 45,000, 45,500, and 46,000.
- **Recent News/Market Drivers:** The Nikkei has been supported by fundamental catalysts including U.S. auto tariffs reduced to 15%, positive wage growth of +0.5%, and $550B in Japanese investments in U.S. projects. The Bank of Japan kept rates at 0.5% in September 2025 and announced plans to sell ETF holdings at approximately 330 billion yen annually, sig naling policy normalization. The Japan Citigroup Earnings Revision Index has been trending upwards since June 2025, suggesting analysts are becoming more optimistic about corporate earnings.
- **Analyst Sentiment:** The technical consensus shows "Strong Buy" signals across most timeframes from 30 minutes to monthly, tho ugh some analysts are positioning for a corrective leg toward 41,500-40,000. The bullish long-term view is tempered by short-term caution given the parabolic move and lack of meaningful pullbacks.
- **Data Releases & Economic Calendar:** The next Bank of Japan monetary policy meeting is scheduled for October 29-30, 2025. Mar ket consensus suggests a potential 25 basis point rate hike could occur by year-end, with October or January 2026 being most likely. Thi s creates uncertainty heading into the meeting.
- **Interest Rate Impact:** The BoJ's benchmark rate stands at 0.5%, the highest level since 2008. Mar kets currently price in a 39% probability of a 25 bps rate increase at the BoJ's October meeting. A r ate hike would typically strengthen the yen and pressure Japanese exporters, creating headwinds for the Nikkei.
- **USD/JPY Currency Impact:** The dollar-yen relationship is critical for the Nikkei. USD/JPY has been declining for four consecutive sessions, approaching support at 147.45, with improved sentiment among Japanese manufacturers supporting the yen. The USD/JPY pair touched 149.8 before easing, with 150 being a key psychological level where intervention risks loom. A s tronger yen (lower USD/JPY) typically pressures the Nikkei as it hurts export competitiveness.
Layman's Summary:
Here's what all this research means for your short trade: The Nikkei just hit record highs above 45,800 last month and has been on a tear, but it's now pulling back from those extreme levels. The Japanese stock market has been fueled by a weak yen helping exporters, but that's changing - the yen is strengthening as the dollar falls, which hurts Japanese companies that sell overseas. The Bank of Japan might raise interest rates at their October 29-30 meeting, which would strengthen the yen even more and pressure stocks. While the long-term trend is bullish and analysts are generally positive, the short-term picture shows the market stretched too far too fast without normal pullbacks. Your trade is betting on a correction from the 45,000 area back down to 44,400 or lower, which aligns with what several technical analysts are calling for. The main risk is that strong corporate earnings and continued policy support keep buyers willing to buy every dip. Think of it this way: the market sprinted to 45,800 without taking a breath, and now it needs to rest - your trade is positioned for that rest period. The upcoming BoJ meeting is the key event that could accelerate your trade if they sound hawkish (rate hike likely) or reverse it if they remain dovish (no rate changes).
Machine Derived Information:
- **Image 1 (Volume Footprint Chart - 1H):** Order flow and volume profile analysis showing high-volume resistance zone around 45,157.8 with negative delta clusters indicating aggressive selling. Numbered points 1-4 mark the trade narrative. **Significance:** Confirms institutional sellers are active at this level and have been absorbing buying pressure repeatedly. The volume profile POC at this level acts as strong resistance. **AGREES ✔**
- **Image 2 (Market Structure with Annotations - 1H):** Chart showing numbered sequence (1→2→3→4) with price structure, anchored VWAP, developing POC, and volume profile overlay. Text annotation describes the setup logic. **Significance:** Validates the entire trade thesis - point 3 closes below point 1 proving sellers, point 2 is the resistance zone we're returning to, and point 4 is the current rejection area. Bearish divergences confirmed. **AGREES ✔**
- **Image 3 (Duplicate of Image 2):** Same market structure analysis. **Significance:** Reinforces the pattern and trade setup - no new information but confirms consistency of the analysis. **AGREES ✔**
- **Image 4 (Zoomed Out Structure View - 1H):** Broader view of the same pattern showing the complete price journey from points 1 through 4, with the breakdown and return clearly visible. **Significance:** Provides context that this isn't a small intraday pattern but a meaningful market structure on the hourly timeframe spanning several sessions. **AGREES ✔**
- **Image 5 (Full Indicator Panel - 1H):** Complete technical picture with RSI, MFI, CVD candles, and OBV all displayed below price action, with bearish divergence markings clearly visible. **Significance:** Multiple indicator confirmation of weakening momentum and bearish divergence. RSI marked "Bear", MFI trending down, CVD showing negative delta accumulation. This is as bearish a technical picture as you can get on indicators. **AGREES ✔**
- **Image 6 (Clean Structure with All Tools - 1H):** Clearest view showing price, moving averages, anchored VWAP with standard deviations, developing POC, and volume profile, plus the numbered points and circled rejection markers. **Significance:** Synthesizes all technical elements into one picture showing price rejection from value area high, overextension above VWAP standard deviation, and current positioning back at proven resistance. Your note about delta absorption at point 4 high completes the picture. **AGREES ✔**
Actionable Machine Summary:
Every single chart and indicator confluence you've provided agrees with the short thesis. The machine analysis reveals a textbook short setup with multiple confirmation layers: (1) Volume profile and order flow confirm heavy selling at 45,000-45,200, (2) Market structure shows a clear return to proven sellers after breaking below support, (3) Multiple bearish divergences across RSI, MFI, CVD, and OBV indicate smart money distribution while retail chases highs, (4) Anchored VWAP shows overextension and rejection from upper standard deviations, (5) Developing POC marks exact resistance zone, and (6) Delta absorption at the highs signals institutional shorts loading up. The 1-hour timeframe provides sufficient weight for a multi-session trade. The pattern is clean, the confluences align, and price action is confirming the setup with rejection wicks at point 4. This is a high-probability mean reversion trade back to 44,400, with potential extension to 43,800 if momentum continues.
Conclusion:
**Trade Prediction:** ⚠️ **CAUTIOUS SUCCESS** ⚠️
**Confidence Level:** Medium-High
Key Reasons Supporting Success:
1. **Perfect Technical Confluence:** All six charts show bearish alignment with volume profile resistance, market structure confirmation, and multiple indicator divergences
2. **Proven Sellers:** Point 3 breaking below point 1 definitively proved institutional sellers exist and are active at these levels
3. **Bearish Divergences:** RSI, MFI, CVD, and OBV all showing textbook divergence - price making higher highs while indicators make lower highs
4. **Order Flow Confirmation:** Delta absorption at point 4 high indicates institutions are actively shorting the resistance retest
5. **Mean Reversion Setup:** Price stretched above VWAP upper standard deviation and POC resistance - statistically likely to revert
Key Risks/Reasons for Caution:
1. **Counter-Trend in Bull Market:** The broader trend remains bullish with technical indicators showing "Strong Buy" on longer timeframes, and the index holding above key 45,000 support - yo u're fighting the dominant trend
2. **Strong Fundamental Support:** Analyst earnings revisions trending upward, positive corporate outlook, reduced U.S. tariffs, and wage growth provide fundamental tailwinds that could keep buyers willing to step in
3. **Limited Downside Extension Risk:** While the trade to 44,400 looks solid, expecting significant extension below 44,000 may be optimistic given the strength of underlying fundamentals and long-term bullish structure
4. **BOJ Meeting Uncertainty:** The October 29-30 BoJ meeting has only 39% probability of a rate hike priced in - if they remain dovish, yen weakness could resume and pressure your short
5. **8H Timeframe May Need Higher Timeframe Confirmation:** While your setup is on 1H charts, for holding through multiple sessions, daily chart alignment would strengthen conviction - the daily may still be bullish
**Risk/Reward Assessment:** The trade has solid R/R to the 44,400 level (approximately 600-point move from 45,000 = decent reward), with stop above 45,300-45,400 (300-400 point risk). That's roughly 1.5:1 to 2:1 R/R, which is acceptable but not exceptional. The key is that you need to be nimble - this is a counter-trend mean reversion play in a strong bull market, not a trend-following trade.
**Final Recommendation:** ⚠️ **TAKE THE TRADE WITH TIGHT RISK MANAGEMENT** ⚠️
**Execution Strategy:**
- **Entry:** Current level (45,000-45,100) or on any push toward 45,200 resistance
- **Stop Loss:** Above 45,400 (above point 4 high and resistance zone) - MUST BE RESPECTED
- **First Target:** 44,400 (point 1 / proven support level) - TAKE PARTIAL PROFITS HERE
- **Extended Target:** 43,800-44,000 (if momentum continues) - LET RUNNERS WORK
- **Position Sizing:** Use 50-70% of normal size given counter-trend nature
- **Trade Management:** Move stop to breakeven once price reaches 44,700; trail stop using 1H swing highs
The technical setup is excellent and all your confluences align perfectly. However, you're shorting into a strong bull market with positive fundamentals, so this is a tactical counter-trend trade rather than a major trend change. The indicators and order flow suggest a high probability of reaching 44,400, but don't expect this to be the top of the market. Be prepared to take profits quickly rather than holding for a major reversal. The upcoming BoJ meeting on October 29-30 is the wildcard - a hawkish tone would accelerate your trade, while dovish comments could stop you out. Given the solid technical setup but counter-trend nature and fundamental strength, I rate this trade as worthwhile but requiring disciplined risk management. Execute with the understanding this is a mean reversion scalp, not a major reversal call. 🎯

NI225: Bulls Are Winning! Long!
My dear friends,
Today we will analyse NI225 together☺️
The price is near a wide key level
and the pair is approaching a significant decision level of 43,534.99 Therefore, a strong bullish reaction here could determine the next move up.We will watch for a confirmation candle, and then target the next key level of 45,500.34 .Recommend Stop-loss is beyond the current level.
❤️Sending you lots of Love and Hugs❤️

NI225: Next Move Is Up! Long!
My dear friends,
Today we will analyse NI225 together☺️
The price is near a wide key level
and the pair is approaching a significant decision level of 45,043.01 Therefore, a strong bullish reaction here could determine the next move up.We will watch for a confirmation candle, and then target the next key level of 45,362.30.Recommend Stop-loss is beyond the current level.
❤️Sending you lots of Love and Hugs❤️

Exports Soft, Tech Shaky: Nikkei-Japan225 Pullback MapPrice has run hard into a fresh high with almost no meaningful pullback. With the dollar at a crossroads and macro tone turning more mixed for Japan/tech, I’m positioning for a corrective leg into 41,500 → 40,000. From that area I’ll reassess.
Technicals
• Parabolic extension into supply: Pushed through the 2024 range/premium zone and is now trading inside an overhead supply band (upper 46k–49k). Extended structure = ripe for mean reversion.
• Breakout retest levels below: Clean magnet zones at 41,500 (prior breakout / premium box mid) and 40,000 (round-number + structure).
• Risk line: Idea invalidated on a daily close above ~49,000 (acceptance above supply). I’ll scale adds on lower highs; reduce if momentum reclaims the highs with range expansion.
Fundamentals
• Export softness: Japan exports contracted for a 4th month (-0.1% YoY). Shipments to the US fell ~-13.8% YoY, while Asia rebounded only modestly—pointing to cooling external demand.
• BoJ steady & cautious: Policy rate held at 0.5% with inflation easing to ~2.7%. The BoJ prioritizes stability and optionality—less fuel for chasing equities at highs.
• Tech headwinds risk: Reports of China restricting an Nvidia chip add to regional tech sentiment risk.
• Global mix: The Fed’s pivot to easing supports liquidity, but US indices at records after the cut + tariff/trade headlines leave room for risk-off swings—often pressuring JP equities, especially if JPY firms.
Trade Plan (summary)
• Bias: Short swing (daily)
• Targets: 41,500 first, then 40,000
• Invalidation: Daily close >49,000
• Notes: Watching USD/JPY, BoJ commentary, US data, and trade/tariff headlines for momentum shifts.
Note: Please remember to adjust this trade idea according to your individual trading conditions, including position size, broker-specific price variations, and any relevant external factors. Every trader’s situation is unique, so it’s crucial to tailor your approach to your own risk tolerance and market environment.

Japan 225 CFD SELL?Market overall has been bullish on weekly. Based on daily and 4HR TF, the market seems to be forming a possible reversal pattern which could lead to a possible reversal.
We could see SELLERS coming in strong should the current level hold.
Disclaimer:
Please be advised that the information presented on TradingView is solely intended for educational and informational purposes only.The analysis provided is based on my own view of the market. Please be reminded that you are solely responsible for the trading decisions on your account.
High-Risk Warning
Trading in foreign exchange on margin entails high risk and is not suitable for all investors. Past performance does not guarantee future results. In this case, the high degree of leverage can act both against you and in your favor

Update to our Nikkei 225 callThe Nikkei 225 is up around 10% since our bullish note in June .
That confirms our earlier conviction. Japan’s pivot into AI, combined with ultra-loose domestic policy, has powered earnings and investor confidence. Now, a secondary wave of upside is building, centred on a weakening US dollar.
The US dollar has entered a broad downward trend. Falling yields, slower US growth, and rising expectations of rate cuts have all contributed. Markets are now pricing in more Fed easing, pushing the dollar to multi-year lows.
This matters for Japanese equities. A weaker dollar usually drives a weaker yen, boosting the export sector. Dollar revenues translate into higher earnings. Japanese companies become more competitive globally. Foreign capital also starts to look at yen assets more seriously, especially when US returns are under pressure.
At the same time, global risk appetite is stabilising. Japan’s equity market, still trading at a discount to US peers, offers solid earnings growth with less tech sector froth. That’s a rare combination.
We remain high-conviction bullish on the Nikkei. The AI transformation is real, and earnings momentum remains strong. With the greenback weakening, Japan’s export engine stands to accelerate. The weak dollar isn’t just supportive, it’s the next catalyst for the rally.
The forecasts provided herein are intended for informational purposes only and should not be construed as guarantees of future performance. This is an example only to enhance a consumer's understanding of the strategy being described above and is not to be taken as Blueberry Markets providing personal advice.

The 4h volume support will moat likely hold FX:JPN225 Down to 44503 is posible, i.e 4h dynamic volume support. Just a corection before FED on Wednesday. All other theories for 43K, the daily support,is not likely right now even toight the daily RZI indicates reversal. This scenario is possible in a case of very bad news next week but in a worst case we will move between these levels.i.e 44 500 and above 43 000.

NI225: Next Move Is Down! Short!
My dear friends,
Today we will analyse NI225 together☺️
The price is near a wide key level
and the pair is approaching a significant decision level of 44,768.07 Therefore, a strong bearish reaction here could determine the next move down.We will watch for a confirmation candle, and then target the next key level of 44,532.05.Recommend Stop-loss is beyond the current level.
❤️Sending you lots of Love and Hugs❤️

JP ShortJP225 may potentially decline from the 43550 level at point D of the crab pattern, with the next likely target being a lower FVG zone as a probable objective.

JPN225 H4 | Potential bullish continuationBased on the H4 chart analysis, we could see the price fall to the buy entry of 43,018.02, which is a pullback support that aligns with the 50% Fibonacci retracement and could bounce from this level to the upside.
Stop loss is at 42,488.03, which is a pullback support that is slightly below the 61.8% Fibonacci retracement.
Take profit is 43,887.74, which is a multi swing high resistance.
High Risk Investment Warning
Trading Forex/CFDs on margin carries a high level of risk and may not be suitable for all investors. Leverage can work against you.
Stratos Markets Limited (tradu.com/uk ):
CFDs are complex instruments and come with a high risk of losing money rapidly due to leverage. 65% of retail investor accounts lose money when trading CFDs with this provider. You should consider whether you understand how CFDs work and whether you can afford to take the high risk of losing your money.
Stratos Europe Ltd (tradu.com/eu ):
CFDs are complex instruments and come with a high risk of losing money rapidly due to leverage. 66% of retail investor accounts lose money when trading CFDs with this provider. You should consider whether you understand how CFDs work and whether you can afford to take the high risk of losing your money.
Stratos Global LLC (tradu.com/en ):
Losses can exceed deposits.
Please be advised that the information presented on TradingView is provided to Tradu (‘Company’, ‘we’) by a third-party provider (‘TFA Global Pte Ltd’). Please be reminded that you are solely responsible for the trading decisions on your account. There is a very high degree of risk involved in trading. Any information and/or content is intended entirely for research, educational and informational purposes only and does not constitute investment or consultation advice or investment strategy. The information is not tailored to the investment needs of any specific person and therefore does not involve a consideration of any of the investment objectives, financial situation or needs of any viewer that may receive it. Kindly also note that past performance is not a reliable indicator of future results. Actual results may differ materially from those anticipated in forward-looking or past performance statements. We assume no liability as to the accuracy or completeness of any of the information and/or content provided herein and the Company cannot be held responsible for any omission, mistake nor for any loss or damage including without limitation to any loss of profit which may arise from reliance on any information supplied by TFA Global Pte Ltd.
The speaker(s) is neither an employee, agent nor representative of Tradu and is therefore acting independently. The opinions given are their own, constitute general market commentary, and do not constitute the opinion or advice of Tradu or any form of personal or investment advice. Tradu neither endorses nor guarantees offerings of third-party speakers, nor is Tradu responsible for the content, veracity or opinions of third-party speakers, presenters or participants.

JPN225 |Still BullishJPN225 has printed HH and HL.It is still bullish.On 1hr TF there is divergence but it is not supported by the 4hr TF which is still showing a continuation of bullish trend.

Nikkei 225 Rises After Prime Minister Shigeru Ishiba ResignsNikkei 225 Rises Following Resignation of Prime Minister Shigeru Ishiba
As the chart shows, Japan’s Nikkei 225 stock index (Japan 225 on FXOpen) today approached its historic peak (B) around the 43,900 level.
Bullish sentiment was driven by political news. According to Reuters, Prime Minister Shigeru Ishiba has stepped down. The leading candidate to replace him, Sanae Takaichi, is regarded as a supporter of stimulus measures and unprecedented monetary easing – a bullish factor for companies.
Technical Analysis of the Nikkei 225
As indicated by the 200- and 400-period moving averages on the 4-hour chart, Japan’s stock market remains in a long-term uptrend. This summer, index movements have been forming an ascending channel, highlighted in blue, with the lower boundary acting as strong support.
Other bullish signs include:
→ A bullish structure, highlighted by a normal pullback of around 50% (B→C) following the A→B impulse.
→ During the B→C decline, price movements formed a corridor (marked with red lines) resembling a bullish flag pattern. Its breakout suggests an attempt to resume the upward trend after an interim correction.
→ Recent price action, indicating that former resistance levels have turned into support. This applies both to the upper red line (marked with an arrow) and to last week’s former resistance at 43,150.
On the other hand:
→ Long upper shadows on today’s candles point to increased selling pressure near the historic peak.
→ The RSI indicator has risen to the overbought territory.
Given that the index is now around the median of the ascending channel (a level where supply and demand tend to balance), we could assume the market may consolidate in the short term. Possible scenarios include:
→ Attempts to break through the historic high, which may fail – potentially trapping overly optimistic participants and creating signs of a bearish ICT Liquidity Sweep pattern above peak B.
→ A correction with a retest of the 43,150 level.
This article represents the opinion of the Companies operating under the FXOpen brand only. It is not to be construed as an offer, solicitation, or recommendation with respect to products and services provided by the Companies operating under the FXOpen brand, nor is it to be considered financial advice.

JP225 Nikkei 225What is JP225?
The JP225, also known as the Nikkei 225, is a major stock market index in Japan. It tracks the performance of 225 of the largest and most liquid publicly traded companies listed on the Tokyo Stock Exchange (TSE). The Nikkei 225 covers a wide array of sectors such as automotive (Toyota, Honda), technology (Sony, Panasonic), finance (Mitsubishi UFJ), consumer goods, and more. It is price-weighted, meaning the stocks with higher prices have a bigger influence on the index value, similar to the Dow Jones Industrial Average in the US.
The Nikkei 225 serves as a key barometer for the health of the Japanese economy and equity market performance.
How Does the JB10Y and BOJ Interest Rate Decision Affect the JP225?
1. Japan 10-Year Government Bond Yield (JB10Y)
The JB10Y yield reflects long-term borrowing costs and investor expectations on Japan’s economy and inflation.
Rising 10-year yields typically signal improving growth or inflation expectations, which can be positive for equities like the Nikkei if higher yields reflect stronger economic prospects.
However, higher yields also increase financing costs for companies, which may weigh on profit margins and stock prices if the rise is rapid or caused by inflation worries.
Falling yields can indicate economic pessimism or deflation fears, which usually weigh on the Nikkei due to adverse growth expectations.
2. Bank of Japan (BOJ) Interest Rate
BOJ’s interest rate policy primarily influences short-term rates and liquidity in the Japanese economy.
Japan has historically maintained very low or even negative interest rates to stimulate economic growth and combat deflation.
BOJ rate hikes might increase borrowing costs and dampen stock valuations in the short term but could also signal confidence in economic recovery.
Maintaining or lowering rates supports corporate borrowing and investment, generally providing a tailwind to the Nikkei.
BOJ policy also influences currency strength (JPY), which affects export-oriented companies within the index.
Summary
The JP225 (Nikkei 225) is influenced by both the longer-term JB10Y bond yields and the Bank of Japan’s interest rate decisions. Rising JB10Y yields can indicate stronger growth but come with higher costs, impacting the index positively or negatively depending on the economic context. BOJ’s interest rates affect short-term borrowing, liquidity, and market sentiment, with low or easing rates typically supporting equity markets like the Nikkei.
#jp225 #stocks #indices
These factors, combined with global market trends and currency movements, shape the Nikkei 225’s performance and investor sentiment in Japan.

NI225: Target Is Up! Long!
My dear friends,
Today we will analyse NI225 together☺️
The recent price action suggests a shift in mid-term momentum. A break above the current local range around 43,018.70 will confirm the new direction upwards with the target being the next key level of 43,345.35 and a reconvened placement of a stop-loss beyond the range.
❤️Sending you lots of Love and Hugs❤️


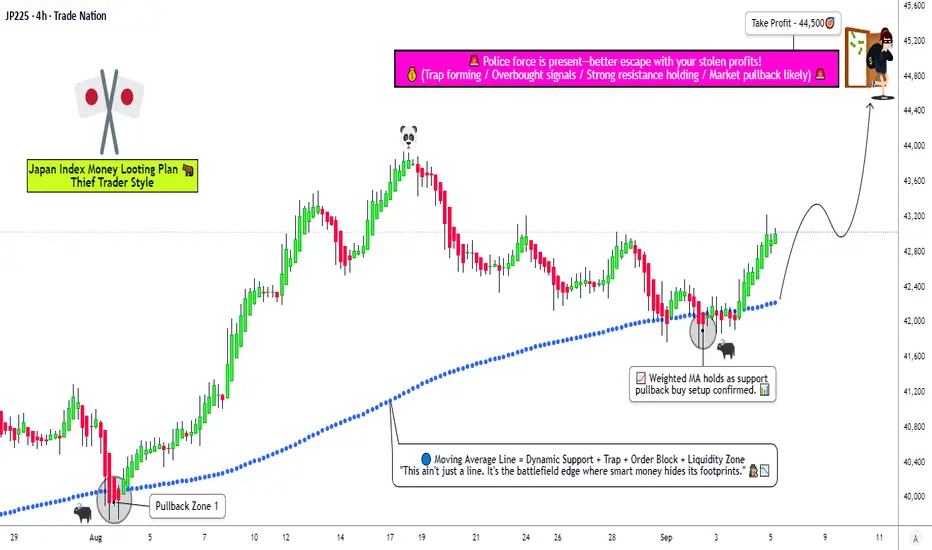
JP225 – Multi-Layer Entry, Smart SL & Steal Profits!🚀🇯🇵 JP225 (JAPAN 225) CFD - THIEF STRATEGY BULLISH PLAN 🇯🇵🚀
🎯 Core Trading Idea
The "Thief Strategy" uses layered limit orders to stealthily accumulate positions during bullish momentum, targeting a swift escape before key resistance levels. This approach maximizes entry efficiency while minimizing market impact – perfect for the current JP225 setup!
📊 THIEF STRATEGY EXECUTION PLAN
⚡ Entry Protocol (Layered Limit Orders)
🔰 Layer 1: 42,200
🔰 Layer 2: 42,400
🔰 Layer 3: 42,600
🔰 Layer 4: 42,800
💡 Pro Tip: Add more layers based on your risk tolerance and capital allocation
🛑 Stop Loss Configuration
Thief OG SL: 41,800 (Strategic support breach level)
⚠️ Disclaimer: Adjust SL based on your personal risk management rules. This is NOT financial advice.
🎯 Profit-Taking Target
Primary Escape Zone: 44,500 (Take profits before police barricade resistance at 45,000)
Remember: Escape with your stolen money wisely! Partial profits at 43,800 and 44,200 recommended
📈 WHY THIS PLAN? MARKET CONTEXT & ANALYSIS
🎯 Real-Time Index Snapshot (Sep 05, 2025)
Current Price: 43,002.00 (+423.82 / +1.00% 📈)
Monthly Gain: +5.48% (Strong momentum ✅)
Yearly Gain: +18.24% (Bullish trend intact ✅)
All-Time High: 43,876.42 (August 2025 🏆)
😰😊 Market Sentiment: Fear & Greed Index
Current Reading: Greed (Score ~70/100) 😊
Momentum: Strong (Above 125-day MA) 📈
Volatility: Low to Moderate 😌
Safe Haven Demand: Low 🚫
Options Activity: Neutral 📊
✅ Fundamental Drivers (BULLISH CATALYSTS)
🏎️ Trade Policy Win: U.S. auto tariffs reduced to 15% (from 27.5%) - massive boost for Japanese exporters
💰 Wage Growth Breakthrough: Real wages turned positive (+0.5%) for first time since December 2024
💵 Investment Surge: $550B Japanese investments in U.S. projects announced
🌍 Global Liquidity Support: Fed rate cut expectations supporting risk assets
🏢 Corporate Strength: Toyota (+1.98%), Honda (+1.14%), and Mitsubishi UFJ (+0.93%) leading gains
⚠️ Key Risks (BE AWARE)
💴 Yen Appreciation Risk: Potential JPY strength if U.S. accelerates rate cuts
🎯 Inflation Pressure: Consumer inflation at 3.6% (above BoJ's 2% target)
📉 Mixed Economic Signals: Coincident index dropped to 113.3 (from 116.7)
📊 Technical Assessment
🎯 Trend Structure: Bullish above 41,500 support
📊 Momentum: Strong upward trajectory with occasional consolidation
🧱 Resistance Levels: 43,900 (Recent high), 45,000 (Psychological barrier)
🛡️ Support Levels: 41,800 (Strategy SL), 41,200 (Strong weekly support)
🌐 RELATED PAIRS TO WATCH
FX:USDJPY - Critical for exporter competitiveness
INDEX:NKY - Nikkei 225 futures correlation
SP:SPX - Global risk sentiment gauge
OANDA:EURJPY - Yen strength indicator
📊 BULLISH/BEARISH SCORECARD
Technical: 80% Bullish ✅ | 20% Bearish
Fundamental: 75% Bullish ✅ | 25% Bearish
Sentiment: 70% Bullish ✅ | 30% Bearish
Risk/Reward: 80% Favorable ✅ | 20% Unfavorable
OVERALL: 76% BULLISH ✅ | 24% BEARISH
👑 TRADER PERSPECTIVES
🎯 Retail Traders: Optimistic but cautious near ATHs. Watch for breakout above 43,900
🏦 Institutional Flow: Accumulating on dips, focusing on exporters and tech names
🇯🇵 Domestic Investors: Positive on wage growth and trade developments
✨ "If you find value in my analysis, a 👍 and 🚀 boost is much appreciated — it helps me share more setups with the community!"
⚠️ RISK DISCLAIMER
This idea is for educational purposes only. I am not a financial advisor. The "Thief Strategy" is a personal approach and may not suit all traders. Always conduct your own analysis and manage risk appropriately. Past performance doesn't guarantee future results. Trading CFDs carries substantial risk of loss.
#JP225 #Japan225 #NIKKEI #TradingSetup #SwingTrading #DayTrading #TradingStrategy #CFD #MarketAnalysis #TechnicalAnalysis #TradingView #ThiefStrategy #Bullish #Investing #Stocks #Finance