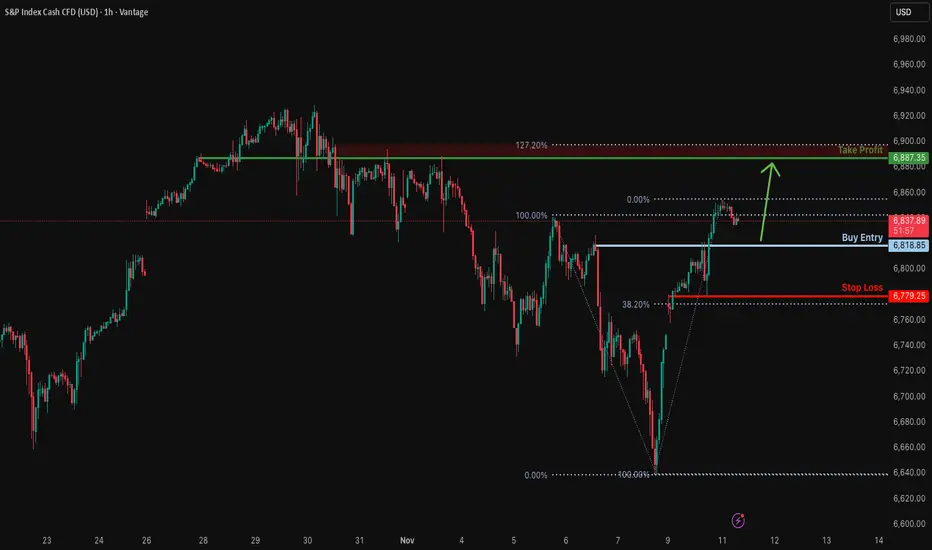
Bullish continuation setup?S&P500 is falling towards the support level, which is a pullback support and could bounce from this level to our take profit.
Entry: 6,618.85
Why we like it:
There is a pullback support level.
Stop loss: 6,779.25
Why we like it:
There is a pullback support that lines up with the 38.2% Fibonacci retracement.
Take profit: 6,887.35
Why we like it:
There is an overlap resistance that is slightly below the 127.2% Fibonacci extension.
Enjoying your TradingView experience? Review us!
Please be advised that the information presented on TradingView is provided to Vantage (‘Vantage Global Limited’, ‘we’) by a third-party provider (‘Everest Fortune Group’). Please be reminded that you are solely responsible for the trading decisions on your account. There is a very high degree of risk involved in trading. Any information and/or content is intended entirely for research, educational and informational purposes only and does not constitute investment or consultation advice or investment strategy. The information is not tailored to the investment needs of any specific person and therefore does not involve a consideration of any of the investment objectives, financial situation or needs of any viewer that may receive it. Kindly also note that past performance is not a reliable indicator of future results. Actual results may differ materially from those anticipated in forward-looking or past performance statements. We assume no liability as to the accuracy or completeness of any of the information and/or content provided herein and the Company cannot be held responsible for any omission, mistake nor for any loss or damage including without limitation to any loss of profit which may arise from reliance on any information supplied by Everest Fortune Group.
Trade ideas
Hellena | SPX500 (4H): LONG to max of wave "3" area of 6929.4.Good afternoon colleagues, it looks like the correction is ending and soon I expect wave “5” in the upward movement. Perhaps wave “4” will update the low of 6637.8 before the upward movement.
I expect to reach the maximum of wave “3” at 6929.4. Further we will observe the price behavior in this area.
Fundamental Background
The US stock market remains positive: business activity data showed a steady expansion, which strengthens confidence in corporate earnings.
Manage your capital correctly and competently! Only enter trades based on reliable patterns!

S&P 500 (SPX) Eyes Fresh All-Time High in Wave (5)The ongoing cycle in the S&P 500 Index (SPX), originating from the April 2025 low, continues to unfold as an impulsive structure. The advance to 6920.21 marked the completion of wave (3) within this impulse, as illustrated in the accompanying one-hour chart. Subsequently, the market entered a corrective phase in wave (4), which developed as a double three Elliott Wave pattern.
From the termination of wave (3), wave ((a)) declined to 6814.26, followed by a recovery in wave ((b)) to 6882.32. The Index then resumed its descent in wave ((c)), reaching 6763.11 and thereby completing wave W of a higher degree. A corrective rally in wave X ensued, peaking at 6829.78. Thereafter, the Index turned lower again, initiating wave Y as a lower-degree zigzag.
Within wave Y, wave ((a)) bottomed at 6707.51 and wave ((b)) rebounded to 6757.63. Wave ((c)) extended downward to 6630.72, finalizing wave Y of (4). The Index has since begun to rise in wave (5). However, a decisive break above the wave (3) high at 6920.21 remains necessary to invalidate the possibility of a double correction. From the wave (4) low, wave ((i)) is nearing completion. A pullback in wave ((ii)) is anticipated to correct the cycle from the November 8, 2025 low, likely unfolding in a 3, 7, or 11 swing sequence. In the near term, provided the pivot at 6630.72 remains intact, any pullback should find support within the expected swing structure, paving the way for further upside continuation.

A pullback may tell us moreAny pullback and then higher high likely means we are going to the upper BB again. A pullback that gets under today's low and 18ma would be very bearish. So we have to wait for a pullback. Gold may also pullback soon, and probably follows the general market. BTC still at resistance but could hit 107,500. Oil still consolidating.
The pullback will tell us more if and when it comes.

$SPX 1H – Testing Lower Boundary of Parabolic Channel $SP:SPXSP:SPX has pulled back to the lower blue curve, the parabolic channel support that has guided price for months.
Check daily and weekly charts as well.
We’re now at a critical inflection zone — buyers and sellers are battling for control. @SPX
Bounce Scenario: A successful defense here could trigger a short-term relief rally back toward the midline (dotted blue) — a classic mean-reversion move within the channel.
Breakdown Scenario: A decisive close below this curve on strong 4H or 1D momentum would signal a channel breakdown, potentially driving price toward the 6700–6650 demand zone.
This area will define whether the uptrend structure of the parabolic channel remains intact or transitions into a corrective phase.


USA S&P 500 IndexPrice has completed a clean sweep of sell-side liquidity and is now showing strong displacement toward the upside. The recent break in structure confirms short-term bullish intent.
If price returns to the fair value gap or discount zone, I’ll look for confirmation to enter in alignment with the intraday bullish flow.
My first target remains the internal liquidity zone, and the potential extended target is the previous day’s high where buy-side liquidity rests.

S&P 500: Q3 Earnings Surge Amid Rising RisksResilient Earnings Growth in a Challenging Environment
Honestly, even with all the warning signs flashing red, the S&P 500 just pulled off something impressive. Companies in the index posted 10.7% annual earnings growth in Q3 2025 - and that’s no small feat. It’s a real testament to how resilient U.S. businesses are right now, no matter what.
Four Quarters of Double-Digit Gains: A Rare Streak
That said, staying long in this market is getting trickier. The stakes are rising. Valuations are stretched, policy signals are mixed, and while earnings are strong, the margin for error is shrinking. It’s one of those moments where you have to respect the strength - but also stay sharp.
What stands out is this: we’ve now seen four straight quarters of double-digit earnings growth in the S&P 500 - something we haven’t seen since the post-COVID surge in 2021. Companies are still delivering, even amid inflation and high rates. In Q3 2025, 83% of firms beat EPS estimates , well above the 5- and 10-year averages. But the average surprise was just 5.3%, down from historical norms. Wins are frequent, but margins are narrowing.
Sector Heavyweights Drive the Rally-But at What Cost?
The bulk of the upside came from Financials, Tech, and Consumer Discretionary. JPMorgan NYSE:JPM , Apple NASDAQ:AAPL , Microsoft NASDAQ:MSFT - the usual suspects - carried the weight. The Magnificent 7 are doing all the heavy lifting, which makes the market more fragile. If one stumbles, the whole index gets affected. It doesn’t feel comfy to me.
Stretched Valuations Signal Vulnerability
We must honestly admit that valuations are stretched. The S&P’s forward P/E is 22.9 - considerably above the 5-year average of 19.9. We’re clearly pricing in even stronger earnings ahead, but here’s what really worries me: if growth falters, this market could snap back hard. Instead of a smooth landing, we might get a sharp correction. There’s just too much optimism already baked into valuations.
Beyond Earnings: Labor Market Cracks and Data Blackouts
What’s even more concerning is what’s happening off the earnings sheet. The prolonged government shutdown is disrupting key macro data releases, leaving investors flying blind. For most of 2025, the labor market was in a “no hire, no fire” phase. But that’s changing. Amazon NASDAQ:AMZN just cut 14,000 jobs . UPS’s headcount is down 48,000 year-over-year. Target, Paramount - all trimming staff. These no longer look like isolated moves, and they need more unbiased scrutiny and sober projections.

SPX | Daily Analysis #12 - 10 November 2025Hello and Welcome Back to DP,
Review and News:
Last week was quite eventful. The index plunged toward the 6,640 area before a sharp rebound—helped in part by a series of market-friendly statements and tweets from former President Trump, which appeared to lift sentiment. Despite trading down more than 1.3% intraday, the market recovered impressively and ultimately closed the session in the green.
This week, investors will be watching closely to see whether Trump continues to influence sentiment with further comments or appearances that could help fuel market volatility and optimism. The shutdown remains at the center of U.S. politics. The Senate has advanced a temporary funding bill extending federal funding through January and reversing some layoffs, but final approval by the House and the President’s signature is still pending. Until a resolution is reached, uncertainty will linger across markets and public services.
The October Consumer Price Index (CPI) report—typically one of the most closely watched inflation indicators—is likely to be delayed due to the ongoing federal government shutdown. The lack of fresh data is creating a “data fog” for policymakers and traders alike.
Technical Analysis:
🟩 Demand Zones (Support Areas)
6,735 – 6,748 region
Multiple touches and strong buying reaction.
Large bullish candles emerged after price retested this area → indicates strong institutional demand.
It’s the nearest demand and acts as immediate support.
If broken, next possible downside continuation zone would be near 6,700 – 6,710.
Lower demand extension (6,730 – 6,740)
Good confluence with volume spike at lows → buyers defended this region before a sharp move up.
🟥 Supply Zones (Resistance Areas)
6,813 – 6,834 region
Clear previous consolidation before a breakdown.
This area now acts as a major supply / resistance zone.
Expect sellers to step in if price retests this zone — first test may trigger rejection.
It’s aligned with a local structure high; several long upper wicks in the past confirm supply pressure.
Above 6,834 → potential next supply
Around 6,850 – 6,860 (top of previous distribution).
Disclaimer:
This content is for informational purposes only and does not constitute financial or investment advice. © DIBAPRISM
Amir D.Kohn

Battle at the 18maSPX futures gapped up and got to the 18ma area. If we close below the 18 today it would likely be bearish, and a close above would be likely bullish. There's a gap on futures which may get filled. Gold had a nice bounce but it's also testing it's 18ma resistance here. BTC is at resistance. Oil is holding support at around 60 dollars.

US500 Intraday Technical Analysis📊 US500 Intraday Technical Analysis - 10 Nov 2025
S&P 500 at 6,792 (4:45 PM UTC+4) — Major breakout setup with confluence
━━━━━━━━━━━━━━━━━━━━━━━━━━━━━━━━━━━━
🔍 MARKET STRUCTURE
🔸 Wyckoff Phase D re-accumulation; Dow Theory primary uptrend intact
🔸 Gann Square-of-9 targets: 6,950 (resistance) / 6,650 (support)
🔸 Elliott Wave (3) extension in progress toward 6,950-7,050
━━━━━━━━━━━━━━━━━━━━━━━━━━━━━━━━━━━━
📈 TIMEFRAME MATRIX
Daily (1D): Rising channel 6,700-6,900; RSI 62 (bullish); Ichimoku cloud support 6,550
4H: Broadening wedge 6,750-6,900; EMA21>EMA50>EMA200 (golden cross); VWAP 6,680
1H: Cup-and-handle pattern; BB expanding; VWAP slope bullish
30M: Symmetrical triangle 6,780-6,850; hidden bull divergence on RSI; volume contracting
15M: Bull flag above 6,790; Tenkan>Kijun bullish; stochastic reset ready
5M: Falling wedge retest 6,800; hammer shows demand; watch false breakout
━━━━━━━━━━━━━━━━━━━━━━━━━━━━━━━━━━━━
🎯 PRIMARY LONG (HIGH PROBABILITY)
Entry: 6,790-6,820 (flag support + VWAP confluence)
SL: 6,750 (below triangle base)
TP1: 6,880 (+90 pips)
TP2: 6,950 (+160 pips — channel resistance)
TP3: 7,050 (+260 pips — harmonic extension)
Confirmation: RSI >55, volume +20%, VWAP holding
⚡ MOMENTUM SCALP
Add above 6,950 ONLY if RSI >65 + volume surge; trail stop 6,920
🔻 REVERSAL SHORT
Entry: 6,950-7,000 (supply resistance)
SL: 7,050 (above wedge)
Targets: 6,900 → 6,820 → 6,750 (Gann support)
Trigger: Bearish engulfing + RSI divergence on 5M/15M
━━━━━━━━━━━━━━━━━━━━━━━━━━━━━━━━━━━━
🚨 BREAKOUT ALERTS
✅ BULL: 1H close >6,950 confirms breakout → target 7,150; move SL to BE+25
✅ BEAR: 1H close <6,780 with volume → retest 6,650 cloud support
━━━━━━━━━━━━━━━━━━━━━━━━━━━━━━━━━━━━
📊 INDICATOR SNAPSHOT
BB Squeeze (30M) expanding | MACD histogram positive | VWAP slope up | EMA21 = trigger line | Hidden bull divergence confirmed on RSI
⚠️ PATTERN RECOGNITION
Harmonic Bat PRZ: 7,050 | Rising Wedge failure <6,790 = Wyckoff spring | H&S risk if 6,700 breaks | Bull trap risk above 6,950 without volume
📈 TIMING & VOLATILITY
Gann 90° window 21:00 UTC (US close) | ATR(14) ≈100 pts | Earnings whispers elevate risk | Risk ≤1% per setup; lock TP1; avoid chasing sub-avg volume
Educational analysis only. Follow your plan, manage risk, adapt to live price action.
━━━━━━━━━━━━━━━━━━━━━━━━━━━━━━━━━━━━
S&P long amid positivity on US Gov shutdownPossibly long on S&P as positivity around the potential reopening of the US government.
Markets gap higher Sunday open on the news and provides a good area to trade off.
4hr chart
- Rejected off fib retracement
- Broken counter trendline and resistance
- Fill of gap and retest of trendline provides good area of support
Would require confirmation on lower TF breakout
Caution around earnings and missed data to be released upon the government reopening.

Relief Rally or False Start? | SPX500 Faces Crucial 6814 BarrierSPX500 – MARKET OUTLOOK | Bullish Bias Above 6814 🇺🇸
Global markets opened the week higher as optimism grows over a potential end to the U.S. government shutdown, boosting sentiment across major indices.
Above 6814: Bullish continuation toward 6842 → 6877 → 6904.
Below 6755: Bearish correction possible toward 6725 → 6706.
Pivot: 6814
Support: 6755 · 6724 · 6706
Resistance: 6842 · 6877 · 6904
SPX500 stays bullish while above 6814, but a confirmed close below 6755 would signal a short-term bearish correction toward 6725.

SP 500 long after correctionSP 500 after new price highs It's making a new healthy correction.
-It's not sure yet If the SP 500 will go lower than this support level, most probably we will see it tomorrow or next week It's also probably that market makers will start soon to buy the dip.
-If the price will go lower than this support level we should check to enter long there with a SL as showed in the chart.
Important: Carefully at this price market makers could open a long order, anytime and the price will go aggressively up!!!1

US 500 - Has All the Good News Been Priced?After a volatile and nervy 5 days for US stock indices the week ended on a slightly more stable and positive footing.
In relation to the US 500 index this volatility saw it open on Monday November 3rd around 6885, trade down to a low of 6633 early on Friday November 7th, before rallying by over 1% late in the session to close the week at 6742. The driver for the rally was news that Democrats and Republican lawmakers had restarted negotiations to try and resolve what has become the longest US government shutdown in history.
This shutdown has been reported by Bloomberg to be costing the US economy around $15 billion per week in lost productivity and has stopped the release of key US economic data readings, leaving Federal Reserve (Fed) policymakers in the dark regarding the health of the US labour market (Non-farm Payrolls) and the direction of inflation (CPI/PPI/PCE). Two areas which are crucial in helping them decide whether they have room, or the need to cut interest rates again at their next meeting in December.
Perhaps unsurprisingly, after a jittery week where the lofty valuations of AI firms were called into question and weighed on the price of the US 500 index, traders may now be looking at whether a resolution to the shutdown, which would restart the economic data flow again ahead of the Fed’s next rate decision on December 10th could be possible, bringing with it a potentially much needed boost to flagging sentiment.
On Sunday, traders received the news that the Senate had moved closer to an agreement, an update which has helped the US 500 to register an early gain of 0.5% (6790 at 0700 GMT) to start this new trading week. However, even if the agreed bill is eventually passed by the Senate, it must be approved by the House of Representatives and signed by President Trump (Reuters), meaning there could be more volatility ahead for the US 500.
Technical Update: Conflicting Signals Within Weekly & Daily Perspectives
Since the October 30th all-time high at 6925, the US 500 index has slipped just over 4.2%, reflecting an unwind of potentially over-extended upside conditions.
Looking at the charts there appears to be conflicting technical signals between the weekly and daily perspectives at present, leaving the directional bias uncertain heading into the new week.
Upcoming sessions could offer clarity on whether the constructive themes emerging on the daily chart or the possibly negative developments evident in the weekly view may take control.
Weekly Chart – Potential Negative Outlook?:
Over the past three weeks, a possible Evening Star pattern has emerged on the weekly chart, a potentially negative development. Last week’s price weakness may have completed a sentiment shift, and if downside momentum builds, it could lead to further declines in the sessions ahead.
It remains to be seen whether this leads to further price weakness, but downside pressure may now build. If developed further, breaks below support at 6503, the October 2025 low could materialise, opening the door to a deeper phase of weakness toward 6214, a level equal to the August 2025 low, potentially even 6105, the 38.2% Fibonacci retracement of the April to October 2025 rally.
Daily Chart – Potential Positive Sentiment Shift?:
Following the recent sharp price decline, the daily chart presents a dilemma for traders, especially against the backdrop of a potentially negative weekly setup. Friday’s session initially extended recent downside moves but found support at 6647, the 38.2% Fibonacci retracement of the April to October rally. From there, fresh strength emerged, and the session closed near its opening level at the upper end of the day’s range.
Candlestick analysis suggests a potentially positive Dragonfly Doji has formed, hinting at an attempt to resume price strength. Confirmation is key, a positive candle on Monday, seen with a close above todays 6769 opening level, would offer weight to this pattern.
While not a guarantee of further upside, such activity might also see a close above resistance at 6779 (half the latest decline) a level at present being tested (0700 GMT), to potentially suggest a retest of 6925, the October 30th high.
Initially it is unclear whether the weekly or daily outlook will gain the upper hand in the US 500 index, but next week’s price action, especially the moves on Monday, could be important.
With the weekly chart hinting at a negative reversal risk and the daily chart showing signs of potential stabilisation, even possible positive risks, Monday’s candle direction may offer clues, and traders may be watching closely for evidence of the next directional themes.
The material provided here has not been prepared accordance with legal requirements designed to promote the independence of investment research and as such is considered to be a marketing communication. Whilst it is not subject to any prohibition on dealing ahead of the dissemination of investment research, we will not seek to take any advantage before providing it to our clients.
Pepperstone doesn’t represent that the material provided here is accurate, current or complete, and therefore shouldn’t be relied upon as such. The information, whether from a third party or not, isn’t to be considered as a recommendation; or an offer to buy or sell; or the solicitation of an offer to buy or sell any security, financial product or instrument; or to participate in any particular trading strategy. It does not take into account readers’ financial situation or investment objectives. We advise any readers of this content to seek their own advice. Without the approval of Pepperstone, reproduction or redistribution of this information isn’t permitted.

SPX: AI valuation fears grip marketsWithout official US macro data, investors turned their eyes to AI valuations, considering its strong growth during the past years. Words like “AI bubble” are often used in the news in order to explain the current fear among investors regarding valuations of tech companies which are reaching historically highest levels. CEOs of largest US investment banks are openly speaking about expected corrections in the future period, of 10% to 20%, while the International Monetary Fund also expressed its concerns regarding such a course of action in the coming period. Moreover, there has also been the news spread that the most famous so-called “Big short” investor, Michael Burry, placed bets against Nvidia and Palantir, currently two most valued companies in the field of tech industry. It should be also noted that there are analysts and investors who see this short correction as a good buying opportunity.
For the second week in a row, US equity markets are in a corrective mode. The S&P 500 reached its lowest weekly level on Friday at 6.640, however closed the week a bit higher, at 6.728. The performance of companies included in the index is mixed. On one hand, Amazon had a very good week after quarterly results. Its cloud unit, AWS, delivered 20,2% y/y growth in revenue, surpassing estimates. The company announced a multiyear deal with OpenAI, of around $38B, and a rise in its full-year capex outlook to $125B. On the opposite side was Nvidia, which entered into corrective mode, due to concerns of high valuations, of 7,2% w/w. Tesla was also traded lower by 5,8%. Overall, semiconductor companies closed the week lower and were mostly driving the S&P 500 lower.
CEOs of large banks are openly commenting that the volatility should be expected in the coming period, as well as some corrections in valuations. This should be taken into account in the coming period. Certainly, some investors will see these corrections as buying opportunities.

Investing in US vs China markets From a Singaporean who invest in both the US and China markets -
SGDHKD - since Jan 2025 it is up almost 5%
that means - your 1000 sgd is worth 5000HKD, you buy more units with the same capital
So market up 34% plus 5% forex gain - you are up almost 40% ROI
USDSGD - since Jan 2025, it is down almost 5%, you buy lesser units with the same capital
So market up 14% less 5% forex risk , that leaves you with about 9% ROI
Diversification matters and it is not to say stop investing in US market and transfer all funds to HK market or vice versa. There are companies with excellent growth opportunities like the magnificent 7 companies (less Tesla) that are fairly hard to replace globally. Likewise, in China, nobody uses any other apps more than Tencent which makes the latter a must have stock for its dominant position (plus China ban FB entry into China).
Two very different markets that operates on its own unique dynamics so it is good to have positions in both companies (and many more)
I have also indicated the 20% crash from peak for both markets if it does crash in 2026 as many gurus (usually at end of year) starts to predict market moves. Will it ever happens ? Nobody knows but rather than worrying , it is wiser to manage your own portfolio properly!
A few simple rules -
1) Avoid being overly greedy - To not to be greedy requires tons of discipline and as humans , it can be hard sometimes. If you had to punt, make sure it is 1% of your investable capital ONLY.
2) Time in the market NOT Timing the market - I had tried the latter years ago hoping to ride the bandwagon of success faster only to fall down the hills miserably.
3) ALWAYS have a Stop loss in place - For me, currencies, commodities, crypto ,etc - I ensure position size is manageable and shift my profits to protect my gains and have a SL in place.
4) Frequency of trade - If you go LONG on crypto and you got stopped out, the tendency to take revenge is HIGH much like the gambler in the casino. So , this rule forbids you to enter another trade within the week if you are stopped out. This stoppage allows you to cool down and manage your roller coaster emotions better. More often than not, on hindsight, it is a smart move.
5)Take calculated risks - From my grandfather days to current , I have not seen much changes in the education system in terms of financial literacy. I am no scholar so I do not understand why. Churning out employees from the schools does not seems like a smart moves to me. Costs of living from houses to food to transport will inevitably increases year on year and your wages has to play catch up. It becomes extremely stressful for those who are not in the high income category like AI or machine learning, etc but choose to go to say, arts, humanities, hospitality,etc.
No matter how small your income is, start investing early in your career. Never mind if it is 100 as base capital. And that is why I like ETFs and with fractional shares now, it is also possible to buy in smaller amounts of the company shares. Relying on bank interests will only erode your money with inflationary pressures.
Part 2 coming ...........

The most important macro chart you've ever seen. For the entire history of the SPX it has been trading max and low limits in an ascending wedge going back to the high and low of the Great Depression. We are currently slightly over the macro top trend with retail all in and influencers calling for higher targets. While it is possible that we rally, invalidating bearish divergence on the 3 month time frame is highly unlikely.
Put simply, inflation is high, retail is broke, and there is no logical reason for institutional investors to be holding or buying here as there is a price at which there will be no exit liquidity because no one will be available to purchase stocks and other assets from smart money at higher prices. We already have weekly RSI in overbought status currently.
We could invalidate 3 month divergence theoretically, but a liquidity crisis coupled with high inflation seems like the move over trend is bait to keep retail in a perpetual state of buying dips as investment firms slowly sell into their FOMO (fear of missing out.) It is, not only logical to take profits at these highs; it is imperative for anyone looking to preserve their funds until there are much lower prices.

THESE PATTERNS DONT BREAK ABOVE EASILY, CORRECTION AHEADWatch for a sustained correction between the 27th October top until March 2026.
Trade safe, good luck.

BUY AND HOLD UNTIL OCTOBER 2025Price is scheduled to break above the current high for a 7-month run, price top is expected between 6588 and 6680 range for a steep correction. Tariffs and recession chants will have their day but history shows post war cycles never go south.
Trade safe, good luck

S&P 500 Technical & Fundamental Outlook — Week of Nov 10–14 2025Price is pushing back into a key trendline / resistance zone after bouncing off 6,550–6,600 last week. This area between 6,780–6,830 is the decision point. We either break through and resume the trend higher, or this bounce gets sold into and we rotate back lower.
Key Levels
6,780–6,830: Main resistance. Trendline + prior structure. This is where direction gets decided.
6,922–6,940: If we break above the zone above, that’s the next upside target and potential trend continuation.
6,659: First downside support if price rejects this trendline.
6,550: Major support. If this goes, momentum shifts bearish.
Trend Context:
Bigger trend still leans bullish overall, but in the short-term price is still correcting until we reclaim and hold above the resistance zone.
Trade Path Scenarios
Upside:
A break and hold above 6,830 opens the move back toward 6,922 → 7,009. Best setup is buying the retest, not the breakout spike.
Downside:
If price rejects the 6,780–6,830 zone, look for a pullback toward 6,659.
Break 6,659 → continuation lower to 6,550.
Break 6,550 → bigger shift in structure and sentiment.
Macro This Week (U.S. Focus)
This is inflation week, meaning the market will likely be quieter early and then expand in volatility Thursday–Friday.
Day Focus
Wed FOMC Waller speaks — tone will matter
Thu CPI (core + headline) + Jobless Claims → Main market mover this week
Fri PPI + Retail Sales confirm or reject the CPI move
Key point:
Market direction this week will follow CPI first, then PPI / Retail for confirmation.
Current Market Tone
Market is still split: AI / tech strength vs weakness in broader sectors.
Last week’s pullback came from valuation pressure and softer labor tone.
Traders are waiting for confirmation on whether inflation is still cooling.
Breadth remains weak, meaning moves can be sharp once the trendline resolves.
Plan Going Into the Week
Wait for price to show its hand at 6,780–6,830.
Reaction Trade Bias
Hold above 6,830 Long toward 6,922 → 7,009
Reject at the zone Short back to 6,659
Break 6,659 Short continuation to 6,550
Break 6,550 Trend turns heavier to the downside supported by bearish news on growth

Evolution and Growth of the Hedge Fund Industry1. Origins of Hedge Funds (1940s–1960s)
The concept of hedge funds began in 1949 when Alfred Winslow Jones, a sociologist and financial journalist, launched the first modern hedge fund. Jones introduced the revolutionary idea of combining long and short positions to hedge against market fluctuations, aiming to reduce risk while maximizing returns. He also implemented performance-based fees, taking 20% of profits, a structure that became standard across the industry.
Jones’ approach—using leverage, short selling, and active management—distinguished his fund from traditional mutual funds, which were restricted by regulations and passive investment mandates. His strategy sought “absolute returns” regardless of market direction, laying the foundation for modern hedge fund philosophy.
Throughout the 1950s and 1960s, hedge funds remained relatively obscure, operating primarily as private partnerships for high-net-worth individuals. Their secrecy and exclusivity contributed to an aura of mystery that persists even today.
2. Expansion and Innovation (1970s–1980s)
The 1970s marked a period of economic volatility, including oil shocks, inflation, and market instability. These conditions provided fertile ground for hedge funds, which thrived on flexibility and alternative strategies. During this era, funds began to diversify beyond simple long-short equity plays into macro strategies, arbitrage, and event-driven investing.
The 1980s saw an acceleration of growth, largely driven by financial deregulation, advances in technology, and the rise of institutional investors. Hedge funds started attracting endowments and pension funds seeking diversification and higher returns. Managers like George Soros and Julian Robertson became iconic figures. Soros’ Quantum Fund famously made $1 billion by shorting the British pound in 1992, an event that showcased the power of hedge funds in global finance.
Hedge funds also began to operate across borders, benefiting from globalization and the liberalization of capital markets. Their ability to move swiftly in and out of markets made them powerful players in global finance, influencing currencies, interest rates, and stock indices.
3. Institutionalization and Mainstream Growth (1990s)
The 1990s were a turning point when hedge funds transitioned from exclusive private partnerships into an institutionalized investment industry. Large investors—such as university endowments, foundations, and pension funds—began allocating significant capital to hedge funds as part of diversified portfolios.
The proliferation of new strategies defined this decade. Hedge funds expanded into convertible arbitrage, fixed income arbitrage, global macro, distressed securities, and emerging markets. This diversification not only attracted new investors but also mitigated risks by spreading exposure across multiple asset classes.
The 1990s also brought increased attention to hedge funds’ impact on financial markets. The collapse of Long-Term Capital Management (LTCM) in 1998 highlighted both the sophistication and fragility of hedge fund strategies. LTCM’s use of massive leverage and complex derivatives led to a near-systemic crisis when markets turned against it. The U.S. Federal Reserve intervened to organize a bailout, illustrating hedge funds’ growing systemic importance.
Despite this setback, the industry continued to grow. Hedge funds became symbols of financial innovation and intellectual talent, often recruiting PhDs, mathematicians, and computer scientists to develop quantitative and algorithmic models that enhanced investment precision.
4. The Boom Years (2000–2007)
The early 2000s were the golden age of hedge funds. The industry’s assets under management (AUM) grew exponentially—from around $500 billion in 2000 to over $2 trillion by 2007. This growth was fueled by several factors:
Market turbulence following the dot-com crash increased demand for non-traditional investments.
Low interest rates and easy credit encouraged the use of leverage.
Institutional acceptance expanded, with funds-of-funds acting as intermediaries for smaller investors.
Globalization and technology enabled sophisticated strategies across markets and asset classes.
Hedge fund managers such as John Paulson, Ray Dalio, and David Einhorn became household names, with funds generating outsized returns. The diversity of strategies—from statistical arbitrage to credit default swaps—helped hedge funds outperform traditional asset classes.
However, the industry’s success also brought scrutiny. Critics argued that high fees, secrecy, and leverage created systemic risks. Regulators began exploring ways to increase transparency and oversight.
5. The Global Financial Crisis and Aftermath (2008–2012)
The 2008 global financial crisis was a defining moment for the hedge fund industry. Many funds suffered significant losses due to market collapses and liquidity freezes. However, hedge funds fared better than traditional asset managers overall, as their flexible strategies allowed quicker adaptation to market turmoil.
The crisis reshaped the industry in several ways:
Regulatory oversight increased, particularly through the Dodd-Frank Act in the U.S., which mandated registration, disclosure, and risk reporting.
Investor demands shifted toward transparency, liquidity, and risk management.
Fund closures and consolidations occurred as smaller or over-leveraged funds failed to recover.
Despite short-term setbacks, the post-crisis period laid the groundwork for a more stable, professionalized, and transparent hedge fund ecosystem.
6. Maturity and Technological Transformation (2013–Present)
In the 2010s and beyond, the hedge fund industry entered a mature phase marked by both stability and competition. Assets under management exceeded $4 trillion globally, with thousands of funds operating across diverse strategies.
The rise of quantitative funds and machine learning-driven strategies revolutionized the landscape. Firms like Renaissance Technologies, Two Sigma, and AQR Capital Management demonstrated how big data, artificial intelligence, and algorithmic trading could generate alpha with minimal human intervention.
Simultaneously, hedge funds faced new challenges:
Fee pressure due to underperformance relative to benchmarks.
Competition from passive investing (ETFs and index funds).
Demand for ESG (Environmental, Social, and Governance) integration as investors prioritized sustainability.
Regulatory constraints and increased compliance costs in multiple jurisdictions.
Yet, hedge funds continued to evolve. Many adopted hybrid models, blending traditional discretionary investing with automated systems. Others expanded into private credit, venture capital, and digital assets, reflecting their adaptive DNA.
7. Globalization and the Future Outlook
Today, hedge funds are an integral part of the global financial ecosystem. They operate across continents—from New York and London to Singapore and Hong Kong—serving a diverse investor base that includes sovereign wealth funds, pension funds, and family offices.
The future of hedge funds lies in innovation and adaptability. Artificial intelligence, blockchain, and decentralized finance (DeFi) are expected to reshape strategies, data analytics, and operational efficiency. Moreover, the increasing focus on sustainability and impact investing suggests a new generation of “green hedge funds” that align profit motives with ethical imperatives.
While traditional hedge fund models may face fee compression and rising competition, the industry’s agility ensures its relevance. The drive for alpha generation, risk diversification, and strategic flexibility remains the cornerstone of hedge fund success.
Conclusion
The evolution of the hedge fund industry—from Alfred Winslow Jones’ experimental partnership in 1949 to today’s global network of multi-strategy investment giants—illustrates a story of innovation, resilience, and adaptability. Each era brought unique challenges and transformations, from the intellectual revolution of long-short strategies to the data-driven frontiers of algorithmic trading.
Despite cyclical setbacks, hedge funds have consistently evolved to meet changing market conditions and investor demands. Their journey underscores a central truth: the pursuit of absolute returns and risk-adjusted performance will always attract investors seeking to outpace the market. The hedge fund industry, now a mature yet dynamic force, continues to shape the future of global finance—balancing secrecy with sophistication, and innovation with responsibility.

SPX about to come crashing down hard. Buckle up.The parabolic growth curve that started almost 30 years ago in the US stock market is about to come to a dramatic conclusion.
We saw a test example of what happened in April when the market for the first time in 27 years broke through the parabolic growth curve, how quickly things just fell apart. Falling more than 10% in just a few days and then sharply rebounding to reclaim the parabolic growth curve.
Well, get prepared for an even more disorderly crash about to hit the market. We are for the second time in a year, right now losing the parabolic ascent.
No one actually believes the US economy is growing parabolically right? Even viruses don't achieve this level of "growth".
It's all built on a phony baloney house of cards called the US Dollar backed by nothing but the "full faith and credit" of the US. Well guess what? The credit of the US is constantly being downgraded by bond rating agencies. And we elected a leader who destroyed every other countries' faith in us. Consider poor Canada and the faith they have in us now. You might laugh and think these kinds of things are silly, but I promise you it's deadly serious. We have NOTHING but hot air backing the US dollar now because we have no faith and our credit is in the dumpster.
Also for comparison sake, I included the angle of growth (copy and pasted the small yellow line) that we had in the "raging" 1990s bull market. If you were alive during that time, the market was truly considered raging. But compare the angle of ascent to the last 6 months since Taco trump announced his worldwide agenda to destroy the US. The angle of ascent is almost pornographic compared to the 90s rager.
Parabolas don't unwind. They crash.
What other confluence do we have in the indicators to prior year crashes?
1) VIX 8day RSI achieved its lowest ever stochastic %D this summer, numbers 2 and 3 were 2007 and 2000.
2) P/E ratios are the highest they have ever been at 40+, only exceeded by one other time +44, just before the dot com crash.
3) 2y 10 y bond yield differential maintaining above .42% like every prior recessionary crash.
