Happy New Year S&P 500: Why I am BULLISH on Stocks for 2026.Hello There,
in the recent year, the S&P 500 has formed historical volatilities to the upside and downside while still sustaining the underlying trend. Several important factors drove the major price moves seen in the past year. Considering these fundamentals, I have detected important fundamental
Key stats
About SPDR S&P 500 ETF Trust
Home page
Inception date
Jan 22, 1993
Structure
Unit Investment Trust
Replication method
Physical
Dividend treatment
Distributes
Distribution tax treatment
Qualified dividends
Income tax type
Capital Gains
Max ST capital gains rate
39.60%
Max LT capital gains rate
20.00%
Primary advisor
SSgA Funds Management, Inc.
Distributor
ALPS Distributors, Inc.
Identifiers
3
ISIN US78462F1030
SPDR S&P 500 ETF Trust is an Exchange traded fund. The fund seeks to provide investment results that, before expenses, correspond generally to the price and yield performance of the S&P 500® Index. The S&P 500® Index is composed of five hundred selected stocks. SPDR S&P 500 ETF Trust was founded on January 22, 1993 and is headquartered in New York, NY.
Related funds
Classification
What's in the fund
Exposure type
Electronic Technology
Technology Services
Finance
Stock breakdown by region
Top 10 holdings

Looking like a reset higher until the morningWe should continue rallying into the morning and maybe more but I think by Tuesday we will see a reversal. Vix probably makes another divergent low. Gold looks like a C wave occurring. Oil is not clear. BTC may be finishing it's consolidation soon. Nat Gas filled it's gap.

SP500 Possible Wyckoff Distribution TopWyckoff Distribution is a key concept in the Wyckoff Method of technical analysis, describing the phase where large institutional investors quietly sell their holdings (distribute them) to retail traders after a strong uptrend, signaling an upcoming market reversal from bullish to bearish (a "markdo


SPY – What the Market Is Actually Doing Here on Jan 2 SPY already made its decision before the year ended — it just didn’t make it obvious.
The drop wasn’t aggressive. No panic, no liquidation candles. Instead, price slid lower, broke structure, and then went quiet. That’s usually the tell. When sellers are confident, price doesn’t need to rush.
On th

$SPY & $SPX Scenarios — Tuesday, Dec 30, 2025🔮 AMEX:SPY & SP:SPX Scenarios — Tuesday, Dec 30, 2025 🔮
🌍 Market-Moving Headlines
• Fed minutes day: Markets parse December FOMC minutes for confirmation on rate-path confidence and inflation risks.
• Housing and activity check: Home prices and Chicago PMI give late-cycle reads on demand and re

TA for SPY, NVDA, AAP, MSFT for Dec 3–6Price Action vs. GEX Reality
Intraday Playbook for SPY, NVDA, AAPL, MSFT (This Week)**
This post I focus on intraday trading for the current week, using:
* 15-minute charts for structure & execution
* Intraday GEX (0DTE / weekly positioning) for direction, pinning, and exits
This is not a swing thes

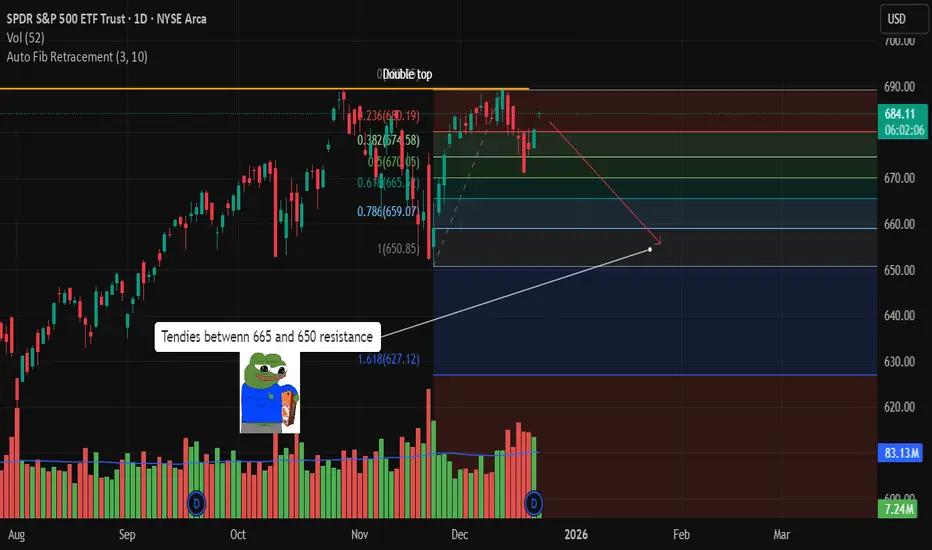
SHORT SPYShorting spy on a double top.
Bought 670 jan 9 puts.
Collect tendies between 665 and 650.
Good appetite.
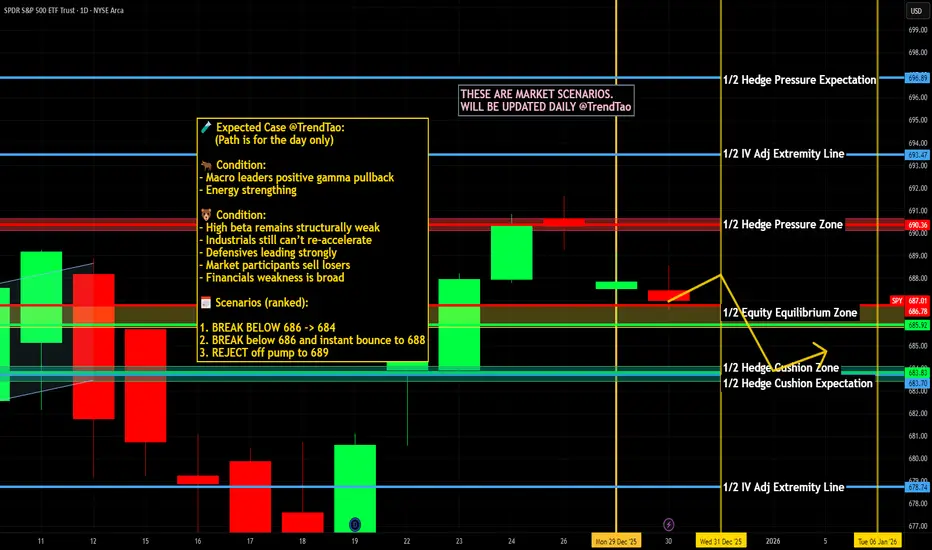
SPY Still Stuck in Gamma Compression. TA for Dec 30Why 687–689 Is the Decision Zone (Dec 30)
SPY remains locked in a tight range, and the reason is clear once you line up structure + GEX. This is not a trend environment yet — it’s dealer-controlled price action.
On the 15-minute chart, SPY already printed a downside BOS earlier, followed by a weak r

$SPY & $SPX Scenarios — Wednesday, Dec 31, 2025🔮 AMEX:SPY & SP:SPX Scenarios — Wednesday, Dec 31, 2025 🔮
🌍 Market-Moving Headlines
• Thin year-end liquidity: Last full trading day of the year — moves can look exaggerated on light volume.
• Labor data check-in: Jobless claims remain one of the few real-time macro reads as markets close out 2
See all ideas
Summarizing what the indicators are suggesting.
Oscillators
Neutral
SellBuy
Strong sellStrong buy
Strong sellSellNeutralBuyStrong buy
Oscillators
Neutral
SellBuy
Strong sellStrong buy
Strong sellSellNeutralBuyStrong buy
Summary
Neutral
SellBuy
Strong sellStrong buy
Strong sellSellNeutralBuyStrong buy
Summary
Neutral
SellBuy
Strong sellStrong buy
Strong sellSellNeutralBuyStrong buy
Summary
Neutral
SellBuy
Strong sellStrong buy
Strong sellSellNeutralBuyStrong buy
Moving Averages
Neutral
SellBuy
Strong sellStrong buy
Strong sellSellNeutralBuyStrong buy
Moving Averages
Neutral
SellBuy
Strong sellStrong buy
Strong sellSellNeutralBuyStrong buy
Displays a symbol's price movements over previous years to identify recurring trends.
Frequently Asked Questions
An exchange-traded fund (ETF) is a collection of assets (stocks, bonds, commodities, etc.) that track an underlying index and can be bought on an exchange like individual stocks.
SPY trades at 687.72 USD today, its price has risen 0.62% in the past 24 hours. Track more dynamics on SPY price chart.
SPY net asset value is 683.25 today — it's risen 0.55% over the past month. NAV represents the total value of the fund's assets less liabilities and serves as a gauge of the fund's performance.
SPY assets under management is 711.83 B USD. AUM is an important metric as it reflects the fund's size and can serve as a gauge of how successful the fund is in attracting investors, which, in its turn, can influence decision-making.
SPY price has risen by 0.18% over the last month, and its yearly performance shows a 17.05% increase. See more dynamics on SPY price chart.
NAV returns, another gauge of an ETF dynamics, have risen by 0.55% over the last month, showed a 3.06% increase in three-month performance and has increased by 17.53% in a year.
NAV returns, another gauge of an ETF dynamics, have risen by 0.55% over the last month, showed a 3.06% increase in three-month performance and has increased by 17.53% in a year.
SPY fund flows account for −14.00 B USD (1 year). Many traders use this metric to get insight into investors' sentiment and evaluate whether it's time to buy or sell the fund.
Since ETFs work like an individual stock, they can be bought and sold on exchanges (e.g. NASDAQ, NYSE, EURONEXT). As it happens with stocks, you need to select a brokerage to access trading. Explore our list of available brokers to find the one to help execute your strategies. Don't forget to do your research before getting to trading. Explore ETFs metrics in our ETF screener to find a reliable opportunity.
SPY invests in stocks. See more details in our Analysis section.
SPY expense ratio is 0.09%. It's an important metric for helping traders understand the fund's operating costs relative to assets and how expensive it would be to hold the fund.
No, SPY isn't leveraged, meaning it doesn't use borrowings or financial derivatives to magnify the performance of the underlying assets or index it follows.
In some ways, ETFs are safe investments, but in a broader sense, they're not safer than any other asset, so it's crucial to analyze a fund before investing. But if your research gives a vague answer, you can always refer to technical analysis.
Today, SPY technical analysis shows the buy rating and its 1-week rating is buy. Since market conditions are prone to changes, it's worth looking a bit further into the future — according to the 1-month rating SPY shows the buy signal. See more of SPY technicals for a more comprehensive analysis.
Today, SPY technical analysis shows the buy rating and its 1-week rating is buy. Since market conditions are prone to changes, it's worth looking a bit further into the future — according to the 1-month rating SPY shows the buy signal. See more of SPY technicals for a more comprehensive analysis.
Yes, SPY pays dividends to its holders with the dividend yield of 1.07%.
SPY trades at a premium (0.02%).
Premium/discount to NAV expresses the difference between the ETF’s price and its NAV value. A positive percentage indicates a premium, meaning the ETF trades at a higher price than the calculated NAV. Conversely, a negative percentage indicates a discount, suggesting the ETF trades at a lower price than NAV.
Premium/discount to NAV expresses the difference between the ETF’s price and its NAV value. A positive percentage indicates a premium, meaning the ETF trades at a higher price than the calculated NAV. Conversely, a negative percentage indicates a discount, suggesting the ETF trades at a lower price than NAV.
SPY shares are issued by State Street Corp.
SPY follows the S&P 500. ETFs usually track some benchmark seeking to replicate its performance and guide asset selection and objectives.
The fund started trading on Jan 22, 1993.
The fund's management style is passive, meaning it's aiming to replicate the performance of the underlying index by holding assets in the same proportions as the index. The goal is to match the index's returns.