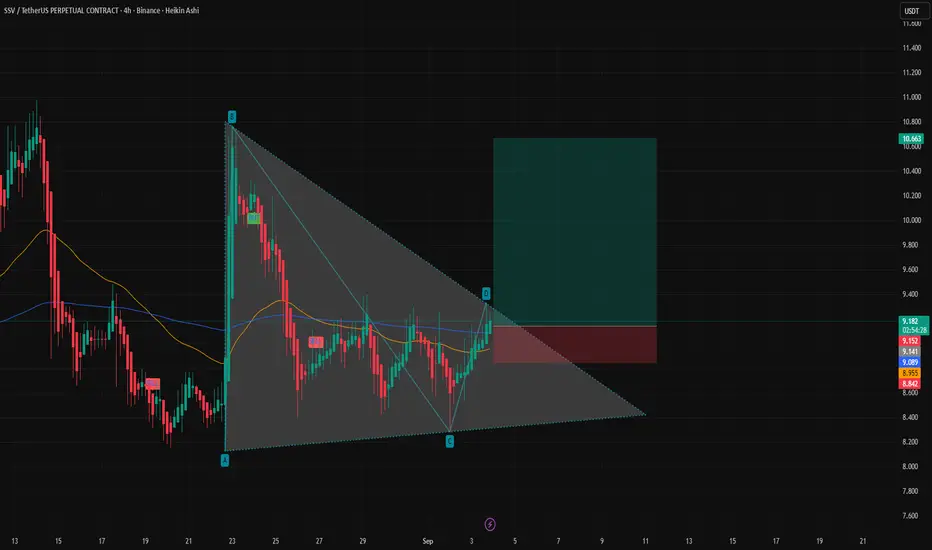
Technical Analysis (SSV/USDT – 4H)1. Pattern
The chart is showing a descending triangle / falling wedge structure (A–B–C–D).
Price has moved up strongly from point C → D, now testing the upper trendline resistance.
If breakout happens above 9.20–9.30, bullish momentum can accelerate.
2. Key Levels
Immediate Resistance: 9.20 – 9
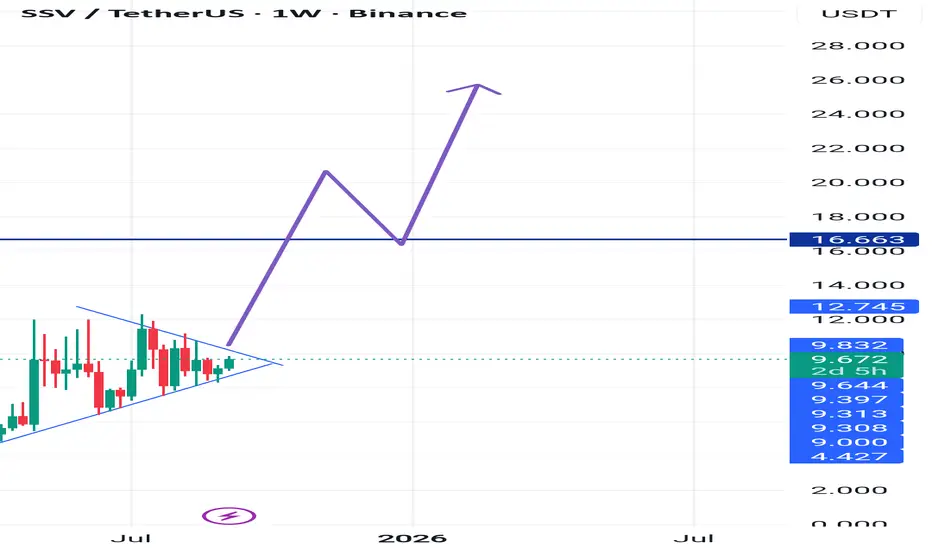
SSV continues to trade within a high timeframe equilibriumSSV continues to trade within a high timeframe equilibrium, with dynamic support and resistance levels gradually converging near the point of control. This compression has formed an apex zone where price action is coiling, setting the stage for a decisive breakout. Despite the tightening range, the
SSV (SPOT)BINANCE:SSVUSDT
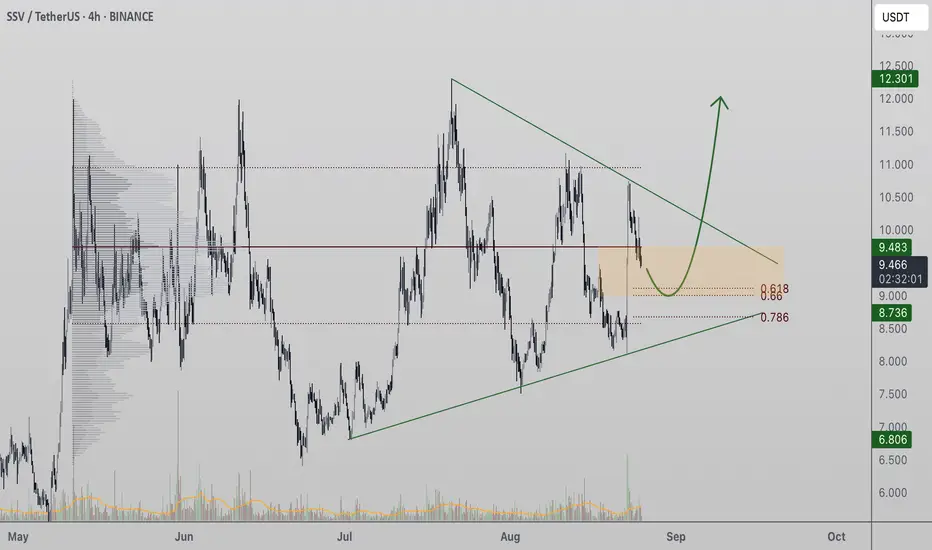
#SSV/ USDT
Entry range (8.60- 9.19)
SL 4H close below8.35
T1 11.90
T2 15.00
_______________________________________________________
Golden Advices.
********************
* collect the coin slowly in the entry range.
* Please calculate your losses before the entry.
* Do not ente

SSVUSDTBreakout the trendline and have a chance to go high and higher its your responsibility to buy or sell.

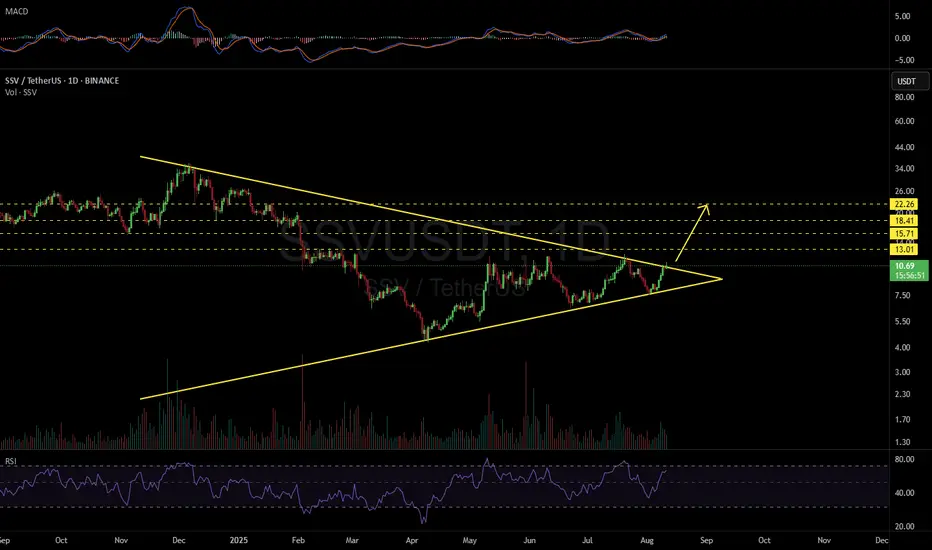
SSVUSDT 1D#SSV is on the verge of breaking out above the symmetrical triangle on the daily chart. If confirmed, the potential upside targets are:
🎯 $13.01
🎯 $15.71
🎯 $18.41
🎯 $22.26
⚠️ As always, use a tight stop-loss and apply proper risk management.
$SSV/USDT has broken out$SSV/USDT has broken out of a key ascending triangle on the daily chart, clearing resistance around $11.90 with strong momentum.
The breakout targets an 84% potential upside toward the $21+ zone.
As long as it holds above the breakout level, the trend remains bullish with further gains likely.

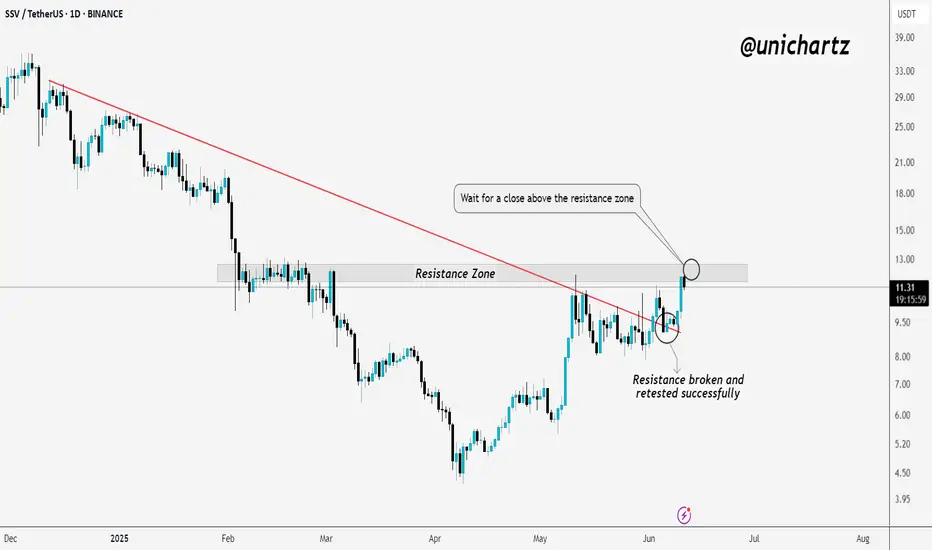
SSV | Bullish Market Structure Shift in PlayTSXV:SSV is showing strong bullish momentum. The key resistance line has been broken and successfully retested, confirming a shift in market structure.
Now, price is testing the major resistance zone. For further upside confirmation, it's important to wait for a clear daily close above this resist
SSV/USDTKey Level Zone: 8.000 - 8.700
HMT v8.1 detected. The setup looks promising, supported by a previous upward/downward trend with increasing volume and momentum, presenting an excellent reward-to-risk opportunity.
HMT (High Momentum Trending):
HMT is based on trend, momentum, volume, and market struc

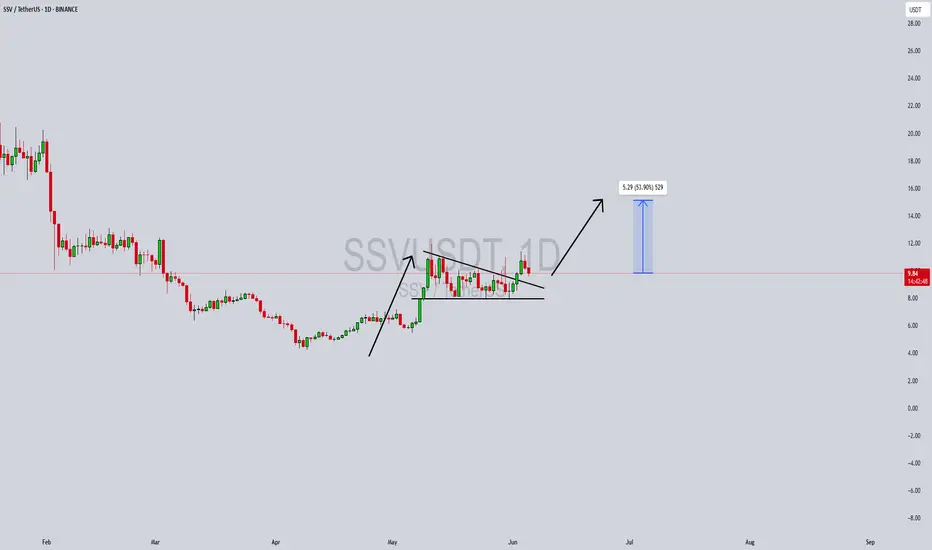
SSVUSDT Forming a Bullish PennantSSVUSDT is currently forming a bullish pennant pattern, which is typically a continuation formation that appears after a strong upward impulse. The pair recently experienced a significant breakout to the upside, followed by a consolidation phase forming a symmetrical triangle or pennant structure. W
See all ideas
Summarizing what the indicators are suggesting.
Oscillators
Neutral
SellBuy
Strong sellStrong buy
Strong sellSellNeutralBuyStrong buy
Oscillators
Neutral
SellBuy
Strong sellStrong buy
Strong sellSellNeutralBuyStrong buy
Summary
Neutral
SellBuy
Strong sellStrong buy
Strong sellSellNeutralBuyStrong buy
Summary
Neutral
SellBuy
Strong sellStrong buy
Strong sellSellNeutralBuyStrong buy
Summary
Neutral
SellBuy
Strong sellStrong buy
Strong sellSellNeutralBuyStrong buy
Moving Averages
Neutral
SellBuy
Strong sellStrong buy
Strong sellSellNeutralBuyStrong buy
Moving Averages
Neutral
SellBuy
Strong sellStrong buy
Strong sellSellNeutralBuyStrong buy
Displays a symbol's price movements over previous years to identify recurring trends.