STO/USDT (4H)A clear Double Bottom pattern is forming, and the rising volume confirms strong buying pressure — suggesting that a long entry can be taken now.
Price has broken above the neckline resistance around 0.169 – 0.170, showing potential for a bullish continuation.
🟢 Entry: Current levels (0.169 – 0.171)
🛡️ Stop Loss: Below 0.155
🎯 Targets:
TP1: 0.1835
TP2: 0.2000
The breakout with increasing volume supports the idea of a mid-term trend reversal.
#STO #USDT #CryptoAnalysis #DoubleBottom #TradingView #BullishSetup #Breakout #VolumeConfirmation
Trade ideas

STOUSDT Forming Bullish MomentumSTOUSDT is currently showing a bullish momentum pattern, signaling that buying pressure is building strongly across the market. The recent surge in trading activity reflects growing investor confidence as the pair gains traction among traders. With volume remaining steady and momentum indicators turning positive, STOUSDT looks primed for a potential rally that could yield 90% to 100%+ gains in the short to mid term.
This bullish formation suggests that the pair has likely completed its consolidation phase and is now preparing for a possible breakout. The price structure is aligning for continuation, with higher lows and strengthening volume confirming accumulation by smart money. If the breakout occurs above the key resistance zone, it could trigger a wave of bullish sentiment, leading to an accelerated move toward the next major targets.
Investors are showing renewed interest in STOUSDT due to its improving technical outlook and broader market optimism. As long as the bullish momentum sustains and volume continues to support the uptrend, this setup offers a strong opportunity for traders looking to capture potential upside growth. The momentum is clear — the bulls are taking control, and a sharp breakout could be imminent.
✅ Show your support by hitting the like button and
✅ Leaving a comment below! (What is You opinion about this Coin)
Your feedback and engagement keep me inspired to share more insightful market analysis with you!
STOUSDTBased on the setup and my analysis, it should go lower/bearish. Not sure when it will start, but it will
P.S. Do ur own research and analysis, don't follow blindly
Wed Oct 8 quick short on STO using PAR Wed Oct 8 quick short on STO using PAR ....Wait on 5 min minimum for confirmation of turn

STO/USDT THE FLY EFFECTSTO/USDT are in a trend, which can break.
We will follow the confirmations in the coming time frames.
Volume looks interesting.
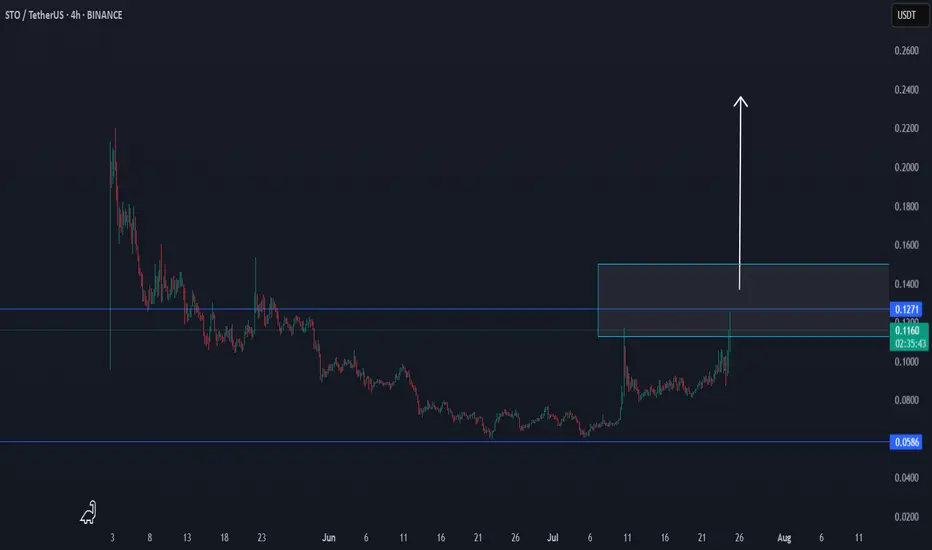
StakeStone, Falling Wedge & Easy 205% Profits PotentialIs it too early? It is never too early to be early. StakeStone started trading in early May, less than two months ago. The chart is young but the pattern is old; a perfect falling wedge.
There is a low 22-June and many pairs ended their correction on this exact day. StakeStoke broke out of the falling wedge pattern, based on an internal trendline, so there is already some signals favoring an up-move next.
Predicting the next move is not hard, up. What is harder is the timing, how long will it take for STOUSDT to start an upsurge? It is very close. It is so close now that I can say within days, or, I can also say that it is already growing because a low happened on the 22nd, but to say this we need confirmation.
The confirmation comes when prices move above 0.0750 and beyond.
This is a good chart. Very low risk with a high potential for reward. It is a good chart but remember that there is always risk involved. Market conditions can change, prices move down rather than up. If this happens, just wait patiently because a reversal is very close. This is only a warning, we are 100% bullish.
Thanks a lot for your support.
Namaste.

STOUSDT 4H#STO — Breakout Potential Building 🔍
#STO has been trading within a descending channel, reflecting a mid-term corrective structure.
Recently, the price bounced sharply from the channel’s lower boundary (📍yellow arrow), signaling potential bullish momentum emerging from this support zone.
📈 If the price breaks above the channel resistance, the following targets may come into play:
🎯 $0.0776
🎯 $0.0886
🎯 $0.0975
🎯 $0.1063
Indicators support the bullish case:
✅ RSI has reclaimed the 50 level, showing strengthening momentum
✅ MACD is showing early signs of a bullish crossover
⚠️ Note: If the breakout fails, price may continue consolidating or revisit lower levels.
Always use a tight stop-loss and apply proper risk management.

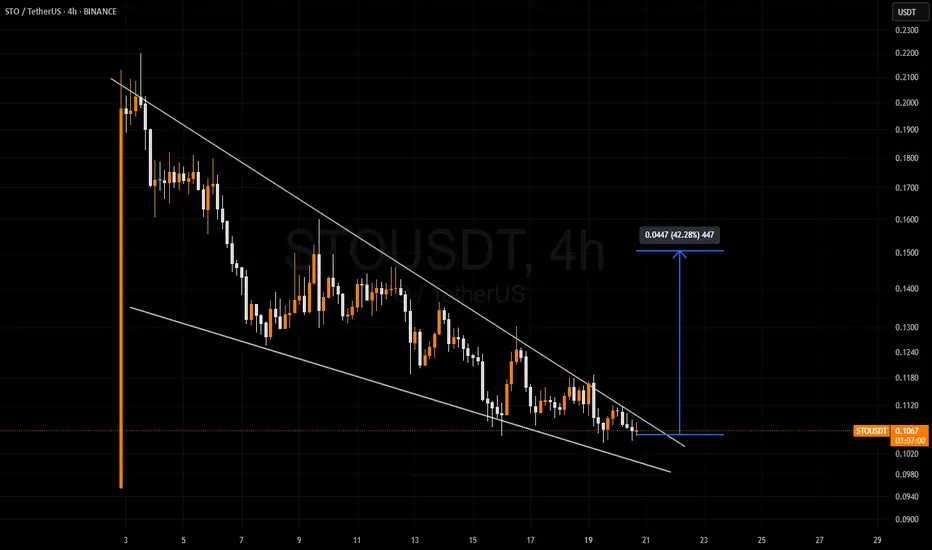
STOUSDT UPDATE
Pattern: Falling Wedge
Current Price: \$0.0693
Target Price: \$0.14
Target % Gain: 100.32%
Technical Analysis: STO is breaking out from a falling wedge pattern on the 12H chart, showing strong bullish momentum with an 8.62% gain today. Volume supports the breakout and the move is aiming for a potential 100% upside.
Time Frame: 12H

$STO is getting ready for a breakout!ASX:STO is getting ready for a breakout!
After a long downtrend, the chart has formed a clean falling wedge a classic bullish reversal pattern.
We’re now seeing a breakout attempt, and if momentum holds, we could see a sharp 40%+ move to the upside. 🚀
Keep an eye on this, it could move fast
BLUEBERRY:STOUSD BINANCE:STOUSDT

$STO/USDT Bullish Setup:$STO/USDT Bullish Setup:
Price is forming a descending triangle and is now testing the upper trendline — signs of possible breakout.
🔸 Key Support Zone at 0.1100:
This level has held multiple times, showing strong buyer interest.
🔸 Upside Target:
If price breaks 0.1150 with volume, a move toward 0.1650 is likely.
🔸 Risk Level at 0.1050:
If price drops below this, setup is invalid.
$NEIRO, SEED_DONKEYDAN_MARKET_CAP:PEOPLE , ECONOMICS:BOME , $MUBARAK, NYSE:AMP , EURONEXT:CVC , CRYPTOCAP:SYRUP , TSX:FTT , CRYPTOCAP:FXS , NASDAQ:POLYX , TSX:DF , ASX:KSM , $AIXBT, $JELLYJELLY, NYSE:DAR , $LAUNCHCOIN, $HIPPO, $GRASS, SGX:BBT , $SKYAI

potential continuationwait until bullish momentum crush the supply line.
then look for buy on pullback to the moving averages.

STO PERPETUAL TRADE ,Sold From $0.19100STO PERPETUAL TRADE
STO SELL SETUP
Currently $0.19100
Sold at $0.19100
(Trading plan If STO go up to $0.22
will add more shorts)
Expecting target $0.17200 OR DOWN
Incase of early exist will update this anaylsis
Its not a Financial advice

StousdtSto broke out a corrective bullish pattern after a huge impulsive move and could be followed by another major impulsive move, apply proper risk management

Cross-Chain Liquidity TailwindstakeStone’s infrastructure aligns with rising demand for modular DeFi solutions. Its SDK launch in Q2 2025 could catalyze developer adoption, boosting utility for STO

Tokenomics AdvantageOnly 6% of STO’s 1B supply is allocated to liquidity pools, creating scarcity as adoption grows. Community and ecosystem allocations (17.87% + 4%) incentivize long-term participation

Volume Surge on RetestsRecent retests of the 0.80–0.85 range saw a 25% spike in trading volume, indicating strong absorption of sell orders. This aligns with on-chain data showing large wallet accumulation

Airdrop-Driven DemandWith 7.85% of STO’s supply allocated to airdrops and incentives, short-term buy pressure is likely as participants hold tokens to qualify for rewards, reducing sell-side liquidity

RSI DivergenceA bullish divergence on the daily RSI (price lower lows vs. RSI higher lows) hints at weakening downward momentum. A breakout above the $1.20 resistance (January 2025 high) could trigger a 30-40% rally

Consolidation Near Key SupportSTO’s price is consolidating above the $0.85 support level, a critical zone tested twice in Q1 2025. Historical rebounds from this level suggest accumulation by institutional wallets, with rising volume signaling renewed interest

Institutional InterestWhale wallets (>100k STO) increased holdings by 12% in March 2025, coinciding with Gate.io’s perpetual listings. Open Interest for STO futures rose 18%, reflecting leveraged bullish bets.

Capital Efficiency BreakthroughStakeStone’s ZK-proof-based “liquidity multiplier” allows 1 ETH to collateralize multiple yield positions. If adopted, this could elevate STO’s valuation by addressing DeFi’s SGX:40B + capital inefficiency problem. Early testnet data shows a 3.5x efficiency gain

STO/USDT shows consolidation aboveSTO/USDT shows consolidation above 0.85support.RSIdivergencehintsataccumulation.Abreakoutabove0.85support.RSIdivergencehintsataccumulation.Abreakoutabove1.20 (Jan high) could target $1.60, aligning with April's airdrop events. Monitor BTC correlation.
