#STRK Why is Ready for a Bullish Surge..Falling Wedge Breakout:
The chart of #STRK/USDT showcases a classic falling wedge pattern, which has recently been broken to the upside. This breakout is a strong bullish signal, indicating that the downtrend is potentially over and a new upward trend could be beginning.
Key Support Levels:
The support level around $1.22, which has been tested multiple times, has held firm. This gives confidence that the downside risk is limited, making it a strategic entry point for this trade.
Bullish Price Action:
The recent price action has shown higher lows and higher highs, a clear indication of a bullish trend. This pattern suggests growing buying interest and a potential for continued upward movement.
Volume Confirmation:
An increase in trading volume during the breakout further validates the bullish move. High volume on the breakout confirms strong market participation and reduces the likelihood of a false breakout.
RSI Momentum:
The RSI is trending upwards and has crossed above the midpoint, indicating increasing bullish momentum. This suggests that the asset still has room to rise before hitting overbought levels, providing an attractive entry point.
Risk-Reward Balance:
With a target price of $2.107 and a stop-loss set at $0.907, this trade offers a clear risk-reward ratio. The potential upside is significantly higher than the downside risk, making this a well-balanced trade opportunity.
In conclusion, the combination of a falling wedge breakout, strong support, bullish price action, volume confirmation, and positive RSI momentum makes this an ideal moment to enter the STRK/USDT trade. Position yourself now to capitalize on this promising setup.
____
⚠️All trade ideas are published with a time delay. If you want to follow the trade in real time, please follow the link to our open copy trading account on Binance.
👉Our account with open trading, and all our other resources at this link:
https://linktr. ee/In_Trade_MLN
STRKUSDT.3L trade ideas

STRK long Idea I like the final structure that gave an exit to the top that before that was a triangle structure which means the last wave of the fall or rise in our case of the fall

Downtrend in STRK getting weak!STRK downtrend is weakening.
●Strk creating another Bull Div.
●soon Bull will be in power.
●Never ignore this project.
●Took SSL and creating the Bullish Div on Daily timeframe.
Above we have weekly FVG/SIBI.
●In future that SIBI will act ad support once it is flipped.


STRKUSDT | Change in Trend?Is this the bottom? STRKUSDT is showing a potentially game-changing head and shoulders pattern, and we've just seen an impressive 8H candle bounce off the resistance level!
Trade Setup
This setup looks incredibly promising, with the target price of 1.8 aligning perfectly with the head and shoulders pattern target. With a solid 3:1 risk-reward ratio, this trade is shaping up to be a fantastic opportunity.
Could this be the trend reversal we've been waiting for? Let's see how it plays out!

$STRK broke out this falling wedge pattern!IDX:STRK is breaking out of this falling wedge pattern and is currently retesting it.
Entry Point: Start accumulating once the price exceeds $1.228.
Targets: Midterm Goal: 60% increase
Long-Term Goal: 120% increase
Trading Options: STRK is available for trading in both spot and futures markets. You can purchase it on the spot market, or if you prefer to go long on futures, consider setting a stop-loss at $1.076.
Leverage: 3X to 5X
About
StarkNet is a permissionless, decentralized ZK-Rollup operating as an L2 network on Ethereum. It enables unlimited scaling for dApps while maintaining Ethereum's security and composability, using the STARK cryptographic proof system. StarkNet contracts and OS are written in Cairo, supporting scalable deployment for any business logic.
DYOR, NFA
#Crypto #altcoin

STRK local support Most altcoins have already hit resistance or range high, so it's quite normal that we're seeing minor rejections respectively
If we can hold the middle level of this range 1.24 to 1.20, I'm expecting a continuation to the upside
The significant support that we need to defend is 1.20 (high volume node)
Potential initial target - 1.50

#STAK/USDT#STAK
The price is moving within a channel pattern on a 1-day frame, which is a retracement pattern
We have a bounce from a green support area at 1.07
We have a tendency to stabilize above the Moving Average 100
We have an upward trend on the RSI indicator that supports the rise and gives greater momentum
Entry price is 1.20
The first goal is 1.53
The second goal is 1.72
The third goal is 1.93

STRK Trade Signa📢 **STRK Trade Signal**
📈 Market: Future & Spot
📊 Type: Long
🔹 Buy Zone: 1.272 (DCA: 1.199)
⛔️ SL: 1.099
🎯 Profit Targets:
🟢 TP1: 1.428
🟢 TP2: 1.542
🟢 TP3: 1.6
🟢 TP4: Will update later

STRKUSDT 1DKeep an eye on #STRK. It has broken the trend line on the daily time frame. Volume has increased. MACD and RSI are good. We expect a bullish rally soon. Enter to it, when #STRK breaks the resistance zone.
Targets are:
$1.650
$1.845
$2.040
$2.317
$2.670


STRK Striking a bullish scenarioSupport and Resistance Levels:
Primary Support: Located at $1.128.
Immediate Support: This is shown as a trendline moving upwards, intersecting current price levels around $1.20 to $1.28.
Weekly Resistance: Range from $1.33 to $1.40.
Primary Resistance: Located at $1.678.
Other Significant Levels:
$1.40 (Resistance)
$1.51 (Target after breakout)
$1.676 (Primary Resistance)
Indicators:
Stochastic RSI: Currently showing values of 54.37 and 46.95, indicating a neutral to slightly bullish momentum. If the %K line crosses above the %D line, it would suggest a stronger bullish signal.
Volume: CVD indicates healthy buying volume, supporting the potential for a breakout.
Trend Analysis:
The price has been in a consolidative phase within the weekly resistance range of $1.33 to $1.40.
The recent price movement shows an attempt to break out of this range.
If the price breaks above $1.40, it could signal a bullish continuation towards higher targets like $1.51 and $1.676.
Support Levels:
The primary support level at $1.128 is critical for maintaining the bullish outlook. A break below this could indicate further downside risk.
Immediate support is provided by an ascending trendline, which has been tested multiple times and is currently holding.
Resistance Levels:
Immediate resistance is at the weekly resistance zone ($1.33 to $1.40). A clear breakout above $1.40 is necessary for further bullish momentum.
The next significant resistance after the weekly zone is $1.51, followed by the primary resistance at $1.676 and $1.678.
Price Projections:
A successful breakout at $1.40 could propel the price towards $1.51 initially.
Further targets include $1.676 and $1.678 if bullish momentum sustains.
The chart suggests a consolidative phase with potential bullish breakout scenarios. Key levels to watch are $1.40 for breakout confirmation and $1.128 for support. The overall outlook remains bullish as long as the price stays above the immediate support trendline and primary support level at $1.128.
Important: Potential investors should carefully consider the risks involved in cryptocurrency trading.

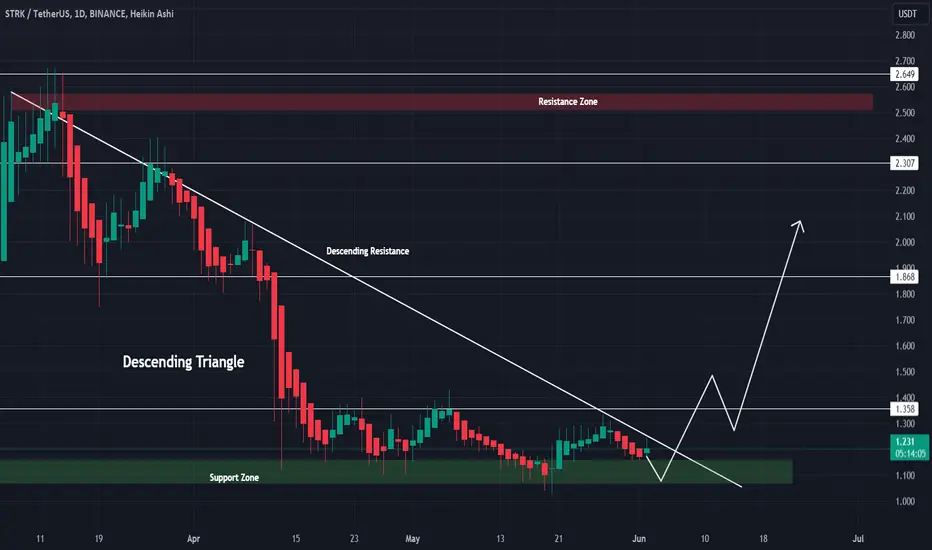
$STRK is trading within the descending Triangle chart patternSTRK/USDT
IDX:STRK is trading within the descending Triangle chart pattern. 🔺️ 🔎
The successful breakout is considered a Bullish signal. ⚡ 📈
The short-term price target for IDX:STRK is set at a minimum of 15% upside. 🚀 🎯
Alikze »» STRK | Move to the roof of the descending channelIn the 4H time, after a mixed correction, it has reached the $1 range, after which it has faced demand.
💎 It is currently moving in a downward channel.
According to the current momentum in the region, the current demand is suffering.
In the next step, it can continue to grow up to the supply area and the ceiling of the channel, which is a dynamic trigger.
💎 If it breaks the supply zone, it can fill the FVG gap in the 4H time frame. Therefore, if you fill the gap and pullback to the broken structure, the next target will be the next supply area.
💎 Alternative scenario: If the demand area breaks downwards, which is also in the midline of the channel, this correction can be extended and extended to the bottom of the channel and the origin of the OB movement.
»»»«««»»»«««»»»«««
Please support this idea with a LIKE and COMMENT if you find it useful and Click "Follow" on our profile if you'd like these trade ideas delivered straight to your email in the future.
Thanks for your continued support.
Sincerely.❤️
»»»«««»»»«««»»»«««

STRK ideaI have already overcome the 1.28 resistance, now there is 1.38 on the map, which he came to many times, I think it’s time to blow up accumulation zone

STRK - IDEA FOR GODS?We can observe a possible reversal pattern.
At the moment, the downward range maintains a downtrend, but in order for the price to show the scenario that I indicated on the chart, it is enough for the price to exit the accumulation for a couple of days and negotiate higher.
I will take the deal when the price is fixed at $1.3.

STRK/USDT Ready for a Potential Surge | Positive Signs for STRK💎Attention Paradisers, a significant trading opportunity with #STRKUSDT is on the horizon as it challenges the upper bounds of a descending channel. With current momentum at the crucial support of $1.08, there's a promising chance for #Starknet to break through this channel.
💎However, if #STRK falters and fails to maintain momentum at the $1.08 support and slides below this level might signal a persisting bearish trend aiming for the next pivotal demand zone at $1.02. This zone is renowned for its capacity to initiate strong bullish responses due to its substantial liquidity.
💎If IDX:STRK revisits this demand zone, it’s imperative to achieve a decisive rebound to sustain support. Failure to do so could amplify bearish forces, worsen market sentiment, and potentially precipitate further price declines.
💎Keep your strategies flexible and your eyes sharp, Paradisers. Your ParadiseTeam is meticulously tracking and prepared to navigate you through the dynamic shifts in the #STRK market.
MyCryptoParadise
iFeel the success

What's your idea about Starknet ($STRK)?Buy at 0.45 $
Sell at 3 $
StarkNet ( IDX:STRK ) is a permissionless decentralized Validity-Rollup (also known as a “ZK-Rollup”). It operates as an L2 network over Ethereum, enabling any dApp to achieve unlimited scale for its computation – without compromising Ethereum’s composability and security, thanks to StarkNet’s reliance on the safest and most scalable cryptographic proof system – STARK.

STRK getting ready for $10STRK is looking to fly towards $10.
●Took previous Monthly Low.
●Created Bullish divergence on HTF with RSI.
●Now trading above the Daily FVG and below the Daily fvg we have Daily +OB(Candle which took PML).
●Buy heavy on spot in CMP and we can long it too from the CMP and SL should be below low $1.020.
●Beautiful setup if played out.
●We use SL to avoid more losses so SL is very vital in trading.
Follow and like for more trade analysis and setups

#STRK almost ready to flyThe #STRK chart is almost a copy of #APT in 2022. The key moment for deciding to go long is breaking the first significant resistance at 1.365 - 1.43. If the #ETH ETF gets approved today, I believe such positive news will provide enough momentum to start a mid-term rally on #STRK.

STARKNET (STRK)StarkNet, a layer-2 scaling solution employing state-of-the-art zero-knowledge rollups, aims to enhance Ethereum's scalability by enabling high throughput and reduced gas costs. This innovative technology provides a vital infrastructure for developing efficient and scalable decentralized applications (DApps).
Given StarkNet's strategic importance in Ethereum's ecosystem and its promising technology, the next price targets for STRK could be set at $2.00, $2.4, and $5.00. Traders might consider taking a position now. This trading idea is based on the anticipation of continued interest and investment in solutions that facilitate blockchain scalability, particularly as Ethereum evolves.

#STRK LONG A bullish signal has formed on this altcoin. The completion of the downward movement is confirmed by the realization of the triangle's potential, the final diagonal and absorption. Optimal for purchase.
