Very bearish - waiting for re-entry
Sui price action is very bearish. I am waiting for an opportunity to re-enter.
Weekly:
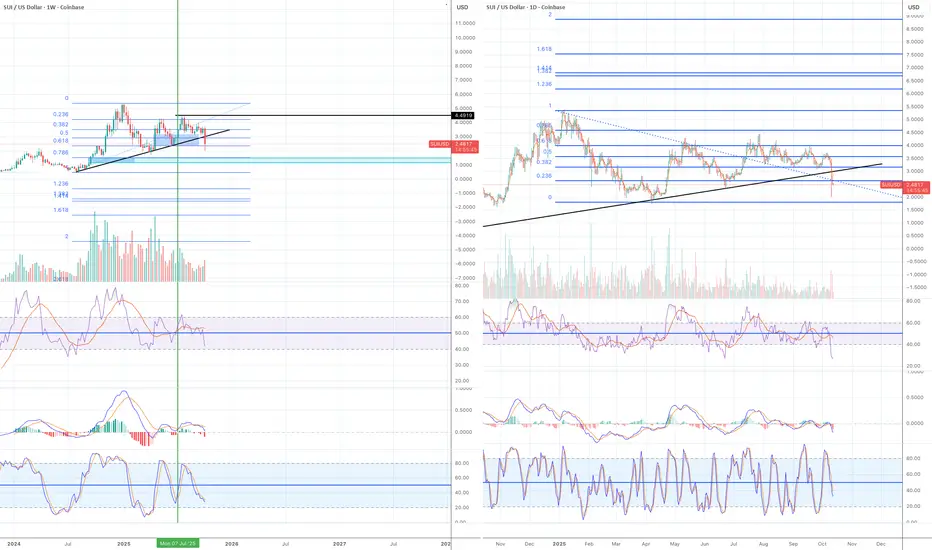
The price broke below the ascending support line. The current weekly candle hasn't completed yet, but a Friday daily candle broke and closed below the support line.
RSI and Stochastic have moved to the bear zone.
MACD lines have crossed to the downside and are starting to move to the bear zone.
Daily:
All momentum indicators are in the bear zone.
My plan:
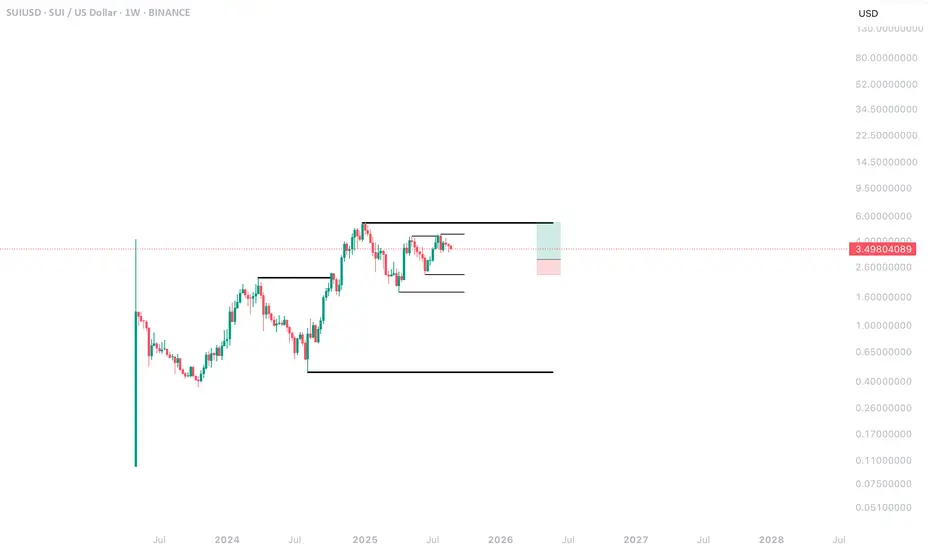
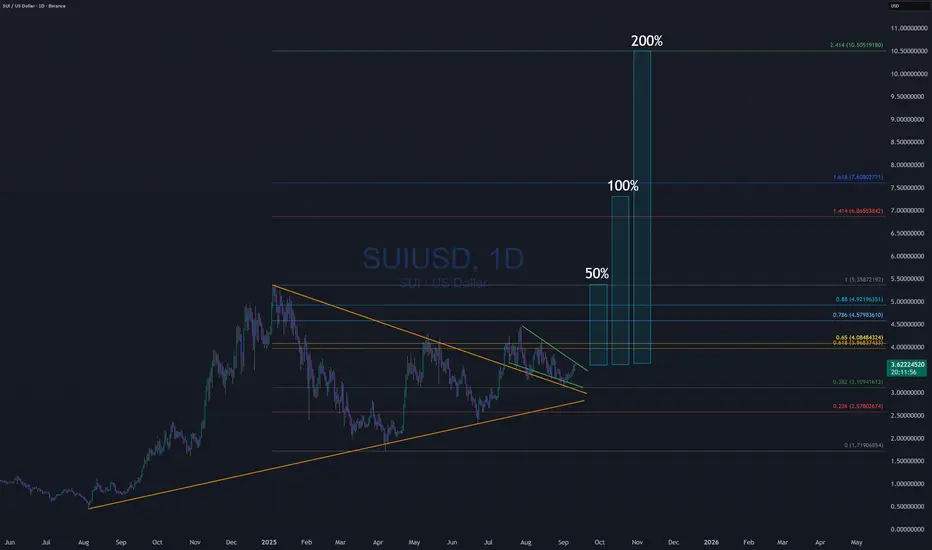
There is a large unmitigated fair value gap in the $1.1-15 zone (blue rectangular box in the weekly chart).
If the price does not recover from $2.5 (Fib 0.618), it is likely to drop to 0.786 level and it is where FVG sits.
0.786 often works as the last line of defence. It the price doesn't recover from there, I won't be buying SUI.
Trade ideas
SUI Triangle emerged!CRYPTOCAP:SUI appears to be in a triangle wave D.
Wave b of D should complete at the High Volume Node support $2.4 before testing the upper boundary trend-line, $3.6 just above the daily 200ema.
If this is a triangle then we should see a huge breakout later in the year into price discovery similar to XRP in 2024 and that would mark the top for SUI as triangle breakouts are a terminal pattern! Targets could go as high as $15
Safe trading

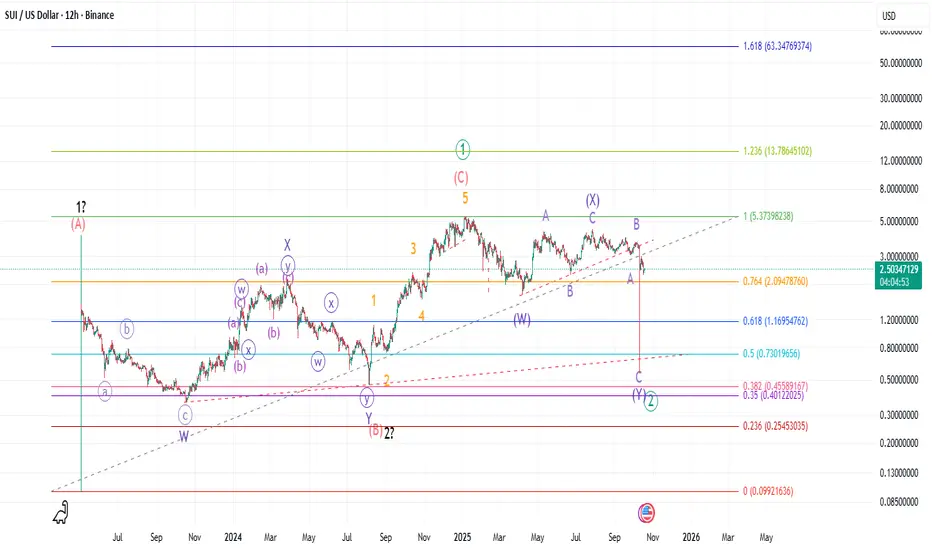
SUI: Moonboy sentiment is over!!! But still can be bullish!SUI bullish price action stalled when it failed to break higher in September, putting an end to a series of 1/2 moves to bed then crashing into the October low. The actual low is debatable, but Binance seems to have gotten hit the hardest, so let's go with that. Now the 5 wave moves in between seem to be parts of a and C waves of various degrees. Depending on how the next price action unfolds, there could be 2 bullish options.
1. Less bullish leading diagonal: In this scenario, we should see 3 wave move up to make new highs for primary wave 3. The lazier the start, the stronger validation for this scenario. Depending on, if the structure is expanding or contracting, the target could be somewhere in between $11 to $70 in the next two years or so. Lazier the action, lower the target. As long as the last wick low holds SUI can chug along.
2. More bullish 1/2, 1/2: In this scenario, the current price action is even a lower degree, maybe a minute degree 1/2 in progress. In this scenario, there is no room for additional downtime. Price needs to move soon and very strongly. Price can correct a bit more, maybe test the $1.5 support, but things cannot drag on for months. Decision time should be in a couple of weeks give or take one week. After that, macro wave 3 or 3 of 3 of 3 should be the strongest and longest leg for SUI.
3. Bear case: If the black Friday wick low is lost, then things will look really nasty. It may take a while for SUI to recover.
I still believe in the technological fundamental that drives the hype. In theory it is the perfect fit for AI driven economy and content. Will it translate into real life use cases, we will have to wait and see. I did add to my bag during the crash and still holding. If price falls below $1.5, then will need to reassess the whole situation.
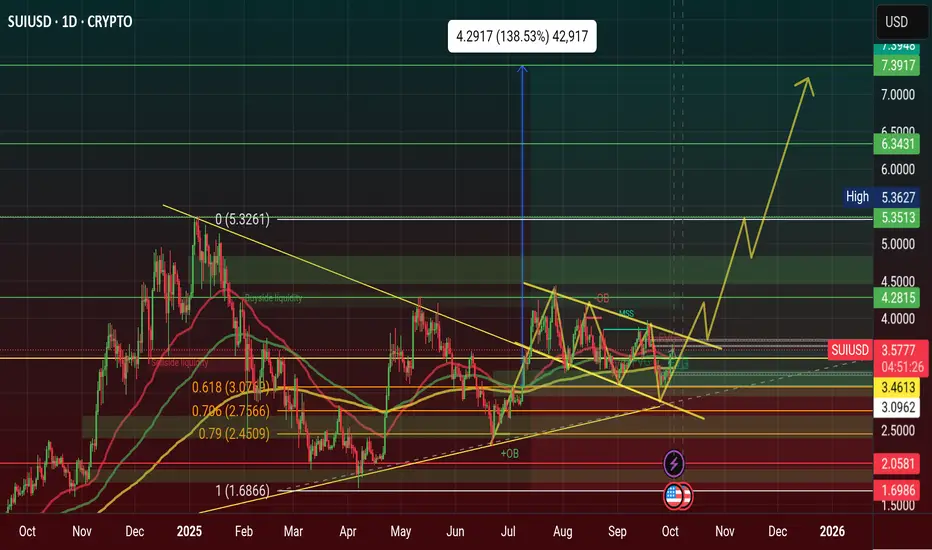
SUI Triangle macro outlookCRYPTOCAP:SUI structure, after a failed all time high, now appears to be a macro triangle in wave (4), also characterised by the long drawn out range. Wave D is underway to the triangle upper boundary with wave E expected to complete around the weekly pivot point, $3.17.
Wave (5) has a minimum target of the R5 weekly pivot at $15.8, at the 2 Fibonacci extension.
Falling below $1.7, wave A, invalidates the analysis and suggests we have much lower to go in a bear market.
Weekly RSI is bearish with lower to go but hidden bullish divergence has formed, a good raly will confirm.
SUI i holding up better than most with shallower retracements overall.
Safe trading
SUI/USD – Losing Steam After Sharp Rally📉 Bias: SHORT (corrective move in progress)
Sui trades at $2.61, pulling back after hitting resistance at $2.68. Price remains above the SMA200 ($2.55), but momentum has faded — RSI down to 39, showing sellers regaining control.
A sustained close below $2.55 could confirm a deeper retracement toward $2.52–$2.48, while bulls must reclaim $2.68 to restart the upside leg.
📊 Key Levels:
Resistance: $2.68 / $2.72
Support: $2.55 / $2.48

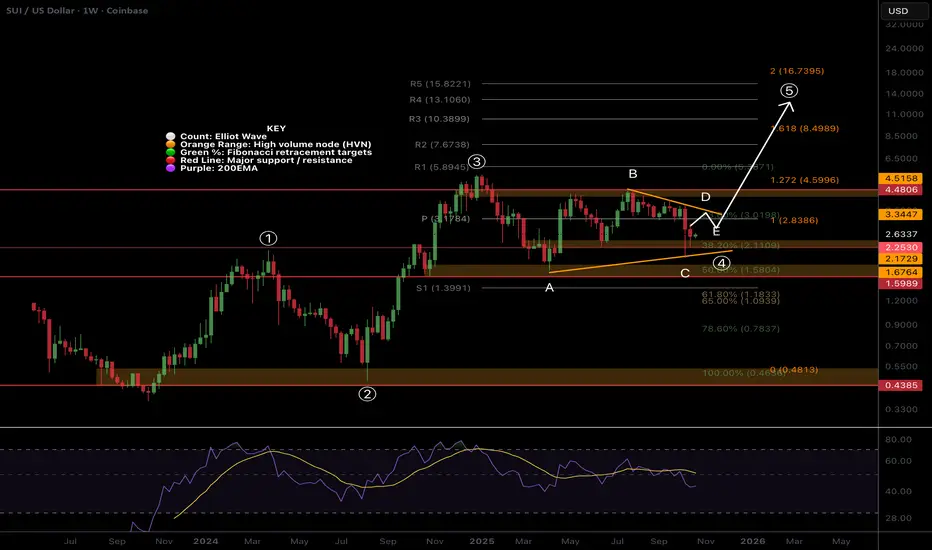
SUI Still holding up strong!Price has still not reached the 0.5 Fibonacci retracement and appears to have been front run. Wave (4) is intact but no higher high since then is a cause for short-term concern. A triangle could be forming, or an expanded flat correction! Time will tell…
Price is below the weekly pivot, RSI is negative with room to fall and no bullish divergence forming. Further downside brings up the S1 weekly and major High Volume Node support at $1.4-1.6 range.
Wave (5) has a minimum target of the R4 weekly pivot at $13.1.
Safe trading

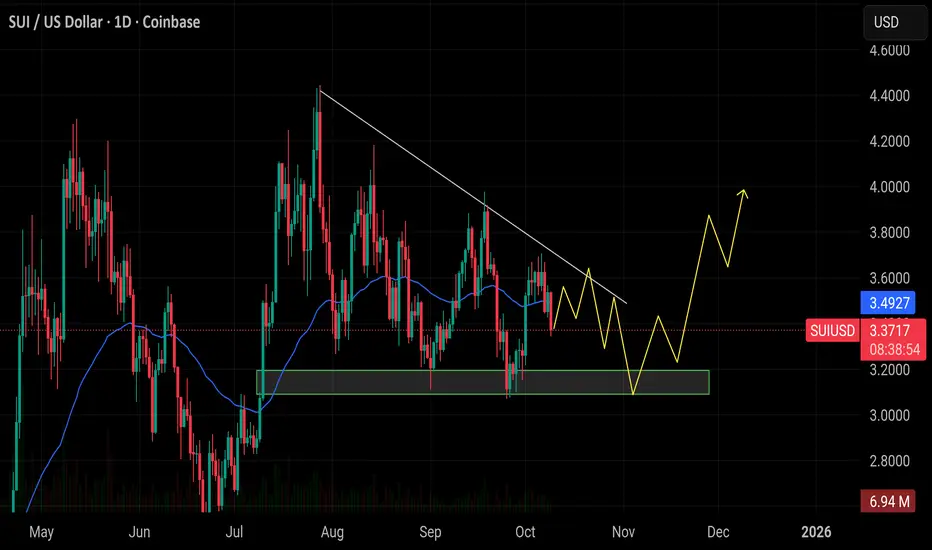
$SUI is forming a bullish structure on the daily chartCRYPTOCAP:SUI is forming a bullish structure on the daily chart, consolidating near support around $3.1. A breakout above the descending trendline could trigger a move toward the $4 zone.
SUI/USD – Weak Momentum Below Trendline🔴 Capped under SMA200 ($3.61)
Sui trades at $3.60, slightly below SMA200, with RSI at 44, reflecting fading momentum. Resistance seen at $3.67, support at $3.56.
📖 Keywords: #SUIUSD #Sui #CryptoMomentum #AltcoinWatch

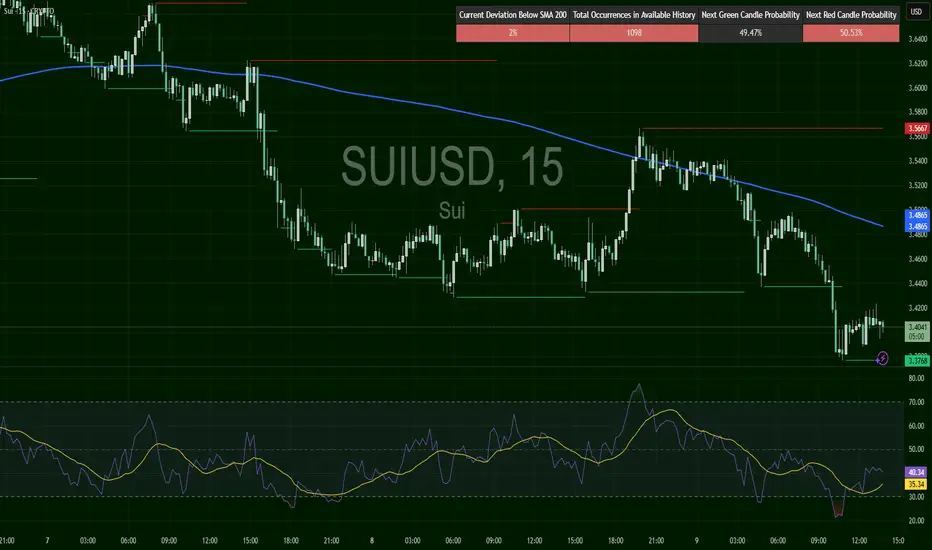
SUI/USD – Weak Below Trendline🔴 Bears still in control under SMA200 ($3.49)
Sui trades at $3.40, holding near $3.38 support. RSI 39, showing limited recovery from oversold conditions. Resistance at $3.57.
📖 Keywords: #SUIUSD #Sui #AltcoinSetup #CryptoMomentum
$SUI Showing a Bullish Flag Pattern Day Chart $7 Soon 2026CRYPTOCAP:SUI Showing a Bullish Flag Pattern Day Chart $7 Soon 2026
CRYPTOCAP:SUI was Showing a Reversal Pattern and now Reverse the Price. 3 Weekly showing a Bullish Flag Pattern in Day Chart. It's a Continuation Pattern. It's going to Upward Movement on Directly.
CRYPTOCAP:SUI Strong Support $2, Open position $3 and Strong Resistance $5, Never forget Target $7 and $11 in 2026
#Write2Earn #BinanceSquareFamily #Binance #SUI #SUBROOFFICIAL
Disclaimer: This article is for informational purposes only and does not constitute financial advice. Always conduct your own research before making any investment decisions. Digital asset prices are subject to high market risk and price volatility. The value of your investment may go down or up, and you may not get back the amount invested. You are solely responsible for your investment decisions and Binance is not available for any losses you may incur. Past performance is not a reliable predictor of future performance. You should only invest in products you are familiar with and where you understand the risks. You should carefully consider your investment experience, financial situation, investment objectives and risk tolerance and consult an independent financial adviser prior to making any investment.
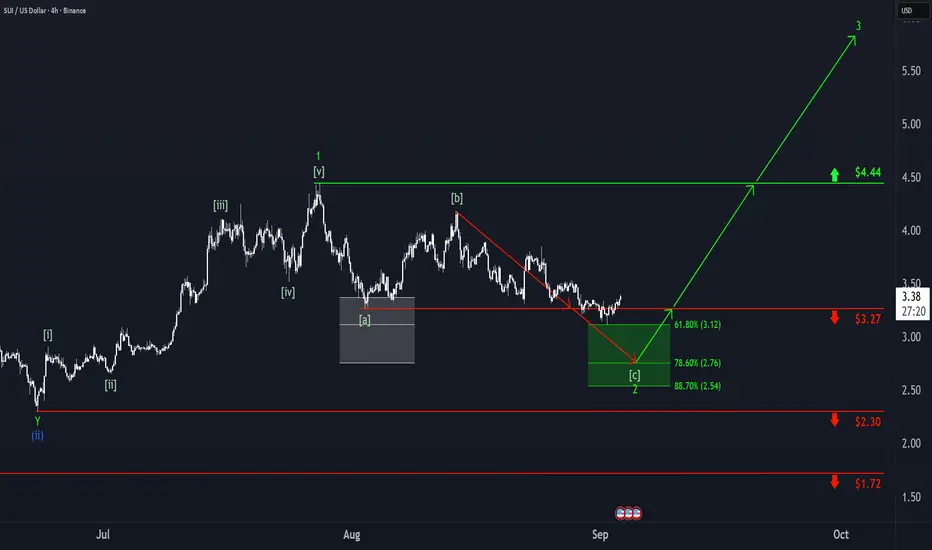
SUI: Alternative Scenario in Play as SUI Breaks Key SupportSUI has continued its downward trend since our last update, breaking below the $3.11 support level and triggering our alternative scenario. As a result, we now place the altcoin in the beige wave (C). We primarily expect this downward wave to drive price lower, with a bottom likely to form within the green long Target Zone between $2.76 and $2.30. This low should also mark the end of the larger wave 2 in bright green, which we had previously considered finished. From this price range, we anticipate a new upward impulse: green wave 3 is expected to push the coin above resistance at $4.44. Accordingly, prices within this zone could be considered for long entries.

SUI/USD – Testing Key Level⚪ Neutral bias, range $3.20–3.25
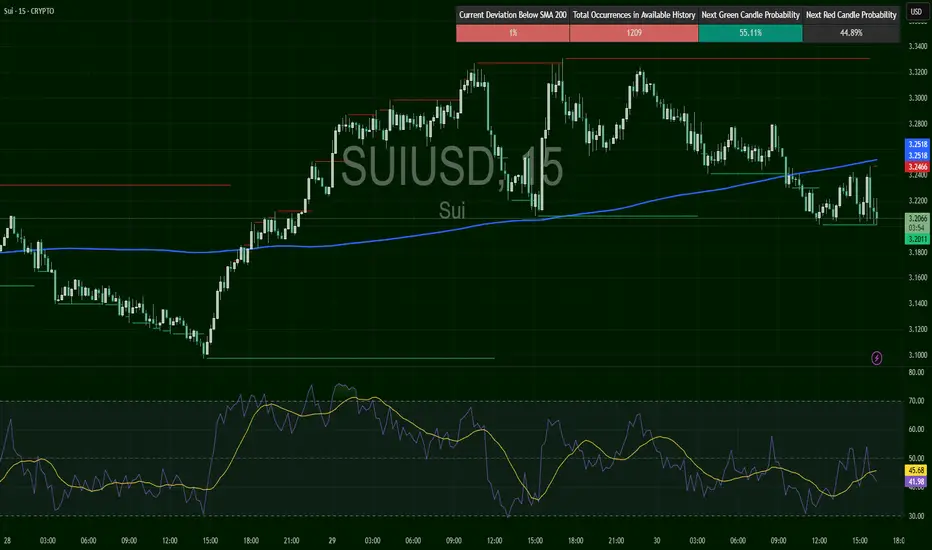
Sui trades at $3.217, consolidating near SMA200 ($3.25). Resistance at $3.25, support at $3.20. RSI at 46, flat momentum. Needs breakout above $3.25 for bullish signal, or loss of $3.20 for bearish pressure.
📖 Keywords: #SUIUSD #Sui #AltcoinRange #CryptoWatch
Is the SUI / SOL ratio forming a cup and Handle?Key Takeaways of a Cup and Handle:
The cup and handle pattern represents a bullish technical price formation that manifests on a price chart as a cup accompanied by a handle, indicating a possible buying opportunity.
This pattern generally develops over a span of seven to 65 weeks and is defined by a "U" shaped cup followed by a handle that slopes downward.
In order to trade the cup and handle pattern, traders may opt to place a stop buy order just above the upper trend line of the handle or wait for the price to close above it, establishing a profit target based on the height of the cup.
Instances such as Wynn Resorts illustrate how a properly formed cup and handle pattern can lead to substantial price movement once the pattern is validated and the resistance level is breached.
However, limitations include the duration required for the pattern to form and the variability in the depth of the cup, necessitating its use in conjunction with other signals and indicators.

SUILocal Analysis / Targets / Elliot Wave
Sui attempted to breakout into all time high and was rejected as expected for a wave (1). Wave (2) is underway with an expected first target of the High Volume Node and S1 daily pivot at $2.9, also the 0.382 Fibonacci retracement. Price must get through the daily 200EMA first. Secondary targets is the golden pocket and High Volume Node support at $2.3.
RSI is just below the EQ and crossed bearishly.
Standard Deviation Band Analysis
Price is below the fair value regression line and another thrust lower will see it reach the green opportunity buy zone where it has tested the threshold twice a support. Price was rejected twice when also attempting to breakout above fair value showing supply ready to drop.
Safe trading

SUI WILL SHOCK EVERYONEToday (September 19, 2025): CRYPTOCAP:SUI is stable at $3.81 with potential to break out to $4.05–$4.30 if volume remains high. Strong support at $3.47 limits short-term downside.
Short-Term (September–October): Bullish with a target of $4–$6, but monitor resistance at $4.05 and BTC trends.
Long-Term (2025): Strong potential for $10–$20 if DeFi and NFT adoption grows, but beware of market volatility.
Strategies:Traders: Capitalize on volatility for swing trading; buy at support ($3.47–$3.70), sell at resistance ($4.05–$4.30).
Long-Term Investors: Accumulate at current levels ($3.81) for a $7–$10 target by year-end, but diversify to reduce risk.
Monitor: DEX volume, whale activity, and regulatory/BTC news.

SUI long IdeaSUI LONG idea
Symmetrical triangle was broken, Market structure broken to bullish.
Breakout-retest and descending wedge will be broken up soon.
SUI/USD – Holding Gains Above Support🟢 LONG above $3.50 – target $3.56
Sui trades at $3.516, consolidating after a sharp run. SMA200 at $3.50 is nearby support. Resistance capped at $3.56. RSI steady at 45–50, suggesting neutral bias but holding trend. Bulls could push if $3.50 support holds.
📖 Keywords: #SUIUSD #Sui #CryptoBreakout #AltcoinSetup #MomentumTrade

SUI 8H – Bearish EMA Cross, Liquidity Targets $2.83 and $2.30SUI is trading at $3.34 after a bearish EMA cross (200 EMA flipped above 50 EMA), confirming downside momentum. Price continues to respect the descending trendline, keeping pressure on support levels.
The first key liquidity pool sits at $2.8374. If this level is swept, sellers may drive price toward the $2.3057 liquidity zone, a major area where buyers have defended in the past.
For bulls, a clean break and hold above the EMA cluster at $3.41–3.48 and the descending trendline would invalidate the bearish setup and open a path back toward $3.80–4.00.
The Stoch RSI remains overbought, signaling that a reversal lower is likely before buyers regain control.
📌 Key Liquidity Levels:
Upside: $3.41 (50 EMA), $3.48 (200 EMA), $3.80–4.00
Downside: $2.8374, $2.3057
⚡ Follow for more SUI liquidity-based setups & predictions.

SUI: Dip and Go?On Monday, SUI dipped into our green Target Zone ($3.12 – $2.54) but quickly rebounded and climbed back above the $3.27 level. While it’s possible that wave 2 has already bottomed, we’re still allowing for potential new lows within this range. Once this interim correction wraps up, we expect an impulsive rally as green wave 3 takes shape, which should push well above the $4.44 resistance.
SUI Wave (4) Still Underway?Its unclear weather CRYPTOCAP:SUI wave 4 is complete or still underway as a larger triangle of flat correction, in a ending diagonal wave 4 (defined by wave 4 falling to wave 1 at the 0.5 Fib).
Price terminated 3 waves up at the High Volume Node resistance and is now finding support at the weekly pivot, 0.236 Fibonacci retracement. Further decline brings up the the 0.382 High Volume Node support.
Weekly RSI is at the EQ.
Safe trading

SUI – Following the Plan📉 CRYPTO:SUIUSD correction from the July peak continues to unfold within a classic Zigzag structure, and price remains on track to reach the equal legs zone at $3.00–$2.72.
No deviation from the roadmap yet. Let price complete the pattern and confirm before positioning.

#sui usd#sui could go a bit lower, it could crash to $0 but it seems to have the strength not to fail this bull run… The goal is to hit at least 7 by end of year…. I would guess mid November we will see the top

SUI Weekly AnalysisBeen following SUI for a while now and bullish formation still intact.
Being patient for the “right” trade.
What does the “right” trade look like?
I’m looking for price to enter or come close to the last higher low in the most recent fractal. You can see me tracing HH & HL within a higher timeframe to verify direction.
To be more specific, I’m looking to enter around the last sell (supply) on the 4HR/1HR. I should see either a BOS or no new lows being made inside my defined range.
An analogy I like to use is I must trade like Jerome Powell cuts rates. I need to first see evidence that the “economy” (price) is changing.
Risk management is rule #1. If it doesn’t fit, be patient. There will always be another opportunity. ALWAYS!!!