Trade ideas

TRON is the leading large altcoin this cycle!!TRX was especially strong this bear market. It was able to steady itself from falling too far. Similar more to Bitcoin then other alts like Solana. TRX fell around 74% in the bear market like BTC. SOL fell more like 94%.
TRX now 150% above old highs and SOL below old highs.
This is not to take anything away from SOL but comparing TRX to the other strongest alt this cycle. I suspect SOL might end up following TRX in a TRX like breakout from its old 2021 highs.
TRX has been able to capture a key part of the crypto market in being a chain for stablecoin transfers and is trying to expand into more typical defi areas.

Sunny side up?Relative to other alts that have made big moves in the past few days, this one is lagging a bit.
Looking at the 2 day chart on the left we have found clear support, we just have not made the explosive breakout, yet. We are primed right under multi day resistance right now, so this could be within the next set of alts to make a wave higher. Stops are clear right now on the hourly chart as we are resting on support as of typing. Solid RR. Lets stay above the purple and we'll see another 2day break higher.


Destiny SUNThe best entry position has been provided, the downward trend has been broken and a pullback has occurred, an upward movement will occur in the coming hours.

double bottom SUN/USDTmy last trades fauke. hope this will play out, looks like on the 4H timeframe that its forming a TEMPORARY double bottom.\
to the 618 fib. cheers!

Sunusdt sunHello, I have given you a golden analysis of Sun currency, which may grow up to 5 Tether.

Sunusdt sunHello, I have given you a golden analysis of Sun currency, which may grow up to 5 Tether.

SUN/USDT Breakout Alert: Ready for 200-300% Gain!!Hey everyone!
If you're enjoying this analysis, please give it a thumbs up and follow!
SUN is showing strong potential! It has broken out of a bull flag structure on the daily time frame and is holding above the flag, signaling a bullish move. Buy now and accumulate more on dips for maximum gains!
Entry range: CMP and accumulate up to $0.0185
Target: 200-300% potential upside
Stop Loss (SL): $0.0158
What do you think of SUN's current price action? Are you spotting a bullish setup? Share your thoughts and analysis in the comments below!


#SUN/USDT#SUN
The price is moving in a descending channel on the 1-day frame and is holding it very well and is about to break out to the upside
We have a bounce from the lower limit of the channel at 0.01600
We have a bearish trend of the RSI that is about to break out which supports the upside
We have a trend to stabilize above the 100 moving average
Entry price 0.01750
First target 0.02680
Second target 0.03337
Third target 0.04370

SUNUSDT (SUN) Updated till 03-10-24SUNUSDT (SUN) Daily timeframe range. its a high risk and reward alt. it pumped hard now retracing back hard. if it breaks 0.01677 clean which may fall back to 0.01202 that can invalid the whole last pump. if it can hold 0.01677 it may get chance to cover up.

Looking for Support hereIve created two fibonacci auto indicators. this one moves like an MA (moving average) line. So you can see and track how the fib levels have moved over time as the asset is traded. Its different from other moving averages. We have broken well below the value area low for the recent mountain climb. Now we look for support here. If it breaks we look for the next area below.
The area we are at now - using the volume profile - we can see a high volume node here and a smaller one below us. The point is these nodes show high traffic areas from past buying and selling. When you reach these areas on a chart its time to plan for support. It might not hold though. Thats why all good traders manage their risk with every trade.
Not Ever Financial Advice.

Sun Token | Making The Right Choice (Sell)We have many great LONG opportunities right now, buy opportunities; this is not one of those.
Sun Token (SUNUSDT) produced a major bullish wave, really strong. After a bullish wave comes a bearish wave. After prices produce a strong rise; down we go.
There are many great choices right now available within the altcoins market. There are truly many, many great pairs. Pairs that are trading at the bottom, new ATL, really low. From the bottom they rise and start to grow; long-term.
Some other pairs are trading really high, only a few are high up. These are no good and must be sold because of the correction.
There is a correction that is affecting most of the market.
Many altcoins ended this correction but a portion of the market is not done. This pair is looking bearish right now, it is aiming down.
You can visit my profile to find hundreds, literally, hundreds of altcoins that are looking great and ready to grow.
Make the right choice.
Choose wisely.
Patience is key.
Feel free to leave a comment if you have any questions.
Thanks a lot for your continued support.
Namaste.

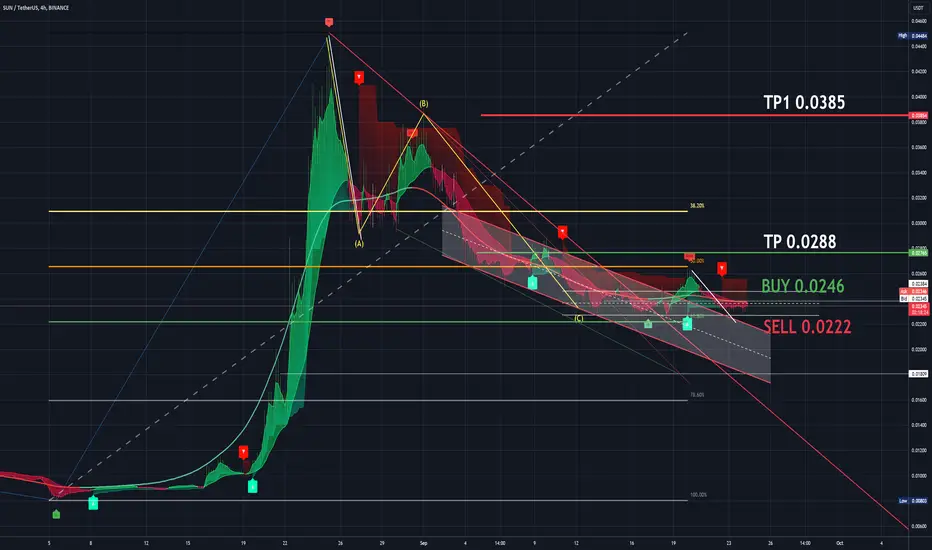
SUNUSDT 4H Consolidation zone on the 0.61% FIBONACCI correction.SUNUSDT 4H Consolidation zone on the 0.61% FIBONACCI correction.
SUN has broken out of all the bearish trends and is settling its price at these levels. From here, we have to watch what direction it takes, having clear levels where we can position ourselves bullish or bearish. We have to take into account what BTC does, which is the conductor of the orchestra for all ALTS.
LEVELS:
BUY: 0.0246
SELL: 0.0222
SL: 0.0222
TP: 0.0288
TP1: 0.0385
I share with you my technical analysis assessments on certain stocks that I follow as part of the strategies I design for my portfolio, but I do not recommend anyone to operate based on these indications. Get informed, train yourself and build your own strategies when investing. I just hope that my comments will help you on your own path :)
TradeX BoT (in development):
Tool to automate trading strategies designed in TradingView. It works with both indicators and graphic design tools: parallel channels, trend lines, supports, resistances... It allows you to easily establish SL (%), TP (%), SL Trailing... multiple strategies in different values, simultaneous BUY-SELL orders, conditional orders.
This tool is in the development process and the BETA will soon be ready for testing.
FOLLOW ME, and I will keep you informed of the progress we make.
SUN — Getting Ready For The Next Run?SUN/USDT shows signs of strength after a period of consolidation followed by a U-shaped bottom formation. This pattern often signals the end of a downtrend and the potential for an upward move.
We’re waiting for a clear close above the ~0.028 resistance level (marked by the grey consolidation area) for a safe entry. A close above this level confirms the breakout and reduces the risk of a fakeout.
The first target is 0.03, with the next key level at 0.038. These levels mark the next resistance zones that could act as price targets during a breakout.
An essential factor to watch is volume!
We want to see rising volume once the price pushes through the grey area to support the momentum and confirm the breakout. If volume stays low, it might indicate weakness or risk of a false breakout.

Multiple Trades | First "Fine" Analysis Since a While | SUNUSDT Didn't post any setups or ideas in a while. When I was just looking at some "younger" crypto charts, I've came across this pair "SUNUSDT". It imediately looked like a descending triangle to me ( with down sloping supply line) But I also found 1 (or even 2) potential bearish harmonic patterns (Cypher and/or Shark)
These patterns could be traded by going long/buy as close to point C, then close the position around point D. The most important and significant trade will follow!
If there is a bearish harmonic formed at those prices, a good entry point to go short will be as close to point D as possible. Stop loss could be set very tight, although this is personal preference.
If every aspect of this setup is going as planned, the odds are even greater that this last move will happen. Don't forget to take profit along the way downside. My final TP will be around 0.016
If there is a viewer that might be reading this, please let me know what you think. I love feedback, as much as I can get! Everyone can feel free to follow and/or contact me on Tradingview.
Happy Trading, Stay healthy
Dan26Trading

SUN/USDT: READY FOR A 100% MOVE!!Hey everyone!
If you're enjoying this analysis, a thumbs up and follow would be greatly appreciated!
SUN/USDT looks good here. It breaks out from the symmetrical triangle in a 4-hour time frame and is currently, being it. Buy some here and add more in the dip.
Entry range:- $0.025-$0.027
Target:- 80-100%
SL:- $0.024
What are your thoughts on SUN's current price action? Do you see a bullish pattern? Share your analysis in the comments below!

SUNUSDTWe can attempt to buy SUNUSDT from specified level if it break LH , also bullish divergence occur indicate that it moves upward.
SL , TP mention in chart.

SUNUSDT 1h In buy zone :)SUNUSDT 1h In buy zone :)
Still, it is better NOT to enter until it breaks the downtrend line, balances its price and starts to draw a support zone and turn around. In this way, it could perfectly touch 0.024.
As always, it is better to be patient

Falling Wedge Pattern Like in a TextbookI don't know about you, but I see a clear falling wedge here. I'm sure you are looking for information on whether SUN will fall further, and I think I have an answer, at least one that I plan to believe.
Positive Background:
- SUN is still an important part of the TRON ecosystem and is actively supported by the CEO. It's not exactly a meme coin made by a high school kid in a basement.
- Volume has increased dramatically in recent months, just to understand the long-term trend - and it's dipping for now, which is part of the pattern I'm talking about below.
- New product launches like SunPump, which will no doubt keep interest in this coin going forward.
Negative Background:
- The U.S. market has seen better days and may just collapse in the next six months, wiping out the economies of half the world. But I think in this case it won't really matter whether you keep your deposit or not.
- The price is typically completely copying bitcoin in consolidation zones, and bitcoin as you know is preparing for its last disembarkation of passengers before flying to $250k, which will mean an imminent terrible drawdown.
What pattern we have:
Look at the chart, it looks like a falling wedge! So far the pattern is going textbook and there is no point in us resisting it. Including, look at the Fibonacci retracement and how much it affects the key levels. Separately, we can talk about the EMA 100 line, which is only essentially where price is stuck. As I see it, we will continue to see falling volume , further movement in the channel with 2-3 serious fails to break out. The EMA 200 will continue to move and when it meets the price it will probably push back and that will be the signal for the algorithms to go long . This will be just at the end of the wedge.
What I'm going to do:
I was one of the unlucky ones who took a long at the very peak, and all the while I'm trying to hedge to save my money. Unfortunately, the last drawdown took me to a bottom that I'm not sure I'm going to get out of. But at least I will share my view on this situation. I was still able to save some stuff, so I will count on this pattern to play out, which in this case will bring me back to the kings.
Tell me what you think about this situation, I'd love to hear any opinions.

(SUN) Breaking Bull Flag to Downside -SHORT-BITRUE:SUNUSDT
SUN 24HR Chart
This one has a long way down. easy trade setup with main fib levels.

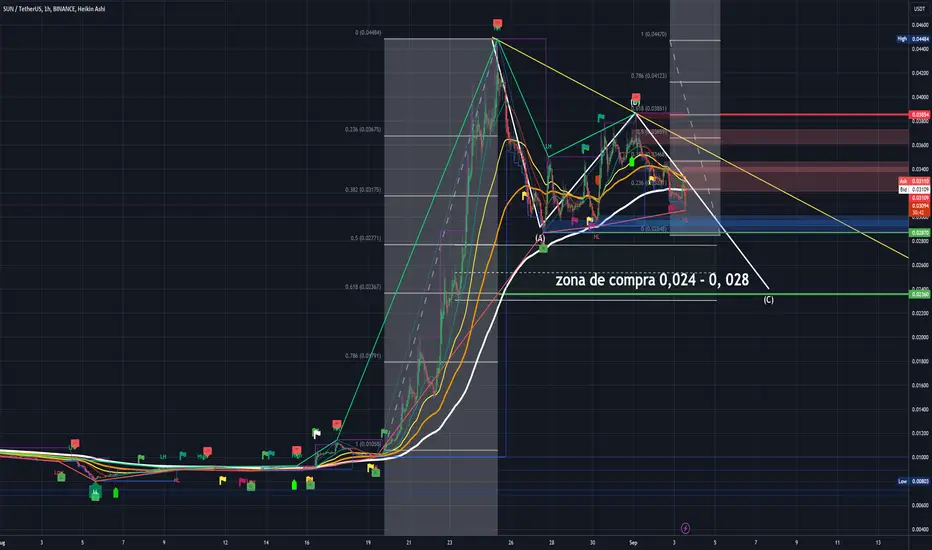
SUNUSDT 1h - CORRECTION A-B-C UpdateSUNUSDT 1h - CORRECTION A-B-C Update
In 1h, SUN has broken the support of the 200 EMA, so it is now easier for it to reach the target of 0.024 / 0.028.
We have a liquidity zone at 0.028 that could act as support, so it is a good time to make partial purchases. As long as it does not break the downward trend, we are still in the process of an A-B-C correction corresponding to the 0.50% - 0.61% zone of the previous big rise.