How Market Fluctuations Shape the Global Economy1. Understanding Fluctuations in the Global Economy
Fluctuations refer to periodic or unpredictable changes in economic indicators such as GDP growth, employment levels, inflation, or market prices. These shifts can be short-term (cyclical), medium-term (structural), or long-term (systemic).
Types of Fluctuations:
Business Cycle Fluctuations:
These are natural phases of expansion, peak, contraction, and recovery in an economy. Every country experiences these cycles, though their duration and intensity vary.
Financial Market Fluctuations:
Driven by investor sentiment, interest rates, and corporate performance, these include stock market rallies and crashes that influence global wealth and investment.
Currency and Exchange Rate Fluctuations:
Changes in the value of one currency against another affect trade competitiveness, inflation, and cross-border investments.
Commodity Price Fluctuations:
Volatile prices of oil, gold, natural gas, and agricultural goods can create inflationary or deflationary pressures worldwide.
Geopolitical and Policy Fluctuations:
Political instability, trade wars, and monetary policy changes often disrupt global supply chains and financial flows.
These fluctuations are not random; they emerge from a complex interaction of economic fundamentals, investor behavior, and policy interventions.
2. Causes Behind Global Economic Fluctuations
Understanding why fluctuations occur is crucial to managing their impact. Several interrelated factors trigger these shifts:
Monetary and Fiscal Policy Changes:
Central banks influence liquidity through interest rates and quantitative easing. When interest rates are low, borrowing increases, spurring growth. However, tightening measures to control inflation can slow down the economy, causing cyclical fluctuations.
Global Supply and Demand Imbalances:
A mismatch between production and consumption—such as oversupply in commodities or chip shortages in technology—creates price volatility.
Technological Innovations:
Innovations can disrupt existing industries. For instance, the rise of renewable energy affects oil prices, while AI and automation reshape job markets.
Investor Psychology and Speculation:
Markets are heavily influenced by collective emotion—fear and greed. A surge in optimism can inflate asset bubbles, while panic can trigger sharp corrections.
Geopolitical Tensions and Conflicts:
Wars, sanctions, and trade barriers affect global trade routes and resource availability, leading to supply shocks and inflationary spikes.
Natural Disasters and Pandemics:
Events like COVID-19 illustrate how quickly global production, logistics, and consumption patterns can be disrupted, leading to large-scale fluctuations.
3. The Domino Effect: How Fluctuations Spread Globally
In today’s globalized economy, no country operates in isolation. Fluctuations in one economy can cascade through several channels:
Trade Linkages:
When demand drops in one major economy, exporters in others suffer. For instance, a slowdown in China can hurt commodity exporters like Brazil or Australia.
Financial Markets:
Global investors move capital rapidly between countries. A crisis in one market can trigger sell-offs across others, as seen during the 2008 financial crisis.
Currency Transmission:
Exchange rate volatility affects import-export competitiveness. A weakening yen, for example, can pressure South Korea’s exports.
Commodity Channels:
Oil price swings influence transportation costs, inflation rates, and household spending worldwide.
Sentiment and Confidence:
Even without direct exposure, economies can feel the psychological effects of global uncertainty, reducing investment and spending.
4. Impact on Different Sectors of the Global Economy
A. Trade and Manufacturing
Trade volumes fluctuate with changing demand and currency valuations. A strong dollar may make U.S. exports expensive, while a weaker rupee might boost India’s export competitiveness. Manufacturing sectors dependent on global supply chains—such as electronics or automobiles—are especially sensitive to such shifts.
B. Energy and Commodities
Oil and natural gas prices are key determinants of inflation and transportation costs. A sudden oil price surge can trigger global inflation, while a drop can hurt energy-exporting nations like Saudi Arabia or Russia.
C. Financial Markets
Stock indices mirror investor confidence. Bull markets encourage investment and innovation, while bear markets reduce liquidity and consumer spending. Fluctuations here affect everything from pension funds to venture capital.
D. Employment and Wages
During downturns, companies cut costs, leading to layoffs and wage stagnation. Conversely, economic expansions raise demand for labor, increasing incomes but sometimes fueling inflation.
E. Developing Economies
Emerging markets often bear the brunt of global volatility. Their currencies weaken faster, capital outflows rise, and inflation accelerates due to dependence on imported goods.
5. The Psychological and Social Ripple Effects
Economic fluctuations don’t just affect balance sheets—they shape social behavior and confidence. When stock markets fall, households feel poorer, spending less and saving more. Consumer pessimism can then deepen recessions.
Similarly, rising prices or unemployment can lead to political instability, protests, and shifts in leadership. Governments facing such pressures often turn to populist or protectionist measures, altering global policy landscapes.
The social cost of economic instability is immense—ranging from increased inequality to reduced access to education and healthcare in developing regions.
6. Case Studies: Major Global Fluctuations
A. The 2008 Financial Crisis
Triggered by the U.S. housing bubble, this crisis spread globally through financial markets. Banks collapsed, trade volumes shrank, and unemployment surged worldwide. It illustrated how interconnected the global economy had become and led to reforms in banking regulations and monetary policy coordination.
B. The COVID-19 Pandemic (2020–2021)
The sudden halt in production, transportation, and consumption caused one of the sharpest global recessions in history. Yet, it also accelerated digital transformation and remote work adoption—showing how fluctuations can drive structural change.
C. The Russia-Ukraine Conflict (2022–Present)
This geopolitical event caused major energy and food supply disruptions. The resulting surge in oil and grain prices led to inflationary pressures in both developed and developing nations.
D. Global Inflation Wave (2023–2024)
As economies recovered post-pandemic, demand outpaced supply. Central banks raised interest rates aggressively, leading to sharp corrections in equity and bond markets. This episode reminded policymakers of the delicate balance between growth and stability.
7. Policy and Institutional Responses
Governments and central banks play critical roles in mitigating the impact of fluctuations. Their responses can stabilize markets or, if misjudged, worsen volatility.
Monetary Policies:
Central banks use interest rate adjustments, bond purchases, and liquidity injections to influence credit availability and inflation.
Fiscal Policies:
Governments can increase public spending or reduce taxes to stimulate demand during downturns, or tighten budgets to cool overheated economies.
Regulatory Reforms:
Post-crisis regulations like Basel III enhanced global banking stability by improving liquidity and capital requirements.
International Cooperation:
Institutions like the IMF and World Bank provide financial aid and policy coordination to manage crises across borders.
Market Transparency and Digitalization:
Technologies like blockchain and AI now enhance real-time monitoring of global economic trends, reducing reaction delays.
8. Long-Term Effects: Evolution Through Fluctuation
Though painful in the short term, fluctuations often lead to long-term growth and innovation. Crises expose weaknesses in economic systems, prompting reforms and resilience-building.
For instance:
The 2008 crisis accelerated the move toward digital banking.
COVID-19 expanded e-commerce and remote working ecosystems.
Energy market disruptions are fueling investment in renewables.
Thus, fluctuations, while disruptive, serve as catalysts for modernization and adaptation.
9. Strategies to Navigate Global Fluctuations
For nations, corporations, and investors, adaptability is key.
Some strategic measures include:
Diversification:
Spreading investments across sectors and regions reduces exposure to single-market shocks.
Sustainable Development:
Economies focusing on renewable energy, digital infrastructure, and innovation withstand shocks better.
Prudent Monetary Management:
Maintaining healthy foreign reserves and debt levels allows flexibility during crises.
Data-Driven Decision-Making:
Using predictive analytics helps governments and businesses anticipate market turns.
Global Collaboration:
Shared crisis management mechanisms—like coordinated rate cuts or trade agreements—strengthen collective resilience.
Conclusion: Embracing the Waves of Change
Economic fluctuations are neither entirely avoidable nor entirely harmful. They are intrinsic to the global economic system—signaling transitions, correcting excesses, and driving innovation. The key lies in how the world responds to them.
Policymakers must balance growth with stability, corporations must plan for volatility, and investors must understand that uncertainty is the price of opportunity. The global economy, much like the ocean, will always have tides of expansion and contraction. Learning to navigate these waves—rather than resisting them—is the essence of sustainable progress.
In essence, fluctuations are not the enemies of the global economy—they are its rhythm, its pulse, and its path toward evolution.
Trade ideas

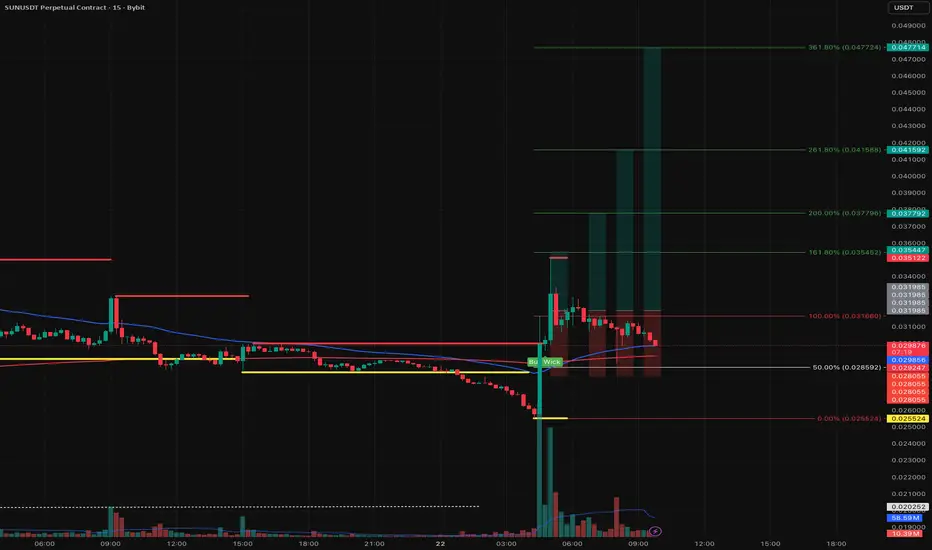
Quick Scalp or Just a Dump?Market’s showing some dumping pressure right now, but that also opens the door for a fast recovery. This is a pure scalp setup — could play out in just minutes.
High risk, quick trade, nothing long-term — but sometimes these fast ideas are worth a shot. Let’s see how it works out! 👀🔥
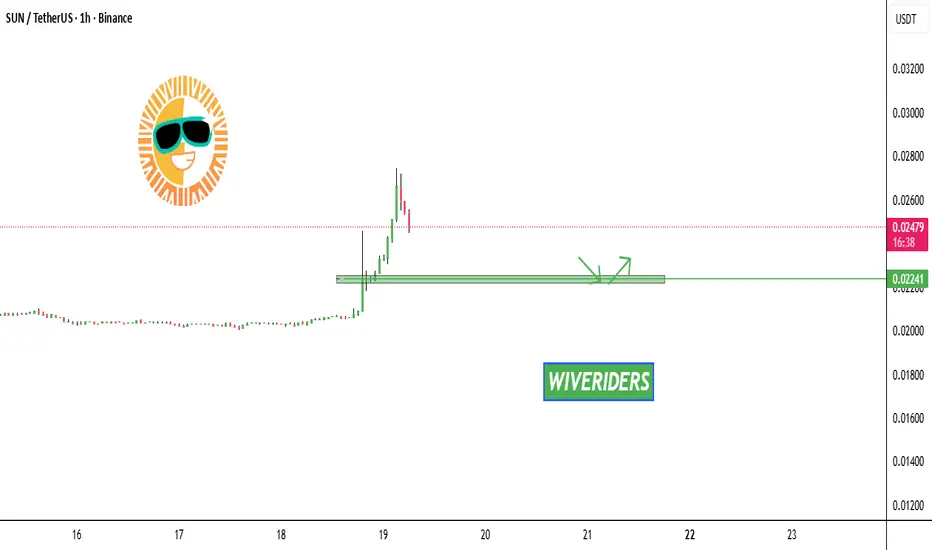
SUN Market Update📊 NYSE:SUN Market Update
📉 If SUN retraces to the 🟢 green zone level, it could provide a better 🎯 entry or re-entry opportunity with confirmation — where buyers previously accumulated.
SUN/USDT ENTERING INTO IMPORTANT INCREASE BOXthere’s a good chance we could see SUN/USDT increase in the coming timeframes, as an important TA cross signals a potential new trend breakout. However, this will depend on the data
Reason of follow is the high chance of break.

Explode Your Gains: Epic $SUN Trading Breakthrough Awaits!BINANCE:SUNUSDT
Explode Your Gains: Epic NYSE:SUN Trading Breakthrough Awaits!
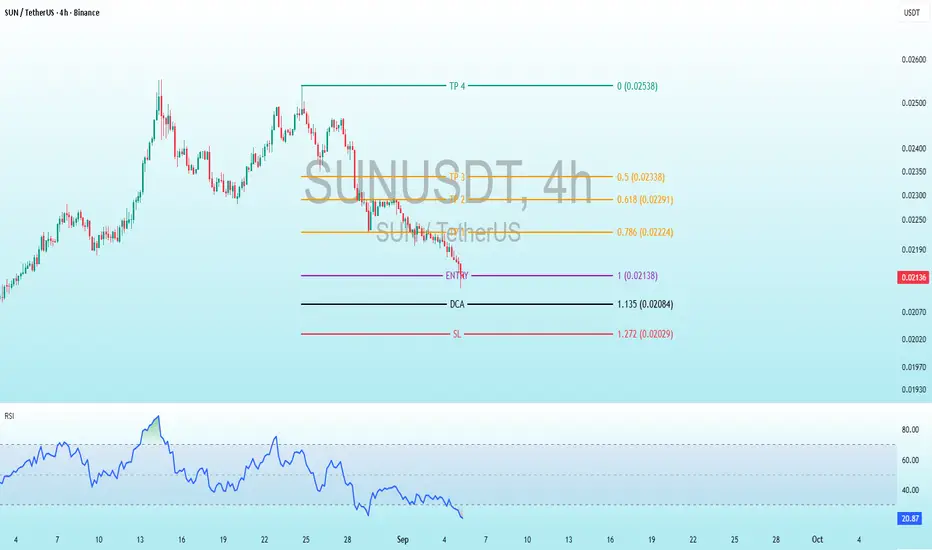
Key Patterns:
The uptrend forms a clear parabolic rise with increasing volatility (longer wicks on candles).
The downtrend resembles a "dump" phase, with a near-vertical drop, possibly driven by profit-taking or market sentiment shifts.
Current price is consolidating near a potential support zone (0.0190–0.0200 USDT), with small-bodied candles indicating indecision. No clear reversal pattern (e.g., hammer or double bottom) is visible yet, but the proximity to marked levels suggests a setup for one.
Volatility and Range: The price range over the period is from ~0.0170 USDT (lows) to 0.0600 USDT (highs). Recent action is low-volatility compared to the peak, with the price hugging the lower end.
Indicator Analysis: RSI
The RSI (14-period) is plotted at the bottom, ranging from 0 to 100, with overbought (>70) and oversold (<30) thresholds marked implicitly (horizontal lines at 80, 60, 40, 20).
Behavior: RSI mirrored the price action closely. It spiked to over 80 during the uptrend (overbought, signaling potential exhaustion), then plunged sharply to around 20–25 by early September (oversold, indicating potential buying opportunity).
Current Reading: The RSI is at approximately 21 (visible on the right), deep in oversold territory. It has been trending downward but flattening slightly in the recent candles, which could hint at divergence if price stabilizes— a bullish signal if confirmed.
Interpretation: Oversold RSI often precedes reversals in trending markets, especially in crypto. However, in strong downtrends, it can remain oversold for extended periods. No clear bullish divergence (RSI higher lows while price makes lower lows) is evident yet, but watch for it as a confirmation of upside.
Marked Levels and Trading Strategy
The chart includes multiple horizontal lines with labels, colors, and Fibonacci ratios (e.g., 0.786, 1.618), suggesting a Fibonacci-based trading plan for a long position. This is common in crypto trading for projecting targets and risk management. The levels appear anchored from a recent swing low to high (likely the August low to peak).
Stop Loss (SL): Red line at 1.272 USDT, labeled "SL" with Fib 1.272 (0.02029) – slight discrepancy in label, possibly a calculation note). This is the risk level where the trade would be invalidated if price breaks lower.
Dollar Cost Average (DCA): Black line at 1.135 (1.135 Fib, 0.02004). This suggests adding to the position if price dips further, averaging down the entry cost.
Entry: Purple line at 1 (1.0 Fib, 0.02140-0.02135). This is the primary buy level, where the trader would enter a long position. Current price is very close or slightly below this, making it active or imminent.
Take Profit (TP) Levels: Multiple orange and cyan lines upward, labeled with Fib extensions (e.g., 0.786, 1.618, 3.0, 4.618, 5.0) and prices:
TP1: ~0.02224 USDT (0.786 Fib, 0.02224)
TP2: ~0.02291 USDT (1.618 Fib, 0.02291)
TP3: ~0.02338 USDT (likely 3.0 or 4.0 Fib, 0.02338)
TP4: Cyan at 0 (extended target 0.02538 USDT, possibly 5.0 Fib or the previous high).
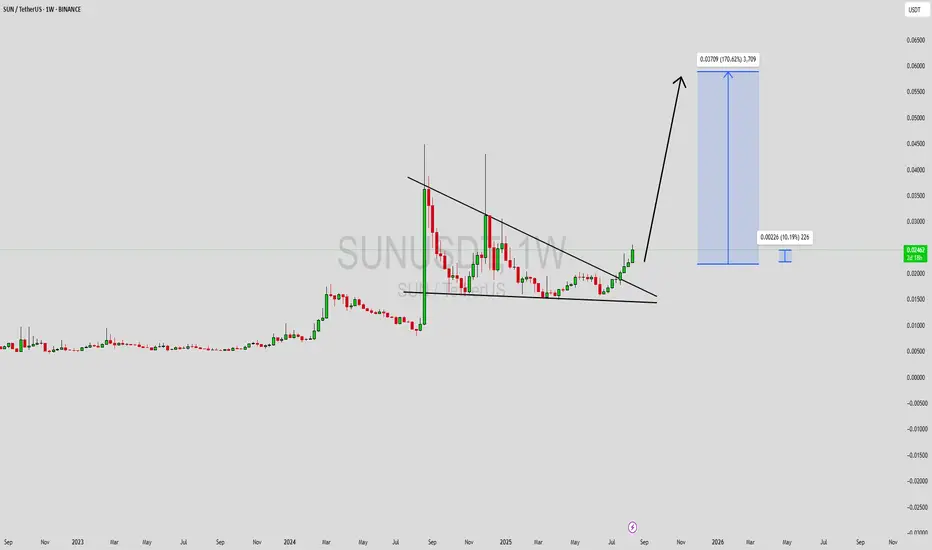
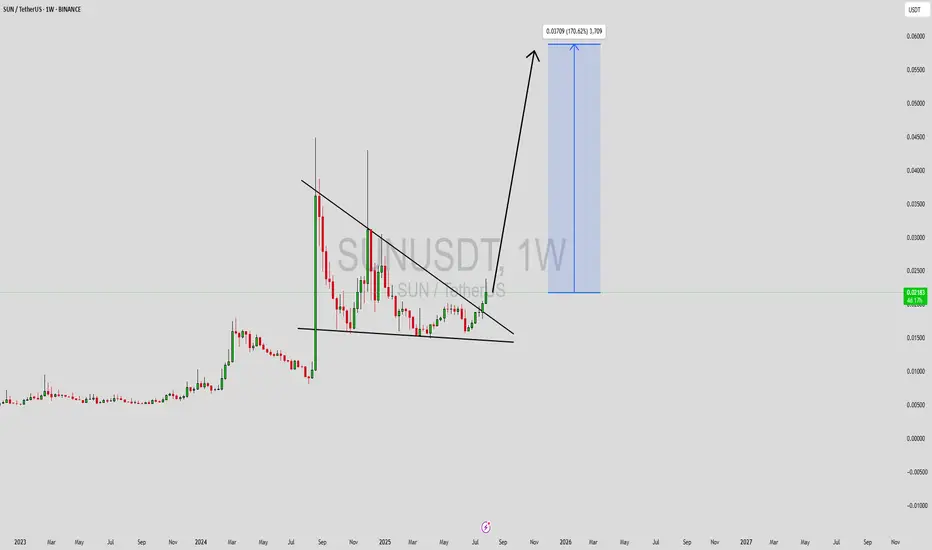
SUNUSDT Forming Descending TriangleSUNUSDT is showing a strong bullish breakout from a long-term descending triangle, a formation that often precedes explosive price action. The weekly chart reveals a sustained breakout above the multi-month trendline resistance, indicating a shift in market structure and signaling that bulls are gaining control. With volume gradually building up and a clear structure confirming accumulation, SUNUSDT appears ready for a significant move. Based on the current chart setup, there’s potential for an impressive 140% to 150% upside.
Historically, SUN has shown sharp vertical rallies following periods of consolidation. The current breakout mimics past behavior and could lead to a powerful trend continuation toward the 0.06000 USDT region. Traders and investors alike are paying close attention to this level, as the next wave of bullish sentiment could send SUNUSDT into price discovery, especially with the crypto market showing renewed optimism.
Market sentiment around SUN is also improving due to increasing attention from retail and institutional players. Social buzz, coupled with increased transaction volumes, reflects growing confidence in this project's roadmap and future prospects. If current momentum continues, SUNUSDT might outperform other altcoins in the short-to-medium term.
✅ Show your support by hitting the like button and
✅ Leaving a comment below! (What is You opinion about this Coin)
Your feedback and engagement keep me inspired to share more insightful market analysis with you!
Sun Token Prepares Major Rise · No ResistanceSun Token (SUN) has been rising. It has been rising short-term, long-term and at all times. It has been green now seven weeks and I am publishing because I see a major advance starting. Something like August 2024 or February-March 2024. Something like this.
SUNUSDT hit bottom November 2022 and it has been growing since. The main low happened November 2022, then August 2024 and finally April 2025. All higher lows of course and a very strong chart.
SUNUSDT is a strong buy and already moving up, but what is about to happen is when bullish momentum grows. Something like a surprise move because it is so strong.
That's what I see based on the many weeks of bullish consolidation. When prices are rising slowly, not one sell. Everything is always buying. This pattern always reveals a clear bullish bias and leads to a strong bullish breakout.
The action is happening above all moving average with strong oscillators also, that is, all the classic signals are present on this chart and already confirmed bullish. Let's see how it goes in the coming months but my money is that you will be seeing much higher prices, everything is about to grow really strong.
Namaste.

SUNUSDT Forming Potential BreakoutSUNUSDT is currently forming a promising potential breakout pattern that traders and investors should closely watch. The price action has shown a period of consolidation near key support zones, building a strong base for a potential explosive move. With volume gradually increasing and bulls taking control, the pair appears primed to break past resistance levels, signaling the beginning of a new uptrend phase.
The technical structure supports a bullish bias, with the potential to achieve a gain of 140% to 150%+ if the breakout materializes fully. Historical price behavior and recent candle formations suggest that SUNUSDT is gearing up for a rally, especially as it approaches a crucial trendline. If confirmed, this breakout could lead to a parabolic move, driven by renewed market interest and buying pressure.
SUN, being part of the TRON ecosystem, benefits from a solid foundation and increasing usage in DeFi applications. The token has seen growing investor interest, further fueling positive sentiment and long-term potential. The fundamentals are aligning well with the current technical outlook, providing additional confidence to bullish traders eyeing high-reward setups.
Given the momentum and improving market dynamics, SUNUSDT has become a high-potential watchlist candidate for both swing traders and long-term investors. A confirmed breakout above the current range could open the door to significant upside gains.
✅ Show your support by hitting the like button and
✅ Leaving a comment below! (What is You opinion about this Coin)
Your feedback and engagement keep me inspired to share more insightful market analysis with you!
SUN Bearish DivergenceBINANCE:SUNUSDT
Trade Setup:
Target 1: 0.01978 (0.50 Fibonnaci Golden Zone).
Target 2: 0.01883 (0.618 Fibonnaci Golden Zone).
Target 3: 0.01747 (0.786 Fibonnaci Golden Zone).
Target 4: 0.01574 (1 Fibonnaci).
Stop Loss: 0.02382 (above recent high, ~25% above current price).
RSI Analysis: The RSI shows a bullish divergence (price making lower lows while RSI makes higher lows), suggesting potential upward momentum. Current RSI is around 82.23, nearing overbought territory (>70), so caution is advised.

SUNUSDT – One Chart, Three Opportunities☀️ In SUN/USDT, three distinct blue box zones stand out. Each offers its own kind of opportunity — but only if you approach them with structure and discipline.
🎯 Here's How to Use Them
📍 Zone 1 → potential for short-term gains
📍 Zone 2 → better suited for medium-term positioning
📍 Zone 3 → promising long-term risk:reward
But don’t place blind orders — instead:
✅ Set alerts for each zone
✅ When price reaches one, switch to 1H chart
✅ Look for an upward breakout
✅ Confirm with positive & rising CDV
If these conditions align, then — and only then — execute a trade.
"The market pays those who are patient and prepared — not those who guess."
Without confirmation, you're trading hope, not setup.
Let’s stay smart. Let’s stay strategic.
UmutTrades 💙
📌I keep my charts clean and simple because I believe clarity leads to better decisions.
📌My approach is built on years of experience and a solid track record. I don’t claim to know it all but I’m confident in my ability to spot high-probability setups.
📌If you would like to learn how to use the heatmap, cumulative volume delta and volume footprint techniques that I use below to determine very accurate demand regions, you can send me a private message. I help anyone who wants it completely free of charge.
🔑I have a long list of my proven technique below:
🎯 ZENUSDT.P: Patience & Profitability | %230 Reaction from the Sniper Entry
🐶 DOGEUSDT.P: Next Move
🎨 RENDERUSDT.P: Opportunity of the Month
💎 ETHUSDT.P: Where to Retrace
🟢 BNBUSDT.P: Potential Surge
📊 BTC Dominance: Reaction Zone
🌊 WAVESUSDT.P: Demand Zone Potential
🟣 UNIUSDT.P: Long-Term Trade
🔵 XRPUSDT.P: Entry Zones
🔗 LINKUSDT.P: Follow The River
📈 BTCUSDT.P: Two Key Demand Zones
🟩 POLUSDT: Bullish Momentum
🌟 PENDLEUSDT.P: Where Opportunity Meets Precision
🔥 BTCUSDT.P: Liquidation of Highly Leveraged Longs
🌊 SOLUSDT.P: SOL's Dip - Your Opportunity
🐸 1000PEPEUSDT.P: Prime Bounce Zone Unlocked
🚀 ETHUSDT.P: Set to Explode - Don't Miss This Game Changer
🤖 IQUSDT: Smart Plan
⚡️ PONDUSDT: A Trade Not Taken Is Better Than a Losing One
💼 STMXUSDT: 2 Buying Areas
🐢 TURBOUSDT: Buy Zones and Buyer Presence
🌍 ICPUSDT.P: Massive Upside Potential | Check the Trade Update For Seeing Results
🟠 IDEXUSDT: Spot Buy Area | %26 Profit if You Trade with MSB
📌 USUALUSDT: Buyers Are Active + %70 Profit in Total
🌟 FORTHUSDT: Sniper Entry +%26 Reaction
🐳 QKCUSDT: Sniper Entry +%57 Reaction
📊 BTC.D: Retest of Key Area Highly Likely
📊 XNOUSDT %80 Reaction with a Simple Blue Box!
📊 BELUSDT Amazing %120 Reaction!
📊 Simple Red Box, Extraordinary Results
📊 TIAUSDT | Still No Buyers—Maintaining a Bearish Outlook
📊 OGNUSDT | One of Today’s Highest Volume Gainers – +32.44%
📊 TRXUSDT - I Do My Thing Again
📊 FLOKIUSDT - +%100 From Blue Box!
📊 SFP/USDT - Perfect Entry %80 Profit!
📊 AAVEUSDT - WE DID IT AGAIN!
I stopped adding to the list because it's kinda tiring to add 5-10 charts in every move but you can check my profile and see that it goes on..

Bearish Head and Shoulders Pattern Confirmed 🚨 NYSE:SUN
Bearish Head and Shoulders Pattern Confirmed 🚨
NYSE:SUN
has formed a bearish head and shoulders pattern and has been rejected from the neckline. The target for this bearish move is the green line level.
📈 Technical Overview:
Pattern: Bearish Head and Shoulders
Neckline: Rejection confirmation
🎯 Target: Green line level.

SUNUSDT // Prices are above the Kaufman indicator after a long time. Our take profit point is the wedge indicator on the weekly time frame. Take loss is the closings that may be below the wedge on the daily time frame.

Sun Token's Correction Is Over, 267% Target MappedThe correction is over. This is what you need to know first.
The end of the correction signals the start of the next bullish phase.
The correction ended right below the 0.786 Fib. retracement level relative to the last bullish wave. This is also near the peak price around March 2024, once resistance turned support.
There was a low first in October 2024 and now multiple sessions in 2025 produced a long-term double-bottom. This signal supports the one mentioned above. So this is a strong chart.
Support is good and confirmed.
The action is starting to turn green. From this point forward, there will be massive growth.
» An easy target can be seen on the chart. It goes to 267% short-term, can be mid-term, within 1-3 months. After that, there will be additional growth.
This chart is meant to alert you of great prices and entry timing.
Thanks a lot for your continued support.
Namaste.

#SUN/USDT#SUN
The price is moving within a descending channel on the 1-hour frame and is expected to continue upward.
We have a trend to stabilize above the 100 moving average once again.
We have a downtrend on the RSI indicator that supports the upward move with a breakout.
We have a support area at the lower limit of the channel at 0.01560.
Entry price: 0.01610
First target: 0.01632
Second target: 0.01660
Third target: 0.01700

SUN Rebuy Setup (12H)It is one of the assets owned by the creator of TRON.
It appears to be completing a large triangle and may move upward from the green zone to complete wave E.
The target could be the red box.
A daily candle closing below the invalidation level will invalidate this analysis.
For risk management, please don't forget stop loss and capital management
Comment if you have any questions
Thank You

SUN/USDT 4H Chart AnalysisCurrently observing SUN/USDT on the 4-hour timeframe with Heikin Ashi candles:
1️⃣ Price Action & Trend
The price remains below the 200-period SMA, currently acting as a dynamic resistance at approximately 0.01677 USDT.
Clear short-term bearish trend structure, with lower highs visible since the recent spike.
The recent price action indicates consolidation, but bearish momentum persists.
2️⃣ Key Levels:
Resistance: Immediate resistance around the 200 SMA (0.01677). Any break above this line could trigger bullish momentum.
Support: Local support established near 0.01615. A breach below could signal further bearish continuation towards 0.01550.
3️⃣ Indicators:
MACD (Ultimate MTF) shows negative momentum with MACD lines below the zero-line, indicating ongoing bearish sentiment.
Histogram bars remain negative, underscoring the bears' control over the current market condition.
📌 Trading Idea:
Short Scenario: If the price rejects clearly from the 200 SMA, consider short positions targeting 0.01615 and potentially 0.01550.
Long Scenario: Wait for a confirmed breakout and retest above the 200 SMA (0.01677) for bullish confirmations, targeting upwards towards 0.01750 initially.
⚠️ Recommendation: Maintain tight stop-losses around key levels, especially given the potential for volatility in the current consolidation phase.
👉 Conclusion: Currently leaning bearish with cautious optimism if resistance at the 200 SMA is overcome. Monitor closely for decisive price action to determine direction.
💬 Let me know your thoughts below! Like & follow for more updates! 🚀📈

SUNUSDT 5DSUN ~ 5D Analysis
#SUN Trading is very high risk. Buy from here if you have a Conviction on this coin with a short -term target of at least 15%+.

SUN can pump 6 to 7x from hereThe SUN.io platform is TRON's first one-stop platform that supports stablecoin swap, token mining and self-governance. After the redenomination, the new SUN token, as a multifunctional governance token on the SUN platform (similar to the CRV token of Curve DAO and the EPS token of Ellipsis), will grant token holders various rights and benefits such as the voting and governance right in the community, value capture, staking rewards, etc..

SUN/USDTKey Level Zone : 0.026400 - 0.026600
HMT v4.1 detected. The setup looks promising, supported by a previous upward/downward trend with increasing volume and momentum, presenting an excellent reward-to-risk opportunity.
HMT (High Momentum Trending):
HMT is based on trend, momentum, volume, and market structure across multiple timeframes. It highlights setups with strong potential for upward movement and higher rewards.
Whenever I spot a signal for my own trading, I’ll share it. Please note that conducting a comprehensive analysis on a single timeframe chart can be quite challenging and sometimes confusing. I appreciate your understanding of the effort involved.
Important Note :
Role of Key Levels:
- These zones are critical for analyzing price trends. If the key level zone holds, the price may continue trending in the expected direction. However, momentum may increase or decrease based on subsequent patterns.
- Breakouts: If the key level zone breaks, it signals a stop-out. For reversal traders, this presents an opportunity to consider switching direction, as the price often retests these zones, which may act as strong support-turned-resistance (or vice versa).
My Trading Rules
Risk Management
- Maximum risk per trade: 2.5%.
- Leverage: 5x.
Exit Strategy
Profit-Taking:
- Sell at least 70% on the 3rd wave up (LTF Wave 5).
- Typically, sell 50% during a high-volume spike.
- Adjust stop-loss to breakeven once the trade achieves a 1.5:1 reward-to-risk ratio.
- If the market shows signs of losing momentum or divergence, ill will exit at breakeven.
The market is highly dynamic and constantly changing. HMT signals and target profit (TP) levels are based on the current price and movement, but market conditions can shift instantly, so it is crucial to remain adaptable and follow the market's movement.
If you find this signal/analysis meaningful, kindly like and share it.
Thank you for your support~
Sharing this with love!
HMT v2.0:
- Major update to the Momentum indicator
- Reduced false signals from inaccurate momentum detection
- New screener with improved accuracy and fewer signals
HMT v3.0:
- Added liquidity factor to enhance trend continuation
- Improved potential for momentum-based plays
- Increased winning probability by reducing entries during peaks
HMT v3.1:
- Enhanced entry confirmation for improved reward-to-risk ratios
HMT v4.0:
- Incorporated buying and selling pressure in lower timeframes to enhance the probability of trending moves while optimizing entry timing and scaling
HMT v4.1:
- Enhanced take-profit (TP) target by incorporating market structure analysis

Trading opportunity for SUNUSDTBased on technical factors there is a Sell position in :
📊 SUNUSDT
🔴 Sell Now
🪫Stop loss 0.02550
🔋Target 0.02050
📏 R/R 2
💸RISK : 1%
We hope it is profitable for you ❤️
Please support our activity with your likes👍 and comments📝

Huge $SUN cup&handle?NYSE:SUN is evolving to a cup&handle pattern. To be confirmed, it still needs a daily/weekly close above 0.05.
If confirmed the target is 0.35$. Insane!!!

Sun Token ($SUN): Strategic Entry into DeFi Ecosystem TokenI spend time researching and finding the best entries and setups, so make sure to boost and follow for more.
Sun Token ( NYSE:SUN ): Strategic Entry into DeFi Ecosystem Token
Sun Token (SUN) is a crypto in the CRYPTO market. The price is 0.02420828 USD currently with a change of -0.00058 (-0.02359%) from the previous close. The intraday high is 0.02517523 USD and the intraday low is 0.02232376 USD.
Trade Setup:
- Entry Price: $0.02197
- Stop-Loss: $0.00692
- Take-Profit Targets:
- TP1: $0.05232
- TP2: $0.08906
Fundamental Analysis:
Sun Token ( NYSE:SUN ) is integral to the TRON blockchain's decentralized finance (DeFi) ecosystem, facilitating governance and incentivization within the platform. Its role in promoting DeFi activities on TRON has garnered attention from investors seeking exposure to this growing sector.
Technical Analysis:
- Current Price: $0.02420828
- Moving Averages:
- 50-Day SMA: $0.02350000
- 200-Day SMA: $0.02200000
- Relative Strength Index (RSI): Currently at 55, indicating neutral momentum.
- Support and Resistance Levels:
- Support: $0.02250000
- Resistance: $0.02550000
Market Sentiment:
The DeFi sector continues to expand, with NYSE:SUN playing a pivotal role in TRON's ecosystem. Its integration into various DeFi protocols enhances its utility and appeal among investors.
Risk Management:
Implementing a stop-loss at $0.00692 helps mitigate potential losses, while the take-profit targets at $0.05232 and $0.08906 offer favorable risk-reward ratios. Given the token's volatility, strict adherence to these levels is crucial.
When the Market’s Call, We Stand Tall. Bull or Bear, Just Ride the Wave!
Disclaimer: This analysis is for informational purposes only and does not constitute financial advice. Traders should conduct their own due diligence before making investment decisions.

