Get Ready for the Takeoff of (S - USDT)Get Ready for the Takeoff of (S - USDT).
Target Points (TP) are displayed on the chart.
SUSDT trade ideas


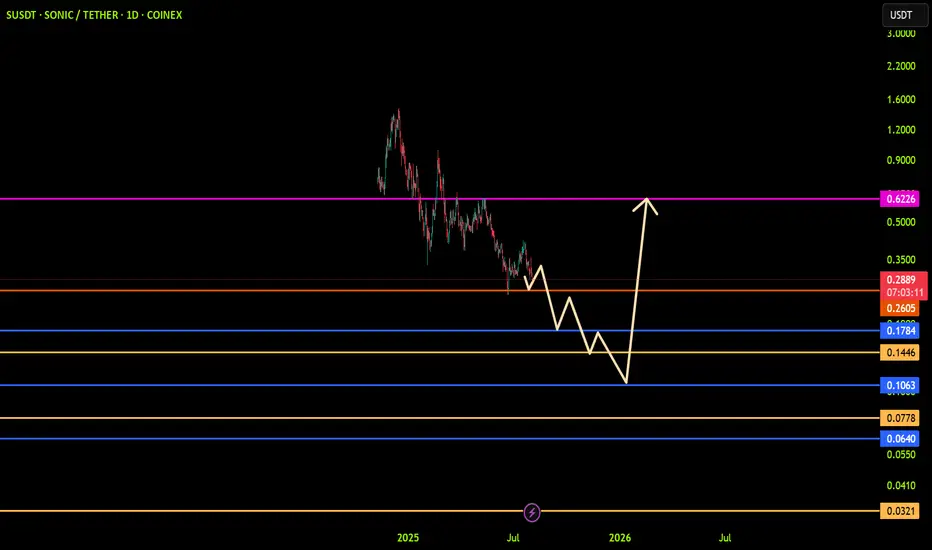
Sonic ready to fly but with delay personal idea: Sonic located in strong daily demand zone with delay but could give good profit, we see buyer pressure here, three targets are showing up in the chart, in my opinion first target is easy to pass and second target may be pause a little and needs high volume, finally in my opinion third target will be approach with shadow. Good 🙂luck 👍


S/USDT - Daily - BreakoutThe S/USDT pair on the Daily timeframe presents a Potential Buying Opportunity.
Target Levels:
1st Resistance – 0.4000
2nd Resistance - 0.5839

Sonic to 0.6$NFA.
I think this is the right time to start accumulate Sonic.
I like this consolidation + 0.3$ looks solid.
Likely consolidation to continue to early october.
Good luck!

Sonic (FTM) Technical Outlook: Signs of an Upcoming Breakoutthe price is currently below a dynamic resistance line, but the strength of this line has weakened compared to the past, increasing the likelihood of a breakout.
below the current price, a dynamic support line has formed, preventing the creation of a new price low. additionally, the pivot that led to the lowest low was unsuccessfully broken once. this, along with the fact that the price has been moving within this range over the past two months, serves as a bullish signal.
ichimoku analysis was also used, but is has been removed for chart clarity.
future price targets are: $0.35, $0.60, $1.20, and ultimately $3.00.

SONIC (FTM) WEEKLYAccording to the weekly analysis, technical indicators are in a bearish state:
RSI and MACD are below their key levels (usually 50 for RSI and 0 for MACD).
Although the price has recently rebounded from the long-term bullish support line, the overall trend is still bearish.
On the Investing.com platform, the weekly Strong Sell status is recorded; the moving averages have also given negative signals:
In various analyses, signals such as RSI around 47 (neutral) and MACD negative are reported, indicating weakness of buyers.Sonic is launched with the aim of providing a next-generation EVM-L1 blockchain with ultra-high speed (up to 400,000 TPS), fast confirmations, and low fees.
.
The S token’s uses include fee payment, staking, participation in network governance, and node running.

SusdtS formed a W bottom pattern and broke out of the descending wedge. Now slowly moving towards the major trendline.
First targets 0.4 then 0.6

SUSDT: trend in daily time frames ((((( Each of these entries can reach the main TARGET)))))
The color levels are very accurate levels of support and resistance in different time frames, and we have to wait for their reaction in these areas.
So, Please pay special attention to the very accurate trend, colored levels, and you must know that SETUP is very sensitive.
Be careful
BEST
MT
SUSDTlet see what will happen my expactation it is. it is doing w and high. there is idm level and below of it exist fvg and order block when you check daily and weekly you will see the level which i mention

Sonic Near Strong Support, Eyes 15% Rally Toward $0.36 TargetHello✌️
Let’s analyze Sonic’s price action both technically and fundamentally 📈.
🔍Fundamental analysis:
Sonic Token’s Fee Monetization lets developers keep up to 90% of fees their apps make, boosting growth by rewarding active builders. This approach helped other projects grow 20-40% TVL early on.🚀
📊Technical analysis:
BINANCE:SUSDT shows solid volume near a strong daily support; if it holds, a 15% upside toward $0.36 looks likely. Watching this level is key for a potential bounce.📊🔍
✨We put love into every post!
Your support inspires us 💛 Drop a comment we’d love to hear from you! Thanks, Mad Whale

SONIC/USDT — Descending Triangle at Key Support!Overview
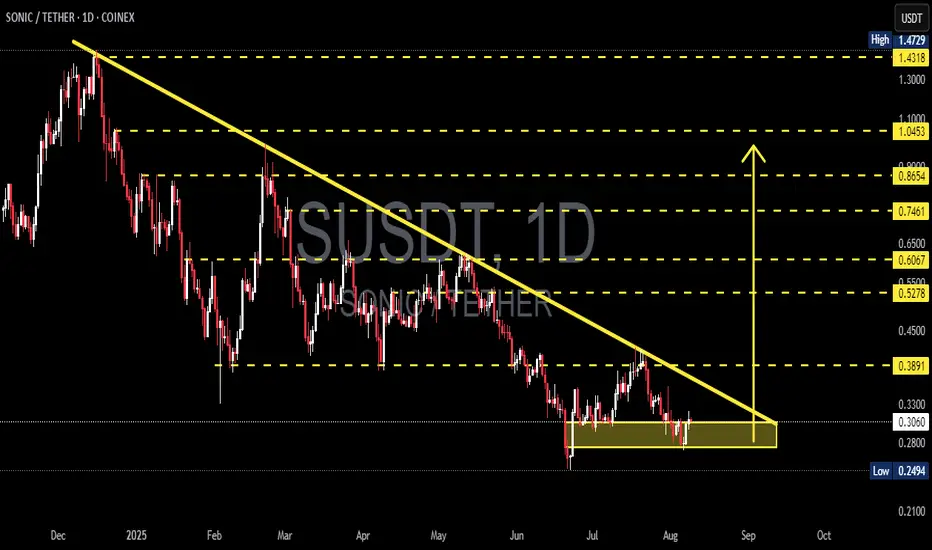
The daily chart shows a clear medium-term downtrend (well-defined descending trendline) meeting a strong horizontal support zone around 0.25–0.31 USDT (yellow box). Current price ≈ 0.3059 USDT. This structure forms a descending triangle or accumulation range, signaling that the market is in a decision phase — either a bullish breakout or a bearish continuation.
---
Key Levels
Current Price: 0.3059
Support Zone: 0.2494 – 0.305 (historical low at 0.2494)
Descending Trendline Resistance: ~0.33–0.35 (dynamic)
Next Resistances: 0.3891, 0.5278, 0.6067, 0.7461, 0.8654, 1.0453
Breakdown Measured Target: ~0.11 (if 0.2494 breaks)
Potential % moves from current price:
To 0.3891 ≈ +27.2%
To 0.5278 ≈ +72.5%
To 0.2494 ≈ −18.5%
To 0.11 ≈ −64%
---
Pattern & Interpretation
Main Pattern: Descending trendline + horizontal support = descending triangle (bearish bias unless broken to the upside).
Bearish Signal: Lower highs structure, price still under the descending trendline, supply pressure dominant. A daily close below 0.2494 with high volume = breakdown confirmation.
Bullish Signal: Daily close above the trendline (~0.33–0.35) with strong volume, followed by a successful retest = breakout confirmation. Extra confirmation if price breaks and holds above 0.3891.
---
Scenarios
Bullish
1. Break & daily close above trendline (~0.33–0.35) with rising volume.
2. Retest holds as support.
3. Targets: 0.3891 (+~27%), then 0.5278 (+~72%).
4. Stop-loss: below support box (~0.28 or safer < 0.2494).
Bearish
1. Daily close below 0.2494 with strong volume = breakdown.
2. Measured move target ≈ 0.11.
3. Conservative target: psychological zones 0.18–0.15.
4. Stop-loss for shorts: above 0.305–0.33.
---
Trading Notes
Conservative Long: Wait for breakout & retest above trendline.
Aggressive Long: Enter near support (0.26–0.30) with tight stop below 0.2494.
Short: Only after confirmed breakdown below 0.2494.
Always watch daily close + volume to avoid false signals.
---
Conclusion
Current trend is bearish, but the strong 0.25–0.31 support keeps the possibility of a short-term rebound alive.
Decision point: Breakout above 0.35 → bullish rally, Breakdown below 0.2494 → extended sell-off.
Risk management is key — use stop-losses and position sizing.
#SONIC #SONICUSDT #CryptoAnalysis #SupportResistance #DescendingTriangle #Breakout #Altcoin #RiskManagement
#SPath to $0.60 — Is It Realistic?
Yes, but it depends on a few key factors:
If Sonic breaks and holds above $0.35, the next realistic targets are:
• Short-term: $0.45–$0.52
• Mid-term: $0.60, especially if burn rates stay high and ecosystem growth continues
ALTSEASON send us Higher.

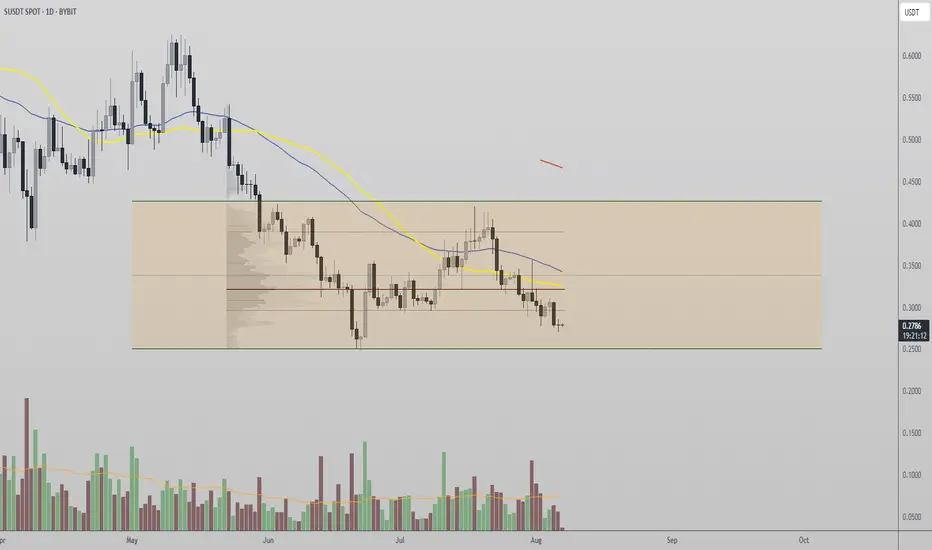
Sonic Token Stuck in Range as Accumulation Phase Forms Sonic Token is showing signs of a classic range-bound market structure, with price rotating between the value area high and the value area low. The most recent rejection from range highs has shifted price action back toward the lower boundary of the range. This setup suggests a potential equilibrium phase that could last for days or even weeks before any breakout occurs.
Key Technical Points:
- Range Bound: Trading between value area high and value area low on the daily timeframe
- Rejection Point: Clean rejection from value area high triggered current rotation downward
- Breakout Confirmation: Requires strong bullish volume to confirm legitimacy
Sonic Token has clearly established a well-defined trading range on the daily timeframe, with price action bouncing between the value area high and low. After a recent rejection at the top of this range, S-SONIC is now rotating downward, currently testing the lower end of the range.
This behavior is consistent with a market in equilibrium, where no side has definitive control. The daily timeframe provides context for this extended sideways movement, and it appears likely that the asset could remain within this consolidation zone for several more sessions. Unless strong volume emerges, the probability favors continued ranging.
This current phase may evolve into a longer-term accumulation period. These phases are common during consolidation before major directional shifts. If price remains bound within this range and tests both boundaries multiple times, it often signals that larger players are accumulating positions, awaiting a breakout trigger.
However, volume remains the key metric to watch. Any breakout attempt — whether to the upside or downside — must be accompanied by strong, above-average bullish volume to confirm its legitimacy. Without this, even a break above the value area high may lead to a fakeout and a return back into the range.
Until proven otherwise, Sonic Token is not trending but rotating within the value zone. For traders and investors, this phase represents potential accumulation opportunities at range lows and profit-taking opportunities at range highs. But aggressive breakout positioning should be avoided until volume validates the move.
If price eventually breaks out of this range with increasing bullish influxes, it could shift the entire structure toward a new trading regime. But until then, the bias remains neutral to range-bound.
What to Expect in the Coming Price Action
Sonic Token is likely to continue ranging until a breakout is confirmed with high volume. Watch the value area high and low for reactions and confirmation signals before positioning for continuation.
Sonic is creating wedge pattern in higher timeframeOn our current market structure, sonic is creating wedge bullish pattern.
If you check the current price using Fibonacci there's a possibility that it will goes to 0.24 or worst 0.1552 before it will break its current weekly structure.
You can accumulate within the pattern but if you're planning to make position and do long...please avoid that.
Point of interest is 0.24 to make create double bottom on it. If it's break, 0.1552.

what daily chart of Sonic tell us? personal idea: Sonic daily chart shows finding and creating bottom around 0.3 price and price reverse is forming, in this scenario targets of
0.5-0.6
0.8-0.9
1-1.2
are in the horizon of bulls
Good 🙂 luck 👍

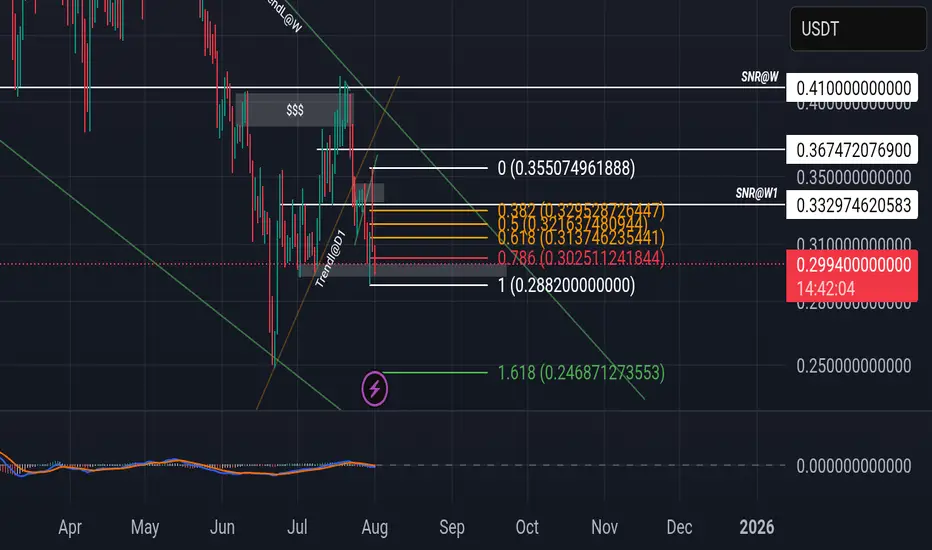
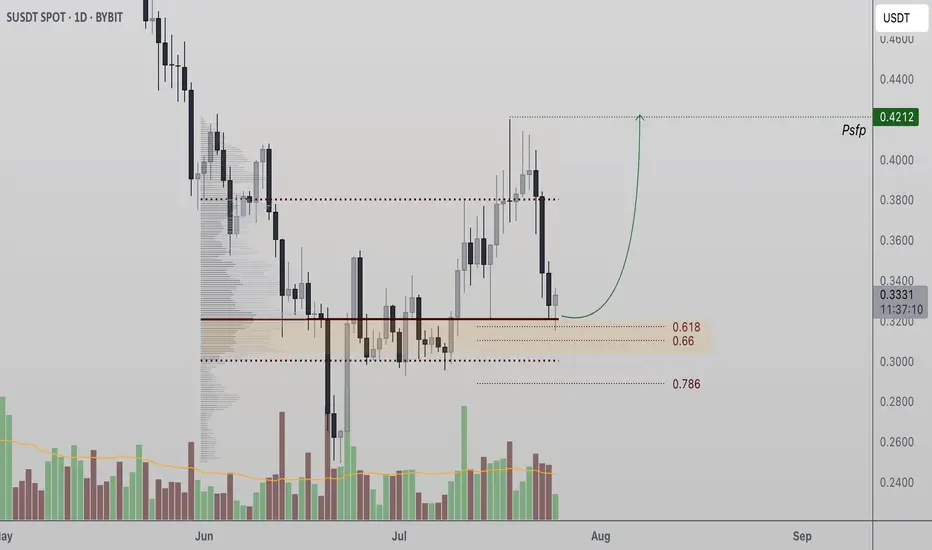
Sonic Token Tests Critical Support at Point of Control Sonic Token (S) is holding a major confluence support zone that could act as the foundation for a bullish reversal. A strong bounce here may lead to a retest of the $0.42 swing high.
Sonic Token (S) has corrected into a significant support region, aligning with both the Point of Control (POC) and the 0.618 Fibonacci retracement level. This confluence of technical factors marks a decisive zone where the current bullish structure could either confirm or break down. For bulls to remain in control, price must continue closing daily candles above this support in the coming sessions.
Key Technical Points:
- Key Support Zone: POC and 0.618 Fibonacci retracement form a strong support base
- Market Structure at Risk: Losing support would invalidate the current bullish structure
- Upside Target at $0.42: A reclaim of the swing high confirms continuation with a higher high
This level has become a make-or-break point for Sonic Token’s trend. From a structural perspective, holding this zone would confirm a higher low, preserving the uptrend and increasing the likelihood of a rotation toward the swing high at $0.42. Multiple high time frame indicators now intersect at this support region, making it a vital area for bulls to defend.
The volume profile supports this level’s importance, as historical price action shows significant accumulation and trade density in this range. So far, there are signs that support is holding — but what’s missing is a consistent pattern of daily candle closes above this level. Until that happens, any bounce should be viewed with cautious optimism rather than full confirmation.
If Sonic Token fails to maintain this level, the market risks entering a deeper corrective phase, potentially breaking below the bullish structure that’s been in place since the last major swing low. This would delay any retest of $0.42 and could invite further selling pressure.
On the other hand, if the token manages to hold the confluence zone and reclaim momentum, a move back toward $0.42 would not only retest the previous high but potentially trigger a breakout and continuation of the larger bullish trend. What’s needed now is clear evidence of strength, both in candle structure and volume support.
What to Expect in the Coming Price Action
Sonic Token needs to hold its current support zone on a daily close basis to maintain bullish structure. If it does, a rotation toward $0.42 is likely. A breakdown risks a deeper correction.
SONIC. USDTIt's been a long time the current Sonic( S ), and the Fantom of the past have been moving in neutral.
So,
It's time to make a profit for their investors.

S - SONIC 1DSonic lacks the buying volume to break through its resistances.
The project, after a name change, has become Matic 2.
I expect that we'll soon reach support levels of 30 cents and 25 cents after the pullback is complete. If these supports are broken, the next support levels will be 20 cents and 17 cents.
If the 40 to 43 cent resistance breaks with high volume, there's a possibility of growth to 50 cents. If 50 cents is broken, growth to 63 cents becomes possible.

$SUSDT (or S , ex FANTOM): good entry for a long setupCrypto Market Outlook
The overall crypto market is in a clear uptrend.
The money printer is running, and USD dominance is dropping — all signs pointing to a potential continuation of the rally in the coming months.
Unless a black swan event hits, it's not too late to position yourself if you’re still on the sidelines.
⚠️ Always manage your risk with a proper stop loss — altcoins move fast and can reverse just as quickly.
One interesting setup: $S
✅ Relatively new
✅ Didn’t pump too hard
✅ Broke out of its downtrend
✅ Found solid support
The Fib levels offer good targets for take profit zones.
🔍 Ideal entry: within the green box or lower.
Let the pump cool off — it could offer a perfect entry opportunity. Be patient and wait for a good position.
If $S pumps from here without retrace:
→ Jump in with a tight stop loss
→ Or look elsewhere for a better risk/reward setup.
DYOR.
#Crypto #Altcoins #Bitcoin #ETH #Trading #CryptoMarket #TechnicalAnalysis #RiskManagement #DYOR

S (Sonic Network) Bullish daily hammer candle closed above a key daily swing high.
So much liquidity to take above.
Send it.
25-28% daily candle loading
