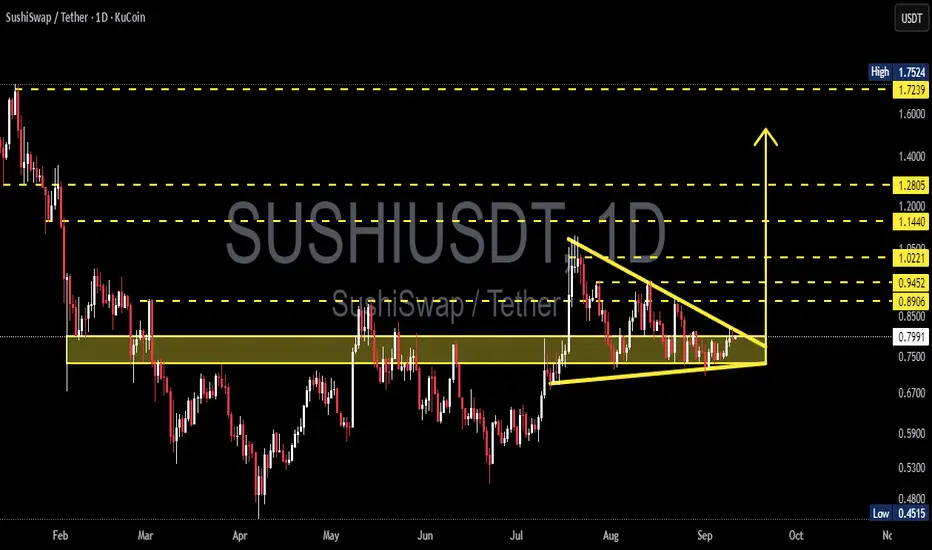
sushi/usdtsushi has been trading on a descending triangle for some times now and there is a higher probability that it is eventually coming into an end, that is in the near future, which might be so soon, we might see a big improvement in price if everything goes as planned. These support levels shows that th

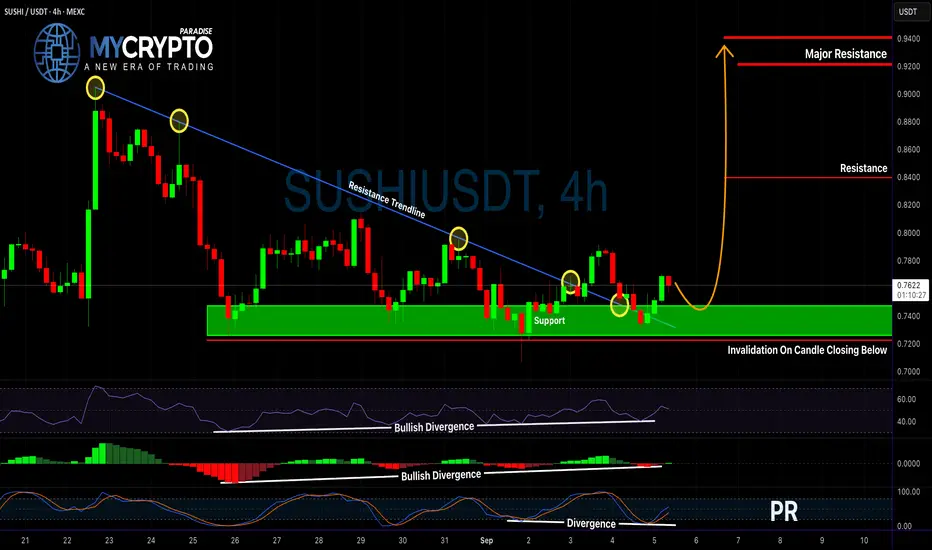
SUSHIUSDT Breakout or Bull Trap?Yello, Paradisers – could this finally be the moment SUSHIUSDT flips the script, or are we about to walk into another trap? With Bitcoin potentially preparing for a short-term pullback, traders need to be extra cautious right now. That said, SUSHIUSDT is showing promising signals that are worth your
SUSHI/USDT – Symmetrical Triangle Compression Near Key Flip Zone🔎 Market Overview
SUSHI is currently trading around $0.799, consolidating within a symmetrical triangle pattern that has been forming since mid-July. This setup reflects a period of decreasing volatility and volume, where the market is accumulating energy for the next major move.
The $0.72–0.83 zo
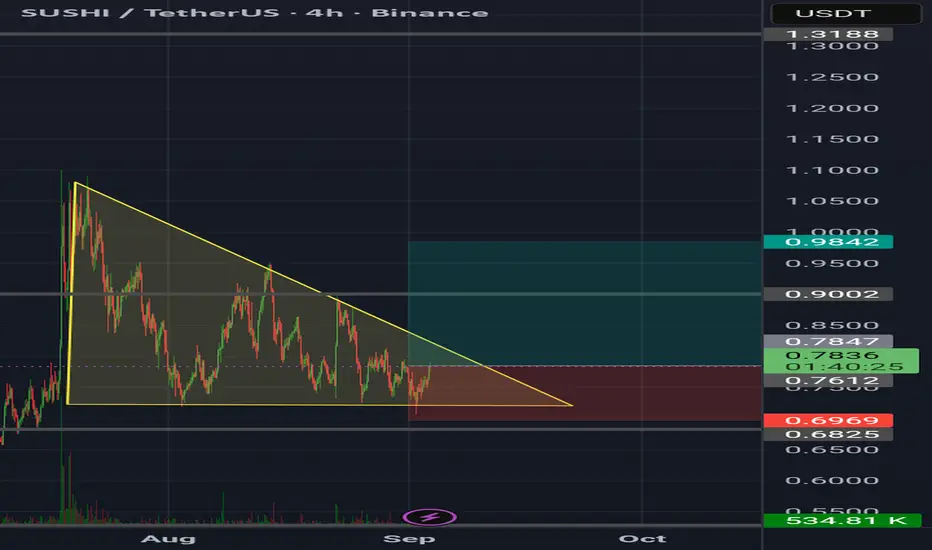
SushiSushi usdt daily analysis
Time frame 4hours
Risk rewards ratio >2.3
First target 0.985$
Sushi, as you can see in the chart, is trapped inside a yellow triangle.
If the price breaks out above the upper side of the triangle, our initial target will become achievable.
If we experience small fluctuat
SUSHI TARGET TPPrice (USD)
23.00 ┤ 🎯 Final Target
12.00 ┤ ⚡ Resistance / Long-term Target
7.00 ┤ 🎯 Mid-term Target
3.50 ┤ 🎯 Short-term Target
1.85 ┤ ⚡ Resistance / Breakout Zone
1.20 ┤ 🎯 First Target
0.8

Resistance is broken!!!Hello friends
it is clear that we have a downtrend and in this downtrend we have an important resistance that we have identified for you and given the strength of the sellers, the price has not yet managed to break this resistance.
We also found important support points with Fibonacci (which has

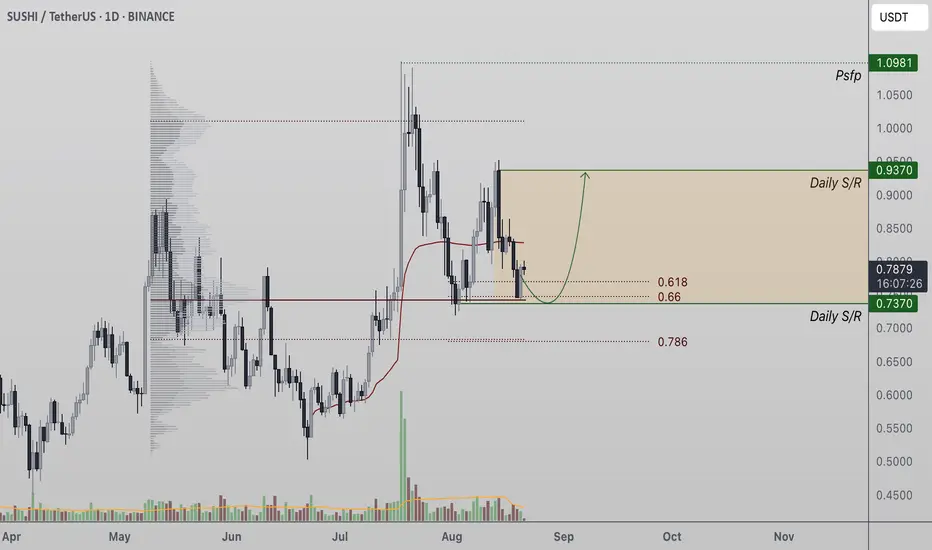
Sushi Holds Key Fibonacci Support as Bulls Target $0.93Sushi (SUSHI) has bounced from the $0.73 daily support, where the point of control (POC) and 0.618 Fibonacci retracement converge. This bullish reaction increases the probability of a continuation toward $0.93.
Sushi’s recent price action highlights a strong defense of a key technical zone. The $0.
Sushi bull run Sushi just broke the resistance level and made a retest , now it is time to go to the moon

SUSHI LONG TERM POSITIONGoing to be entering at the .618 Fib level (Golden Pocket) for a long position.
ETH has been pumping, this money will start rotating soon enough and i'm betting sushi swap will get a nice pump in the upcoming weeks...

[Deep Dive] SUSHI – Edition 3: Accumulate. Anticipate. Accelerat🧠 Cycle Anatomy: What the Chart Is Telling Us
📉 Phase 1: Markdown
The bears dominated, slicing price downward into key historical support around the $0.50 mark — the same level that anchored the previous accumulation zone.
📦 Phase 2: Accumulation
Both accumulation phases (mid-2023 and Q2 2025

See all ideas
Summarizing what the indicators are suggesting.
Oscillators
Neutral
SellBuy
Strong sellStrong buy
Strong sellSellNeutralBuyStrong buy
Oscillators
Neutral
SellBuy
Strong sellStrong buy
Strong sellSellNeutralBuyStrong buy
Summary
Neutral
SellBuy
Strong sellStrong buy
Strong sellSellNeutralBuyStrong buy
Summary
Neutral
SellBuy
Strong sellStrong buy
Strong sellSellNeutralBuyStrong buy
Summary
Neutral
SellBuy
Strong sellStrong buy
Strong sellSellNeutralBuyStrong buy
Moving Averages
Neutral
SellBuy
Strong sellStrong buy
Strong sellSellNeutralBuyStrong buy
Moving Averages
Neutral
SellBuy
Strong sellStrong buy
Strong sellSellNeutralBuyStrong buy
Displays a symbol's price movements over previous years to identify recurring trends.