SUSHI USDT LONG SIGNAL
---
📢 Official Trade Signal – SUSHI/USDT
📈 Position Type: LONG
💰 Entry Price: 0.4020
---
🎯 Take-Profit Targets (Partial Exits):
TP1 = 0.4126
TP2 = 0.4251
TP3 = 0.4349
TP4 = 0.4456
TP5 = —
---
🛑 Stop-Loss: 0.3945
📊 Timeframe: 15m
⚖️ Risk/Reward Ratio: 3.68
💥 Suggested Leverage: 5× – 10×
---
🧠 Technical Context
SUSHI is bouncing strongly from a short-term demand zone around 0.4000, showing early bullish momentum.
Market structure shift plus liquidity gaps above align with the upside targets, supporting continuation to the next resistance levels.
---
⚙️ Trade Management Rules
✔️ Take partial profit at TP1
✔️ Move SL to Break-Even as soon as TP1 is hit
✔️ Trail SL gradually as price moves toward TP2–TP4
✔️ Avoid re-entry if SL is triggered
✔️ Confirm structure before execution
---
⚠️ Risk-Management Note
If TP1 is reached and SL moves to BE, a later stop-out at break-even is not a loss — it means zero risk.
Capital protection always comes first.
---
📌 TradingView Hashtags
#SUSHIUSDT #SUSHI #CryptoSignal #LongSetup #TechnicalAnalysis
#TradingView #FuturesTrading #Altcoins
---
Trade ideas

SUSHI USDT LONG SIGNAL---
SUSHI/USDT — Long Setup
Entry
0.4785
Take-Profit Targets
TP1: 0.4855
TP2: 0.4944
TP3: 0.5044
TP4: 0.5180
Stop-Loss
0.4600
Risk/Reward
2.20
Leverage Suggestion
5× – 10×
---
Technical Outlook
Price is holding above the short-term support zone around 0.47, showing early signs of bullish momentum.
A break and close above 0.4850 can trigger continuation toward the mid-range resistance levels at 0.494–0.504.
Volume remains stable and RSI is gradually turning upward, supporting a potential bullish move.
---
Trade Management
Take partial profit at TP1 and move stop-loss to break-even.
Use a trailing stop for higher targets.
Invalidation occurs if price closes below 0.4600.
---
Hashtags (TradingView-friendly)
#SUSHIUSDT #CryptoTrading #TradingSignal #Altcoins #TechnicalAnalysis #Futures
---

SUSHI USDT LONG SIGNAL---
📢 Trade Idea: SUSHI/USDT
Type: Long
Entry Price: 0.4693
🎯 Take-Profit Targets:
• TP1 = 0.4835
• TP2 = 0.4964
• TP3 = 0.5125
🛑 Stop-Loss: 0.4600
⏱ Timeframe: 1H
⚖️ Risk/Reward Ratio: 4.85
💥 Suggested Leverage (if applicable): 5x–10x
---
Technical Analysis:
SUSHI has formed a solid bullish reversal structure near the 0.46 support zone, showing accumulation signs after a period of consolidation.
A breakout above 0.47 confirms short-term strength, targeting 0.4835 and 0.50 levels as immediate resistance points.
RSI recovery from oversold and bullish EMA alignment indicate increasing momentum toward 0.51+.
---
Trade Management Tips:
• Take partial profits at each TP.
• Move SL to entry after TP1.
• Setup invalid if price closes below 0.46 on the 1H timeframe.
---
⚠️ Disclaimer:
This analysis is for educational purposes only and not financial advice.
Always DYOR and apply proper risk management before trading.
---
📌 Hashtags for TradingView:
#SUSHIUSDT #CryptoSignals #LongSetup #TechnicalAnalysis #CryptoTrading #TradingViewIdea #SUSHI

SUSHI LONG SIGNAL---
📢 Signal Alert
🔹 Pair: SUSHI / USDT
📈 Trade Type: Long
💰 Entry Zone: 0.4950 – 0.5077
🎯 Take-Profit Targets (Partial Management):
▫️ TP1 = 0.5300
▫️ TP2 = 0.5500
▫️ TP3 = 0.5770
▫️ TP4 = 0.6050
🛑 Stop-Loss: 0.4800
📊 Timeframe: 1H
⚖️ Risk/Reward Ratio: 3.83
📌 Suggested Leverage: 5x – 10x
⚠️ Capital management is mandatory.
💬 Please review the chart before entering the trade.
---
🧠 Technical Analysis Summary:
SUSHI is showing bullish accumulation near the support zone 0.49–0.50, with an increase in buying volume.
The RSI is recovering from the oversold area, confirming a potential momentum reversal.
If the price holds above 0.505, a move toward 0.55–0.60 resistance is expected.
Short-term EMAs (20 & 50) are aligning for a bullish crossover, signaling early trend recovery.
---
⚙️ Trade Management Tip:
When TP1 is reached, move stop-loss to entry.
Gradually secure profits at each TP level — let the remaining position ride with a trailing stop for potential extended gains.
---
⚠️ Disclaimer:
This analysis is for educational purposes only and not financial advice.
Always DYOR (Do Your Own Research) and apply strict risk management.
---

SUSHI USDT LONG SIGNAL---
📢 Signal Alert
🔹 Pair: SUSHI / USDT
📈 Trade Type: Long
💰 Entry: 0.5050 – 0.4890
🎯 Take-Profit Targets (Partial Management):
▫️ TP1 = 0.5170
▫️ TP2 = 0.5318
▫️ TP3 = 0.5590
▫️ TP4 = 0.5850
🛑 Stop-Loss: 0.4835
📊 Timeframe: 1H
⚖️ Risk/Reward Ratio: 3.00
📌 Suggested Leverage: 5x – 10x
⚠️ Capital management is mandatory.
💬 Please review the chart before entering the trade.
---
🧠 Technical Analysis Summary:
SUSHI is forming a bullish structure above key support near 0.49, with strong buying volume confirmation.
A breakout above 0.517 could push price toward 0.55 – 0.58 resistance zone.
RSI is crossing upward from the midline, and price is holding above EMA 20 on the 1H chart — both confirming bullish momentum.
---
⚙️ Trade Management Tip:
Take partial profit at TP1, then move stop-loss to entry.
Trail stop toward TP2–TP3 to secure gains.
Avoid re-entry if price closes below 0.4835.
---
⚠️ Disclaimer:
This analysis is for educational purposes only and not financial advice.
Always DYOR (Do Your Own Research) and apply strict risk management.

SUSHI - FOLLOWING THE PLAN! 10% down on SEED_DONKEYDAN_MARKET_CAP:SUSHI - following exactly the plan.
Gamebreaker incoming? 🎮

Long trade 📘 Trade Journal Entry
Pair: SUSHIUSDT.P
Direction: Buy-Side Trade
Date: Sat 1 Nov 25
Time: 6:30 am
Session: LND to NY Session PM
Timeframe: 15 Min
🔹 Trade Details
Metric Value
Entry 0.5094
Profit Level (TP) 0.5846 (+15.28 %)
Stop Level (SL) 0.5041 (–1.38 %)
Risk–Reward (RR) 11.07 R
🔸 Technical Context
Structure:
Price completed a clear re-accumulation phase after a multi-session decline.
The CHOCH → BOS sequence on the 15 m timeframe confirmed bullish intent.
Liquidity sweep beneath 0.50 zone (prior Asian lows) provided the displacement and smart-money entry.
Key Zones:
Demand Zone: 0.497 – 0.501 (previous breaker block + FVG mitigation).
Target Zone: 0.580 – 0.585 (previous London/NY liquidity high cluster).
Adaptive MA (KAMA): Now curling upward, acting as dynamic support.
Volume Profile:
Volume expansion noted during London open; follow-through in NY confirms participation from larger players after mid-week compression.
🔹 Narrative & Bias
SUSHI formed a clean spring + retest pattern within the accumulation base, suggesting strong buy-side intent. The entry coincided with a liquidity sweep and rejection from demand confluence, triggering a structural breakout above the 0.51 handle.
Confluences:
15 m CHOCH + BOS confirmation.
4 h FVG alignment and daily order-block support.
Volume divergence → bullish reversal confirmation.
KAMA support + London–NY session continuation.
Projection:
Expect sustained continuation toward 0.58–0.59 zone, potentially extending into 0.61–0.62 if volume persists through NY close. Partial profits ideal near 1.618 extension (~0.575) before evaluating re-entry opportunities.

SUSHIUSDT 1D#SUSHI is moving inside a descending triangle on the daily chart and is currently sitting on a strong support zone, from which an upward move is expected. If that happens, the potential targets are:
🎯 $0.6336
🎯 $0.7227
🎯 $0.7913
🎯 $0.8533
🎯 $0.9835
🎯 $1.1388
🎯 $1.2941
🎯 $1.5153
🎯 $1.7970
⚠️ Always remember to use a tight stop-loss and maintain proper risk management.

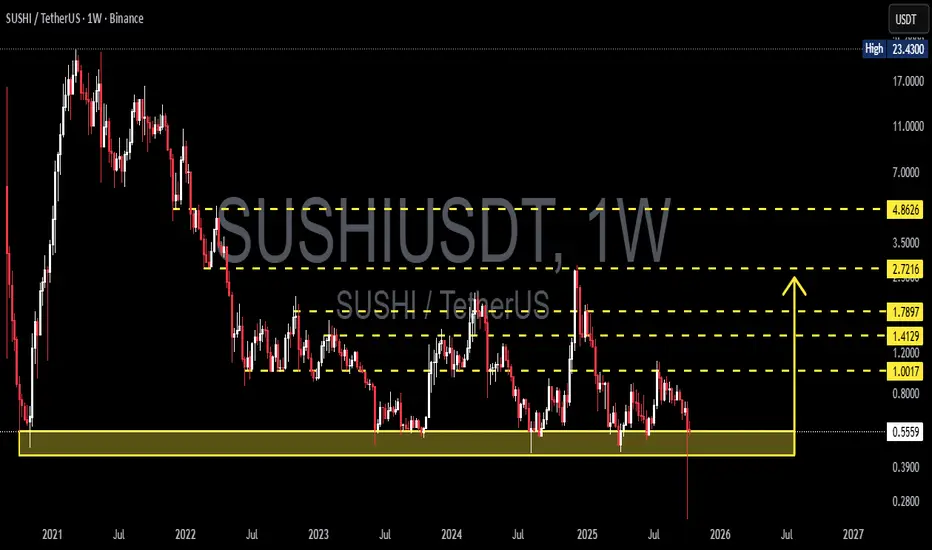
SUSHI/USDT — Decision Zone! Accumulation or Breakdown Oblivion?SUSHI has returned to its major historical support zone between 0.553 – 0.44 USDT, an area that has held firm since 2022.
Each time price has entered this block, the market has shown signs of a relief bounce and potential accumulation — but the more a level is tested, the weaker it tends to become.
Since its 2021 peak, SUSHI has remained in a long-term downtrend, forming consistent lower highs and lower lows.
However, the presence of deep long wicks beneath the current range indicates liquidity sweeps — a classic signature of hidden accumulation by strong hands preparing for a potential reversal.
---
📊 Pattern & Structure
Primary trend: Long-term downtrend (bearish structure)
Major Support Zone (yellow block): 0.553 – 0.44 USDT
Potential Pattern: Double Bottom or Spring Phase (if the price rebounds strongly from this zone)
Key Resistance Levels (target zones):
1.0017
1.4129
1.7897
2.7216
4.8626
---
Bullish Scenario
Price holds the yellow block and rejects any breakdown below 0.44.
A strong confirmation would come from a weekly close above 0.553 with rising volume.
Formation of a higher low would signal the start of structural reversal.
A decisive breakout and weekly close above 1.00 USDT would confirm a major trend shift.
Gradual bullish targets: 1.00 → 1.41 → 1.78 → 2.72 → 4.86 USDT.
Additional narrative:
This area could represent an institutional accumulation zone, similar to previous DeFi cycle reaccumulation phases.
If DeFi narratives regain momentum, SUSHI could emerge as one of the stronger comeback tokens.
---
Bearish Scenario
A weekly close below 0.44 would confirm a structural breakdown.
The 0.553–1.00 zone would flip into a strong supply area, likely acting as resistance on any retest.
Price could then slide further toward the psychological zone of 0.30–0.28 USDT or even lower if selling pressure continues.
---
Conclusion
SUSHI now stands at a make-or-break point in its multi-year cycle.
The yellow block at 0.553 – 0.44 is not just a support zone — it’s the final line of defense that has protected this structure since 2022.
If it holds, a major reversal could unfold.
If it breaks, a new phase of capitulation may begin.
The next weekly close will define SUSHI’s fate.
Traders should wait for clear confirmation before committing to any large directional move.
#SUSHI #SUSHIUSDT #Crypto #DeFi #TechnicalAnalysis #SupportResistance #SwingTrading
SUSHI/USDT Buy limitSetting buy limits in the 3D FVG. Normally get a wick down before the move up which would leave a lot of people liquidated / stopped out. Stochastic rsi crossing over at the lows and Volume decreasing on this pullback. Bullish on Sushi and think that FVG would be a great spot buy with good risk/reward.

SUSHI Ready for 200 % Up Move SUSHI is forming expansion channel and moving inside that pattern and now it is at support and breaking from a pattern at support , so we can expect 200 % Up move from that breakout .
and at the same time Bitcoin dominance is decreasing and altcoins dominance is started increasing , so look on all the altcoins
and follow proper risk management , it has very good chances to move UP side but first we have to protect the down side , where risk management comes into game .
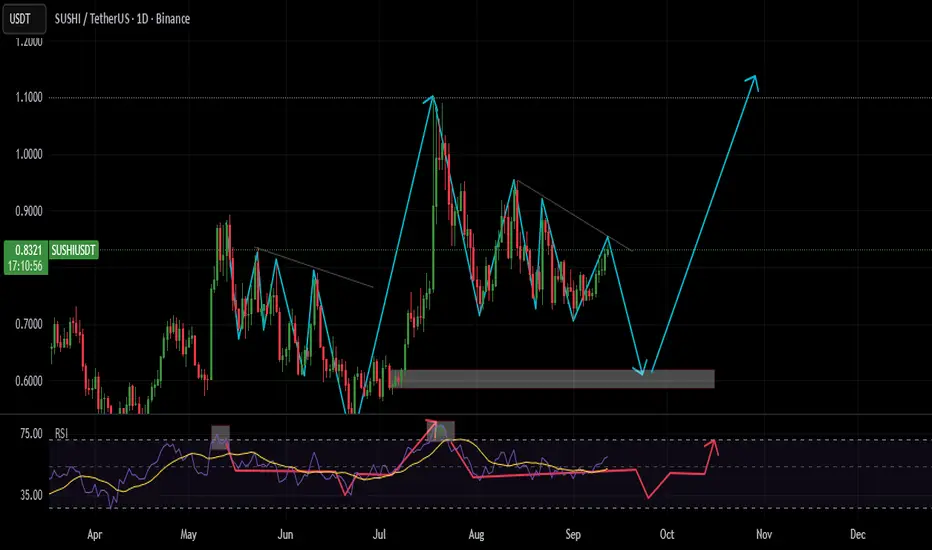
sushi long ?The pattern we had in the previous move is likely to repeat again. Pay attention to how the price and RSI move. It's very interesting.
I hope it repeats again.
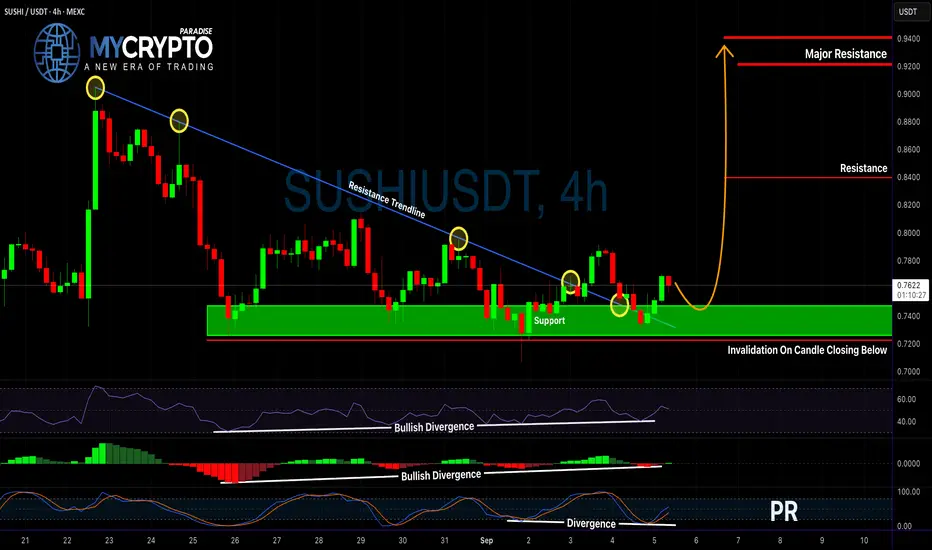
SUSHIUSDT Breakout or Bull Trap?Yello, Paradisers – could this finally be the moment SUSHIUSDT flips the script, or are we about to walk into another trap? With Bitcoin potentially preparing for a short-term pullback, traders need to be extra cautious right now. That said, SUSHIUSDT is showing promising signals that are worth your full attention.
💎After a prolonged downtrend, SUSHIUSDT has broken out of a significant resistance trendline. What makes this breakout more convincing is the confluence of bullish signals appearing across multiple technical indicators. We’re seeing bullish divergence on both the RSI and MACD, suggesting a shift in underlying momentum. On top of that, the Stochastic RSI is showing hidden bullish divergence, which typically signals the continuation of an uptrend. Together, these factors increase the probability of a meaningful bullish move.
💎From a trading strategy perspective, aggressive traders may choose to enter at the current market price. This entry offers a risk-to-reward ratio close to 1:2, which meets the basic criteria for a solid trade setup. However, conservative traders should consider waiting for a potential pullback. Given the current market conditions and the likelihood of a short-term correction in BTC, a retest of the breakout level is likely. If SUSHIUSDT retest support—and prints a clear bullish candlestick pattern, that could offer a safer entry with an even better risk-to-reward profile.
💎It’s crucial to note that this bullish scenario becomes invalid if SUSHIUSDT breaks below the support zone and closes a candle beneath it. In that case, the technical setup would be considered broken, and it would be wise to stay out of the trade until a stronger, more reliable structure develops.
Strive for consistency, not quick profits. Treat the market as a businessman, not a gambler. Only those who stay disciplined and wait for confirmed setups will come out on top in the long run. Patience and strategy will always beat emotion and FOMO. Trade smart, Paradisers.
MyCryptoParadise
iFeel the success🌴
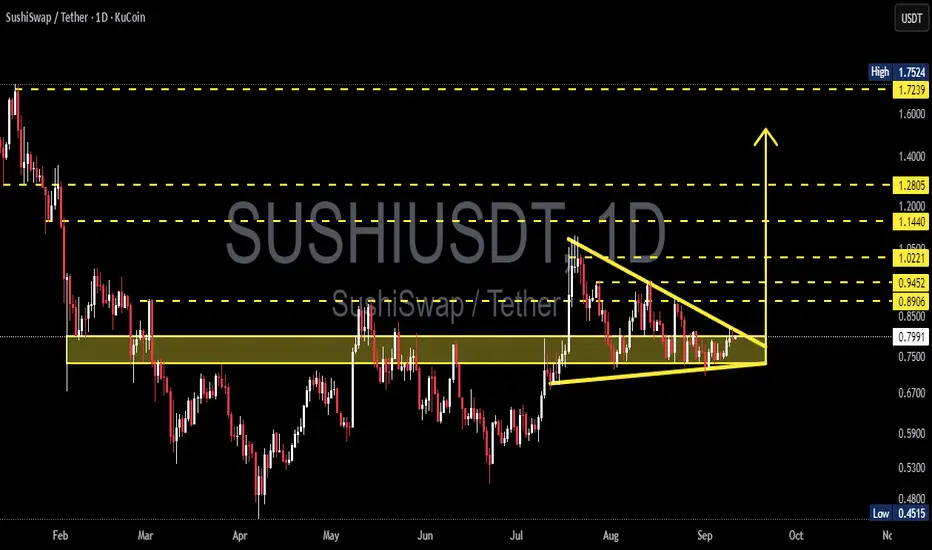
SUSHI/USDT – Symmetrical Triangle Compression Near Key Flip Zone🔎 Market Overview
SUSHI is currently trading around $0.799, consolidating within a symmetrical triangle pattern that has been forming since mid-July. This setup reflects a period of decreasing volatility and volume, where the market is accumulating energy for the next major move.
The $0.72–0.83 zone is acting as a critical support-resistance flip area, tested multiple times since March. This is the battlefield where bulls and bears are fighting for dominance. The eventual breakout from this zone will likely dictate the mid-term trend.
---
📐 Technical Pattern Breakdown
Symmetrical Triangle: Converging trendlines (lower highs + higher lows). Neutral by nature, direction depends on breakout.
Historical Context: Prior to the triangle, price rallied from $0.45 → $1.05, hinting this could be a bullish continuation pattern if an upside breakout occurs. Still, the broader macrotrend has been bearish since the start of the year, so both outcomes remain on the table.
Key Levels:
Major Supports: $0.72 → $0.67 → $0.45
Major Resistances: $0.89 → $0.94 → $1.02 → $1.14 → $1.28 → $1.72
---
🚀 Bullish Scenario (Upside Breakout)
If price manages to close a daily candle above the $0.85–0.89 resistance trendline with strong volume, upside potential is significant. Bullish targets include:
🎯 Target 1: $0.945
🎯 Target 2: $1.02
🎯 Target 3: $1.14
🎯 Target 4: $1.28
🎯 Extended Target: $1.72
This would represent a possible +100% upside if momentum builds.
Bullish Confirmation Signals:
Daily close above $0.89–0.94
Increasing breakout volume
Successful retest holding above former resistance
---
🐻 Bearish Scenario (Downside Breakdown)
Failure to hold the $0.72–0.75 flip zone would likely trigger a bearish continuation. Downside targets are:
🎯 Target 1: $0.67
🎯 Target 2: $0.59
🎯 Target 3: $0.45 (yearly low & major psychological support)
A confirmed breakdown could mean a -30% to -40% drop from current levels.
Bearish Confirmation Signals:
Daily close below $0.72
Strong selling volume
Retest rejection at $0.72 (new resistance)
---
⚖️ Trading Strategy & Risk Management
Conservative traders: Wait for a confirmed breakout + retest before entering.
Aggressive traders: Consider entries near triangle support (~$0.75) with tight SL below $0.70.
Risk control: Limit exposure to 1–3% of total capital per trade, use disciplined stop-losses, and take profits in stages at key levels.
Risk/Reward: Look for setups with at least a 2:1 or 3:1 ratio.
---
📌 Conclusion
SUSHI is at a critical crossroads. The symmetrical triangle suggests a powerful move is imminent. A breakout to the upside opens the door for a rally toward $1.72, while a breakdown could drag price back toward $0.45.
Traders should focus on confirmation signals before committing, as the next breakout will likely define the mid-to-long term trend.
---
#SUSHI #SUSHIUSDT #SushiSwap #CryptoAnalysis #TechnicalAnalysis #TrianglePattern #BreakoutTrading #SupportResistance #CryptoTrading #Altcoins
sushi/usdtsushi has been trading on a descending triangle for some times now and there is a higher probability that it is eventually coming into an end, that is in the near future, which might be so soon, we might see a big improvement in price if everything goes as planned. These support levels shows that there is a level that the sellers can't break for now though not permanent, a breakdown on this level will imply a high selling pressure accompanied by high volume. Vice versa, a breakout followed by increase in price volume then bet we are on a run. Let wait and see

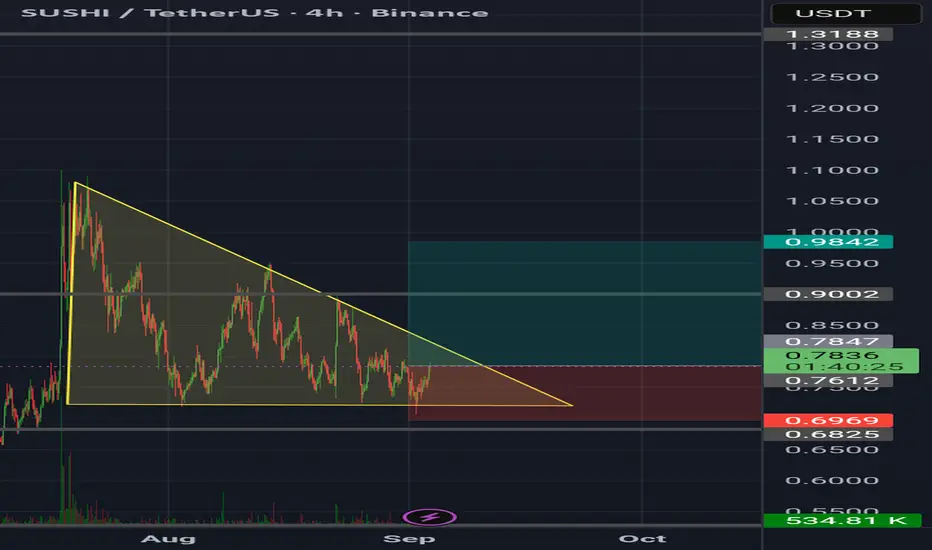
SushiSushi usdt daily analysis
Time frame 4hours
Risk rewards ratio >2.3
First target 0.985$
Sushi, as you can see in the chart, is trapped inside a yellow triangle.
If the price breaks out above the upper side of the triangle, our initial target will become achievable.
If we experience small fluctuations like earlier this week, Sushi will continue to move up and down within the triangle.
The lower support line is very strong, and we’ve placed the stop loss (SL) below it for extra reassurance.
SUSHI TARGET TPPrice (USD)
23.00 ┤ 🎯 Final Target
12.00 ┤ ⚡ Resistance / Long-term Target
7.00 ┤ 🎯 Mid-term Target
3.50 ┤ 🎯 Short-term Target
1.85 ┤ ⚡ Resistance / Breakout Zone
1.20 ┤ 🎯 First Target
0.80 ┤━━━━━━ 🔹 Current Price / Strong Support
⚡ Major Support
Whale-Friendly Key Points
Strong Support: $0.80 → prime accumulation zone
Entry Signal: Whales entering here can ignite the next wave
Short-term Target: $1.20 → first breakout trigger
Next Steps: $1.85 → $3.50 → $7.00 as momentum builds
Final Whale Target: $23 → legendary DeFi comeback 🚀
Stop Loss: $0.69 for disciplined risk control
💎 Why Whales Should Watch SUSHI
Ultra-low entry compared to historical highs
Clear step-by-step roadmap to scale positions
DeFi revival narrative strengthens upside potential
Perfect setup for parabolic growth if whales fuel momentum
🐋 Whales are watching closely—position smartly to ride SUSHI from $0.80 to $23. 🚀

Resistance is broken!!!Hello friends
it is clear that we have a downtrend and in this downtrend we have an important resistance that we have identified for you and given the strength of the sellers, the price has not yet managed to break this resistance.
We also found important support points with Fibonacci (which has now become resistance) that the price reacted to once and still could not break its resistance. However, if this resistance is broken, the specified Fibonacci steps, which are also resistance, can be our target and the price can move to these resistances, of course, if the support is maintained and the specified resistance is broken. Observe risk and capital management.
*Trade safely with us*

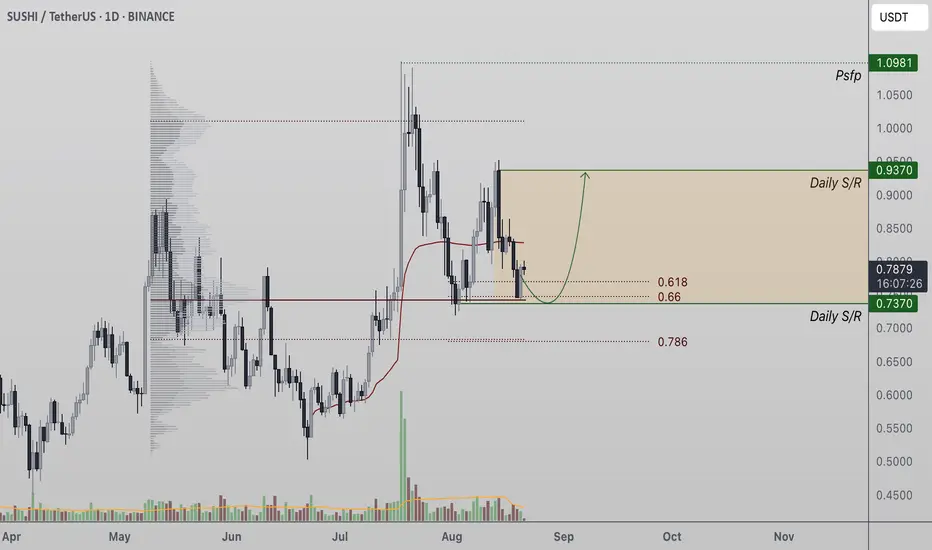
Sushi Holds Key Fibonacci Support as Bulls Target $0.93Sushi (SUSHI) has bounced from the $0.73 daily support, where the point of control (POC) and 0.618 Fibonacci retracement converge. This bullish reaction increases the probability of a continuation toward $0.93.
Sushi’s recent price action highlights a strong defense of a key technical zone. The $0.73 level, which combines the point of control and the golden pocket retracement at 0.618 Fibonacci, has acted as a springboard for a bullish reaction. From a structural standpoint, the market remains bullish on the daily time frame, supported by a consistent pattern of higher highs and higher lows. This corrective dip is therefore considered a constructive retest, not a breakdown.
The reaction from this confluence level is particularly important. The point of control reflects the area of highest traded volume, suggesting strong market interest, while the golden pocket retracement is historically one of the most reliable continuation zones. The overlap of these two signals makes $0.73 a critical support to hold for the ongoing uptrend.
Key Technical Points:
- $0.73 Support Zone: Confluence of POC and 0.618 Fibonacci retracement, currently defended by bulls.
- Daily Market Structure: Higher highs and higher lows intact, framing the correction as a higher low.
- Upside Target at $0.93: Holding support sets up a rally toward the next resistance level.
From a technical perspective, the corrective move into $0.73 fits neatly into the broader bullish market structure. Each pullback has so far resulted in the establishment of higher lows, signaling continued demand. The latest bounce suggests traders are still committed to accumulating Sushi at discounted levels, increasing the likelihood of upside continuation.
Momentum indicators also support the bullish case. Price remains above its daily moving averages, and the rejection of lower levels indicates strong absorption of selling pressure. If follow-through buying emerges, a push toward $0.93 resistance becomes the most probable scenario in the near term.
The broader structure for Sushi shows potential for further bullish expansion beyond $0.93 if momentum continues to build. While short-term volatility may remain, the combination of strong support, healthy retracement levels, and consistent higher-time frame structure keeps the outlook tilted toward the upside.
What to Expect in the Coming Price Action
As long as Sushi defends the $0.73 region on daily closes, the bullish market structure remains intact. A rally toward $0.93 is the immediate projection, with the potential for further continuation if volume supports the breakout. Traders should watch for consolidation above support and increasing demand, as these will confirm the validity of the ongoing trend.
Sushi bull run Sushi just broke the resistance level and made a retest , now it is time to go to the moon

SUSHI LONG TERM POSITIONGoing to be entering at the .618 Fib level (Golden Pocket) for a long position.
ETH has been pumping, this money will start rotating soon enough and i'm betting sushi swap will get a nice pump in the upcoming weeks...

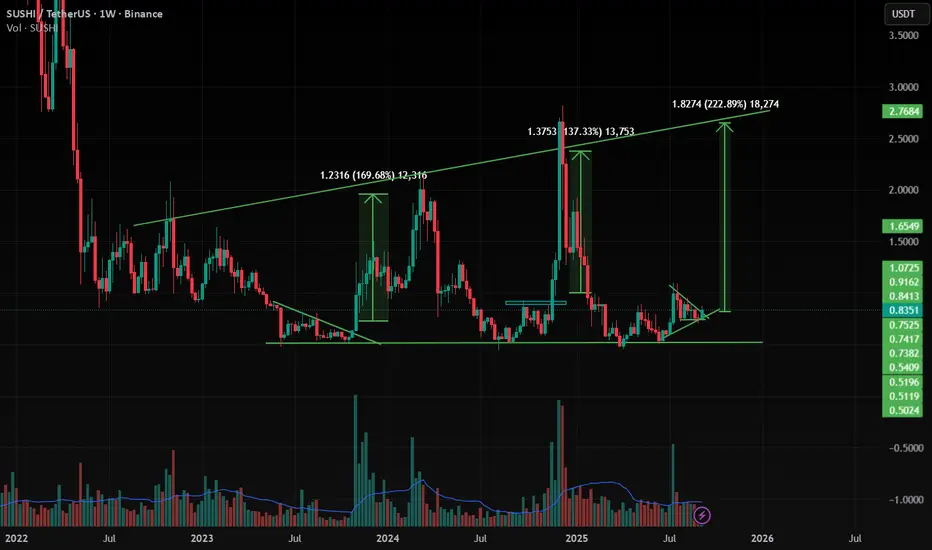
[Deep Dive] SUSHI – Edition 3: Accumulate. Anticipate. Accelerat🧠 Cycle Anatomy: What the Chart Is Telling Us
📉 Phase 1: Markdown
The bears dominated, slicing price downward into key historical support around the $0.50 mark — the same level that anchored the previous accumulation zone.
📦 Phase 2: Accumulation
Both accumulation phases (mid-2023 and Q2 2025) occurred near identical support zones, with rounded bases and sideways chop — signaling strong hands quietly absorbing supply.
📈 Phase 3: Markup Incoming?
Following breakout point “1” and retest point “2,” the current structure aligns remarkably well with the previous markup phase — which propelled SUSHI from ~$0.50 to over $3 in just weeks. While past performance isn’t a guarantee, this fractal deserves attention.
🔥 Why Fundamentals May Support This Move
- SushiSwap v3 continues rolling out on multiple chains, optimizing capital efficiency and fee structure for LPs.
- Governance has stabilized after the rough patches of 2022–2023, with more transparent treasury and development direction.
- Cross-chain expansion and integrations with major aggregators (like 1inch, Matcha, and DeBank) are boosting SUSHI’s visibility in the broader DeFi flow.
Additionally, a surge in TVL and DEX activity on low-fee chains could redirect volume back to SushiSwap — a platform known for its cross-chain capabilities.
📍 What to Watch Next
- A confirmed breakout above $1.00 would validate the “markup” thesis.
- A dip toward the $0.65–$0.70 zone could offer a high-risk/reward entry aligned with point “2.”
- Failure to hold the $0.50 level would invalidate the structure.
For now, the rhythm is clear: markdown → accumulation → markup. And if the pattern holds, SUSHI might just be preparing for its third vertical.
💬 Do you think this is just another fakeout — or is SUSHI gearing up for a DeFi comeback?
🔔 Disclaimer: This post is for educational and informational purposes only. It does not constitute financial advice. Always do your own research and manage risk carefully.
📚 Always follow your trading plan => including entry, risk management, and trade execution.
Good luck!
All strategies are good, if managed properly.
~ Richard Nasr

SUSHIUSDT at a Critical Pivot Golden Pocket Retest or Bull Trap?📊 Full Daily Chart Analysis (1D) — KuCoin
After months of dull sideways movement, SUSHI is finally showing signs of life! A strong breakout above a long-term consolidation range has pushed price up to the key resistance at $1.03, raising the possibility of a mid-term trend reversal.
However, the price is now entering a pullback phase. The key question:
Is this just a healthy correction before the next leg up—or the beginning of another downward move?
---
🔍 Structure & Pattern Breakdown:
Rounded Bottom Formation:
Formed from April to July 2025, this pattern signals a shift from accumulation to potential bullish expansion.
Confirmed Breakout:
A breakout above the neckline at $0.80, supported by increasing volume, suggests this move is legitimate—not a fakeout.
Golden Pocket Retest (Key Fibonacci Zone):
Price is currently pulling back into the Fibonacci Golden Pocket (0.5 at $0.7992 and 0.618 at $0.7295) — the most ideal technical zone for a bullish re-entry. This area also aligns with a strong historical demand zone.
---
📈 Bullish Scenario (Primary Case):
If daily candles hold above the $0.7295–$0.7992 zone and form a strong reversal signal (e.g. bullish engulfing or hammer):
Price is likely to retest $1.03 (minor resistance).
A successful breakout above $1.03 could lead to a rally toward:
🔸 $1.3374 – Previous horizontal resistance
🔸 $1.8307 – Key psychological level & March 2025 swing high
🔸 $2.6591 – Fibonacci extension target
🔸 $2.8195 – Major high from November 2024
This could mark the beginning of a mid-term bullish trend if volume continues to build.
---
📉 Bearish Scenario (Alternative Case):
If the price fails to hold above the Golden Pocket and breaks below $0.7295:
A deeper correction is likely, with price revisiting $0.60 or even retesting the bottom zone at $0.4515.
This would invalidate the bullish setup and confirm a bull trap.
---
🧠 Conclusion:
SUSHI is at a decisive moment. This retest of the Golden Pocket will determine whether this is simply a healthy pullback within a new uptrend, or the early sign of another bearish breakdown.
> Plan the trade, trade the plan. The $0.73–$0.80 zone is the battlefield for SUSHI’s next major move.
---
📌 Key Levels:
Level Description
$0.7295–$0.7992 Golden Pocket (Fibonacci Re-Entry Zone)
$1.03 Minor Resistance
$1.3374 Bullish Target 1
$1.8307 Bullish Target 2 (Mid Resistance)
$2.6591–$2.8195 Long-Term Bullish Targets
$0.60 / $0.4515 Bearish Supports if Breakdown Occurs
#SUSHIUSDT #CryptoBreakout #FibonacciTrading #GoldenPocket #AltcoinReversal #SushiSwap #CryptoSetup #TechnicalAnalysis #BullishScenario
