$SPCE long? Massive move incoming?NYSE:SPCE is starting to look really interesting here. It's been in a downtrend for years but the chart is starting to shape up.
If price can break up above $4.43, then I think it's likely that we could see a strong move to one of the resistance levels above.
We've already had multiple tests of
Next report date
—
Report period
—
EPS estimate
—
Revenue estimate
—
−6.3665 EUR
−334.94 M EUR
6.80 M EUR
62.70 M
About Virgin Galactic Holdings, Inc.
Sector
Industry
CEO
Michael A. Colglazier
Website
Headquarters
Tustin
Founded
2017
ISIN
US92766K4031
FIGI
BBG014GWSXR0
Virgin Galactic Holdings, Inc. is an aerospace and space travel company, which engages in the provision of consumer space experience using reusable spaceflight systems. The firm is also involved in designing, developing, and manufacturing, ground and flight testing, spaceflight operation, and post-flight maintenance of spaceflight systems. The company was founded on May 5, 2017 and is headquartered in Tustin, CA.
Related stocks

$SPCE - Commercial Flights On Track for 2026 - Virgin GalacticVirgin Galactic reported a Q3 2025 net loss of $64 million, improving from $75 million a year ago. Operating expenses declined to $66–67 million (from ~$82 million), and adjusted EBITDA improved to -$53 million, reflecting stronger cost control. Revenue totaled approximately $0.4 million, mainly fro

SPCE Virgin Galactic Holdings Options Ahead of EarningsIf you haven`t sold SPCE before the share dilution:
Now analyzing the options chain and the chart patterns of SPCE Virgin Galactic Holdings prior to the earnings report this week,
I would consider purchasing the 3.50usd strike price Puts with
an expiration date of 2025-11-14,
for a premium of appr
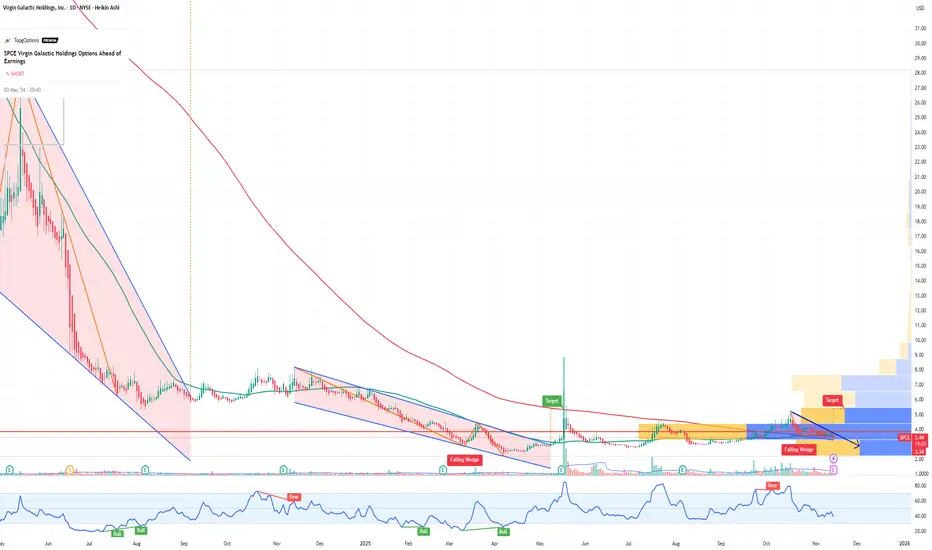
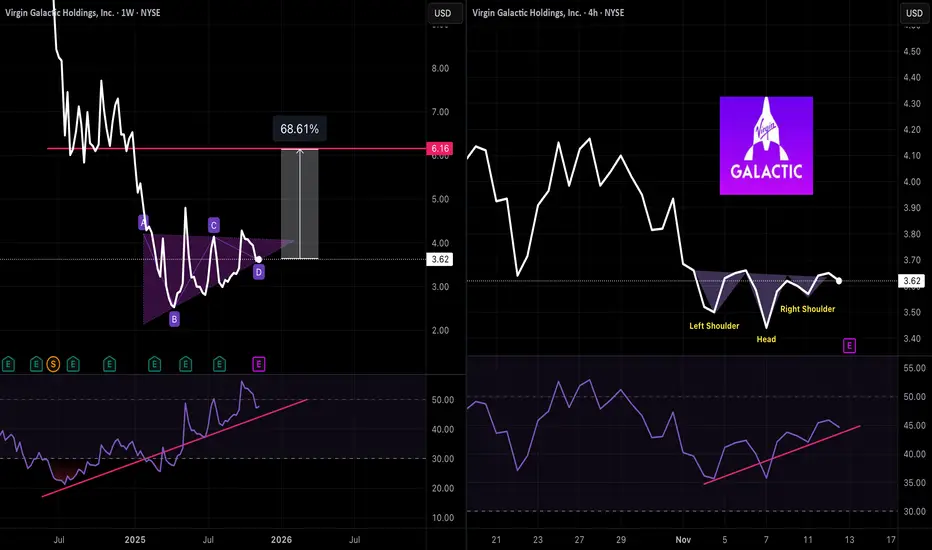
Is Virgin Galactic ready for liftoff?Virgin Galactic NYSE:SPCE has been building an ascending triangle on the weekly chart with a huge gap to fill if it can break to the upside.
Zooming in on a short term 4H chart we see an inverted head & shoulders with improving momentum.
Could one more earnings beat be the catalyst to start the
$SPCE - Punch it Chewie -VIRGIN GALACTIC IN SPACE 2026Another NYSE:SPCE update, just really like what the charts are showing. This stock has been in a long downtrend for quite some time and we're finally beginning to see some candles breaking resistance.
The MACD is flattening out and a bullish crossover may be forming. Again we should always wait
$SPCE - Virgin Galactic - Value Hail Mary?Fundamental Play:
Current Price of NYSE:SPCE is at $2.77 with 35.53million shares outstanding giving it a current valuation of just around $98,500,000.
SPCE has over $600 million in cash Reserves as of December 2024.
Cash Value vs. Market Cap
Cash and equivalents: ~$657 million
Current marke

short term bullish tradewatch out for this lift off. Looks like SPCE might go up to around $4.90 - $5 range in the next few days.
I locked in a few calls with next year expiration date. Just for a small profit.
trade at your own risk =]

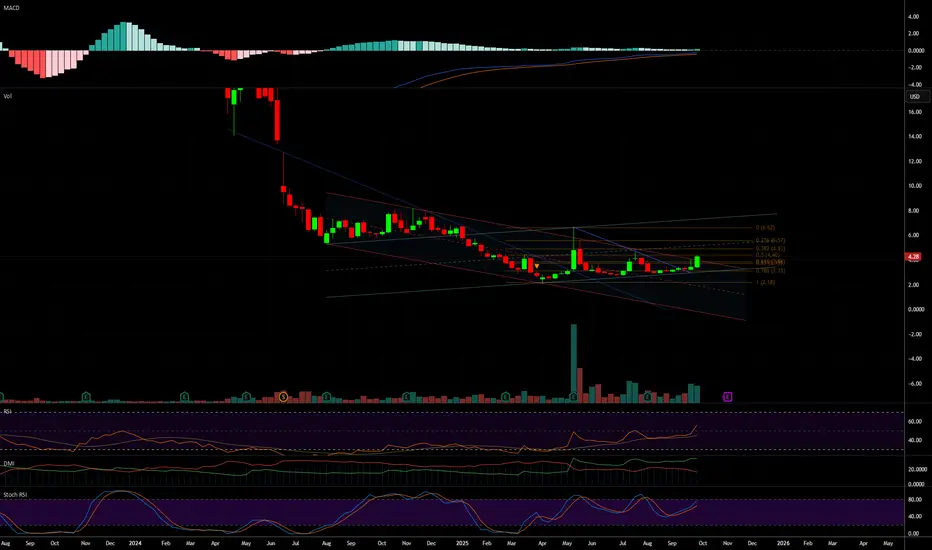
PERSONAL JOURNAL #11 | VIRGIN GALACTIC [SPCE] | AUG 2025-2028Disclaimer
This is a personal journal of my exploits. This is not financial advice. Always do your own research.
Insight
After a major sell off we finally see the price consolidating in a symmetric triangle, all we know for certain is that in 90-180 days we will see volatility and a breakout, eith

Virgin Galactic to MarsMy predictions are often times too far out for most people to see and 9 times out of 10 I give a minimum prediction. Well, this time my prediction will go a bit further. I predict Virgin Galactic to $4000. Stay tuned!


See all ideas
An aggregate view of professional's ratings.
Neutral
SellBuy
Strong sellStrong buy
Strong sellSellNeutralBuyStrong buy
Neutral
SellBuy
Strong sellStrong buy
Strong sellSellNeutralBuyStrong buy
Neutral
SellBuy
Strong sellStrong buy
Strong sellSellNeutralBuyStrong buy
Displays a symbol's price movements over previous years to identify recurring trends.
US92766KAA4
Virgin Galactic Holdings, Inc. 2.5% 01-FEB-2027Yield to maturity
—
Maturity date
Feb 1, 2027
See all 0QL0 bonds
Curated watchlists where 0QL0 is featured.


Frequently Asked Questions
Depending on the exchange, the stock ticker may vary. For instance, on SWB exchange Virgin Galactic Holdings Inc stocks are traded under the ticker 0QL0.
We've gathered analysts' opinions on Virgin Galactic Holdings Inc future price: according to them, 0QL0 price has a max estimate of 6.89 EUR and a min estimate of 1.72 EUR. Watch 0QL0 chart and read a more detailed Virgin Galactic Holdings Inc stock forecast: see what analysts think of Virgin Galactic Holdings Inc and suggest that you do with its stocks.
0QL0 reached its all-time high on Jun 20, 2024 with the price of 9.3920 EUR, and its all-time low was 2.0745 EUR and was reached on Apr 9, 2025. View more price dynamics on 0QL0 chart.
See other stocks reaching their highest and lowest prices.
See other stocks reaching their highest and lowest prices.
Yes, you can track Virgin Galactic Holdings Inc financials in yearly and quarterly reports right on TradingView.
Virgin Galactic Holdings Inc is going to release the next earnings report on Mar 3, 2026. Keep track of upcoming events with our Earnings Calendar.
0QL0 earnings for the last quarter are −0.93 EUR per share, whereas the estimation was −1.22 EUR resulting in a 23.91% surprise. The estimated earnings for the next quarter are −0.96 EUR per share. See more details about Virgin Galactic Holdings Inc earnings.
Virgin Galactic Holdings Inc revenue for the last quarter amounts to 311.05 K EUR, despite the estimated figure of 289.14 K EUR. In the next quarter, revenue is expected to reach 354.29 K EUR.
0QL0 net income for the last quarter is −54.90 M EUR, while the quarter before that showed −57.11 M EUR of net income which accounts for 3.88% change. Track more Virgin Galactic Holdings Inc financial stats to get the full picture.
No, 0QL0 doesn't pay any dividends to its shareholders. But don't worry, we've prepared a list of high-dividend stocks for you.
As of Dec 5, 2025, the company has 744 employees. See our rating of the largest employees — is Virgin Galactic Holdings Inc on this list?
EBITDA measures a company's operating performance, its growth signifies an improvement in the efficiency of a company. Virgin Galactic Holdings Inc EBITDA is −244.94 M EUR, and current EBITDA margin is −5.13 K%. See more stats in Virgin Galactic Holdings Inc financial statements.
Like other stocks, 0QL0 shares are traded on stock exchanges, e.g. Nasdaq, Nyse, Euronext, and the easiest way to buy them is through an online stock broker. To do this, you need to open an account and follow a broker's procedures, then start trading. You can trade Virgin Galactic Holdings Inc stock right from TradingView charts — choose your broker and connect to your account.