ITT Public Offering Priced at $167, Shares Pull Back to Support ITT Inc. (NYSE: NYSE:ITT ) has priced its newly announced public offering of 7 million shares at $167 each, with underwriters receiving a 30-day option to purchase an additional 1.05 million shares. The company expects $1.14 billion in net proceeds, which will primarily fund its planned $4.775B acquisition of SPX Flow, the largest deal in its history. If the SPX Flow transaction does not close, ITT will redirect excess capital toward general corporate purposes.
The offering follows a strong year for the company, with shares up nearly 20% YTD and financial metrics showing a resilient foundation. InvestingPro data highlights ITT’s solid liquidity, with liquid assets exceeding short-term obligations and a manageable debt profile. Analyst sentiment remains favorable: DA Davidson, KeyBanc, and Stifel all maintain Buy or Overweight ratings, with targets ranging from $215 to $225, underscoring expectations that the SPX Flow acquisition will expand ITT’s footprint in high-value engineered components and process solutions across the nutrition and health sectors.
Additional filings tied to the acquisition, including updated financial statements for LSF11 Redwood TopCo LLC, signal ITT’s continued commitment to regulatory transparency as it navigates closing requirements.
Technical Analysis
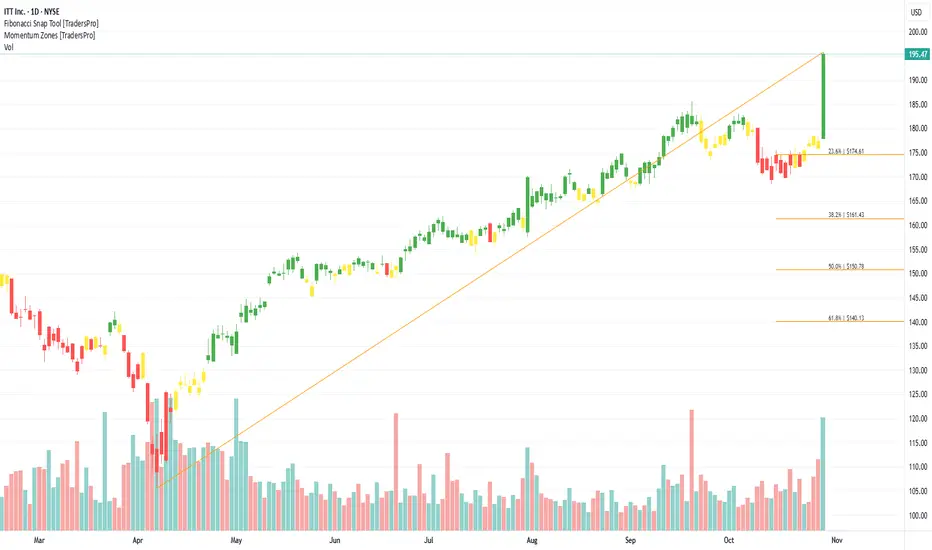
The chart shows ITT breaking below the steep ascending trendline after reaching highs near $197, followed by a strong corrective move. Price has now returned toward a major demand zone between $165–170, which previously acted as a breakout area. This region aligns with the offering price, creating a confluence of support.
Volume expanded during the sell-off, indicating institutional participation, while RSI continues drifting toward neutral levels—suggesting cooling momentum but not oversold conditions. If bulls defend the $165–170 zone, a rebound toward the $182 minor resistance is likely, with a broader upside target back toward $197. A breakdown below $165 would expose deeper support near $160.
ITT, Inc.
No trades
What traders are saying

ITT Inc. (ITT) Grows With Smart Engineering SolutionsITT Inc. (ITT) is a diversified manufacturer of highly engineered components and customized technology solutions serving industries like transportation, energy, and industrial processing. Its products include pumps, valves, and motion technologies that improve performance and reliability in critical systems. ITT’s growth is fueled by global infrastructure investment, demand for energy efficiency, and its innovation in smart industrial technologies that drive productivity worldwide.
On the chart, a confirmation bar with rising volume highlights bullish strength. The price has entered the momentum zone after climbing above the .236 Fibonacci level. A trailing stop can be set just below this Fibonacci line using the Fibonacci snap tool, helping traders secure profits while leaving room for continued upside potential.

ITT INC Course DailyHey people, ITT INC is in a bullish combination with a return of buying volume traded in a hammer candle. By zooming in on the TIMEFRAME M1 we can notice a dash with a low volume of purchase traded it goes towards the top of the range (rectangle) for a retest. It is very plausible to breakout the price with the momentum and then at the same time the zone to access another and get on the coming high. With a new check of the bollinger high counting a test the bullish channel to rebound on its support to cash the execution in order to retest the second resistance of the bullish channel.
Please LIKE & FOLLOW, thank you!

$ITT 5 Month #CupandHandle #ChartPattern SetupNYSE:ITT is forming a cup and handle chart pattern with a well defined resistance area around $65. That price level has been tested over 6 times including in today's session. A daily close above that resistance chart pattern boundary will trigger a long swing trade.
Chart pattern price target is around $77 but profits (or partial profits) should be taken around $75 which is the stock previous ATH.

$ITT Forming 3+ Month #AscendingTriangle #ChartPatternStrong daily bar close above $65 will confirm the pattern breakout. Logical price target is around previous all time highs of $75.

ITT inc PRICE TARGET 20% HIGHER AVERAGE ANALYSTS PRICE TARGET $68
AVERAGE ANALYSTS RECOMMENDATION OVERWEIGHT
P/R RATIO 18
SHORT INTEREST 3%


ITT potential bullish turning point off structure support Key points;
1) Price is currently at validated structure support (old resistance)
2) Price is at a potential up-trending support level
3) Last low was higher than the previous low even on a down market day
4) MACD level is at a similar level to previous lows made in price (illustrated by the vertical blue lines)
5) Price has also bounced off its lower bollinger band
As always DYOR

ITTWell, we have a bearish divergence in the RSI. But we managed to retrace ito the pitchfork. So I suppose that we can test at least the falling trendline again if not even the rising green fork line.
