Fsly ready for next leg upConsolidated here after massive 10% 1day run and gave the indicators time to cool off.
I think with some momentum from tech it could finally push over 50$ and hold
long over 50.35
Trade ideas

Lotto PlayLast few FSLY Earnings have been a disaster for the stock price, lets see what Nov 3 brings this time. From the chart looks like its poised to go up (~60 ), so i picked up some lotto's on it. Hopefully they do a better news this time.

FSLY - D :: Forget about the TikTok dramaThe bears argue that Fastly is suffering the loss of its largest customer, as regulatory restrictions still cloud the company's relationship with Chinese-owned social media giant TikTok. That's unfortunate but hardly the end of the world. At the start of the coronavirus pandemic, TikTok's content delivery orders accounted for more than 10% of Fastly's quarterly revenue. Yes, that's a large customer, but Fastly doesn't live and die by that contract alone. The company can now redirect the networking assets that used to be earmarked for TikTok's use into other customer relationships.
So Fastly deserved a slap on the wrist when government orders separated the company from TikTok. Instead, Fastly shares got a massive haircut.
The business is still in great shape, just so you know. Sales rose 14% year over year in August's second-quarter report. Fastly's customer count rose from 2,458 to 2,581. The net retention rate across the last four quarters was 135%, which means that the average contract renewal was signed at a 35% higher top-line value than the deal it replaced.
Fastly is doing just fine and should get back on its feet in a hurry as investors start to forget about the fading TikTok drama. In the meantime, you can pick up Fastly stock on the cheap.

$FSLY Should be on your list this week Fastly (weekly) so far has recaptured 21EMA and right at the volume shelf resistance coming off a triple bottom.
If it breaks higher, good volume pocket above ... Plus keep in mind only 116M shares outstanding so good squeeze potential for a mid cap.
Just look at the run back in June... not saying that will happen again, but with a good ER and the setup, I think this COULD see $68 quick and should be on your watchlist.

$FSLY first target hit...last week $48 calls bought at $0.26, now $1.71, wish I bought more! Close those out, looking out for a spread position for the next target price around $60

FSLY Major Trendline ResistanceNYSE:FSLY is currently sitting on support with a major trendline resistance which is dictating the medium-term downtrend.
If the $35 level is broken to the downside then the stock can see a big decline in price.
On the other hand, if the trendline can be broken then a potential uptrend may be on its way.

FSLY last hurdle to cross45.50.. would push it across.
Got rejected today after a nice move up.
Has been riding under this divergence since last summer
All other daily indicators are bullish.
let's see what happens

Fsly breakoutFsly breaking out of a long downtrend that started with that possible tik tok ban fiasco.
First TP - 47$/ Daily 100ma
Second Tp - 51$
FInal TP - 76.30$

$FSLY example trade...Got the first move I was looking for, did not enter in time to get the first move. If we continue, would look to get over $45 before end of the week. Going to try a $48 call for next week at close probably around $0.26

$FSLY really liking this set up....Long term VWAP right here, looking for set ups that could go even with a market decline. Going to take a try here on a call option a few weeks out

$FSLY new one on watch...VWAP back to May 2020 acting as a solid base, starting to watch here for a long term play to the upside.

FSLY Parabolic breakdownFSY continues on its parabolic decline. This system which should take FSLY to its near term target of $37.00 is part of a larger parabolic decline that will unfold over the coming weeks. Opportunities to the long side will present themselves as the near term parabolic systems are completed.

FSLY - LONGInitiating a 1/5th position here for shares and long term 01/19/2024 $40C options
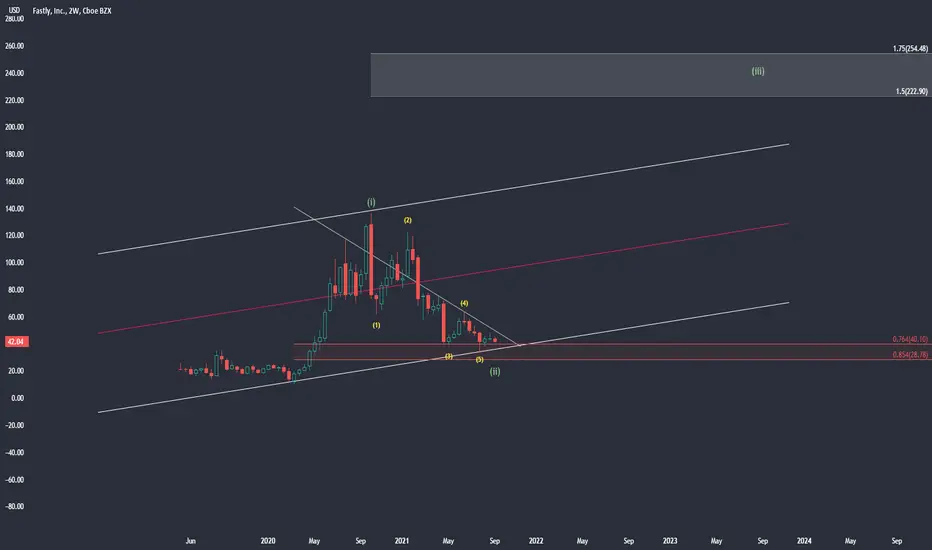
Weekly chart should be at or close to near term bottom for a major wave 3 towards upper white box.
FSLY breaking from baseFSLY making a move through the downward trend line after being in the dog house for a while. Like it above the green box. Would prefer a pull back to the the trend line for and entry. It may a run as it has 20% short float. Targets would be the fibs.

FSLY zoomed in. Wait for $40 to buy. And buy big. Wave 3 of 3 coming. This stock is in a larger wave 2 and you can call that the institutional due diligence phase. Same story as NVDA, TWLO

FSLY preferred countThe bottom is in according to this count. We are in the large wave 3. I'd be a heavy buyer at the .618 for the smaller degree wave 2 pullback

Fastly - investment ideaFor a long-term investment this stocks looks absolutely fine at current prices.
If we zoom in to look at the wave structure - right-side chart H4 - I would expect a lower low to complete an ending diagonal in the wave C.

Potential FSLY count - not preferredAs with many long term stocks they have the massive wave 1 before a significant and deep wave 2. Call this an institutional due diligence phase. That's where I believe FSLY is at. It's scary right now, but this could be an NVDA or TWLO type name.
This is not my preferred count. I prefer the wave 1 top in October which is the all-time high. If this count is wrong then the bottom very well could be in.
For trade ideas, portfolio building and stock picks go to Thesmartcents . com to join our group.

Falling Wedge- BullishBig falling wedge on FSLY that it has been holding for quite some time now, however, is seemingly starting to break out of this formation- Bullish and will be looking for a breakout, just some FIB levels & RSI-based supply and demand zones to keep an eye on-
- Closed Friday sitting right on its 20-day SMA (Not Pictured)
- Bollinger Bands Squeezing
- RSI has been in the oversold range for quite some time
- Buyer volume starting to pick up
- Weekly Timeframe (See Below)
PT1- $44.35
PT2- $45.58
PT3- $46.30+


FASTLY SHORTWith consecutive LL HL potential target for toward define with help of ABCD pattern chart for EDUCATIONAL purpose .

FSLYSmall caps look weak, and when in doubt short garbage
I think this one needs to head back to where earnings took it. Double bottom.
Other garbage stocks look weak, like BYND and FCEL
