$FSLY Bullish ReversalTechnology / Software Co. Fastly ( $FSLY ) has setup nicely to continue with its bullish trend.
Looking at weekly chart its found some solid buying interest at previous highs ( 35.25 ) set all the way back in Sept. 19'
First target / resistance lines up with its 50% retrace of its last move lower around 49.00
If we can see a break and hold above its halfway back setup and weekly trend line, $FSLY looks for a nice swing towards second target at 72.55
Long term I'm looking to play retest / potential break above ATH
- Krecioch
Trade ideas

FSLY Fastly Head and Shoulders Price TargetThe head and shoulders pattern is one of the most reliable trend reversal patterns.
The distance from the neckline to the head is the same for the retracement from the neckline to the bottom.
In this case, using Renko candles to understand better the H&S chart pattern, the price target is 31usd.

Falling Wedge- Watching CloselyFSLY has been selling off for quite a bit now, however, is forming quite a large falling wedge. Some slight bullish divergence on the RSI last week, Bollinger bands are squeezing (not pictured). With buyer volume, should pop and will be looking for a breakout- just some support and resistance levels to keep an eye on as well as some RSI-based supply and demand zones.
**Broader Market Conditions Permitting**

FSLY Zone for LeapsGreat positioning in daily channel. I will begin accumulating 2023 leap contracts in this area looking for a rise back to upper channel boundaries.


Fastly FSLY is bottoming outFastly stock FSLY is bottoming out forming a potential higher low.
The stock could target $53.94 - $57.45 - $60.65 levels consecutively.


FSLY: Ichimoku bullish set up with all levelsFSLY Ichimoku analysis and all supports and resistance
Ichimoku : Price above the cloud, lagging span broke kinjun and tenkan = bullish on daily, long trend.
Mind the 1st resistance and enter accordingly.
All levels are on the chart (support and resistances).
I'm long. Swing trade with option expiring in January 2022.
Trade safe.

FSLY ShortIn Supply Zone (Drop based drop)
Bearish tweezers
Short 60.3
Stop 63
Target 40
Risk management is much more important than a good entry point.
The max Risk of each plan should be less than 1% of an account.
I am not a PRO trader. I trade option to test my trading plan with small cost.
I created some tradingview scripts to improve my trading entries:
OBV and OBV SMA comparison;
Williams %R two lines;

FSLYHead & shoulders broke down and price is back at the neckline/20 sma. Very bullish above $65. Very bearish below $62.

$FSLY Long CallsFSLY in history always does dumb ass-ending channel upwards followed with massive market moves. I'm going to go ahead and pick up $70c for 8/20.
Not financial advice. Do whatever you want. Also give me feedback!


FSLY Watching 60.FSLY working on a break of 60. Could yield a move to 70 and maybe 80. Risk below box. Need to be careful with entering new position right now as the NAS 100 is at resistance.

FSLY - 1h Frame Symmetrical TriangleSymmetrical Triangle - Possible Bullish Pattern
This can run up to highs of 59.12+
Short Term Scalp Calls (Options for best gains) Would be amazing.

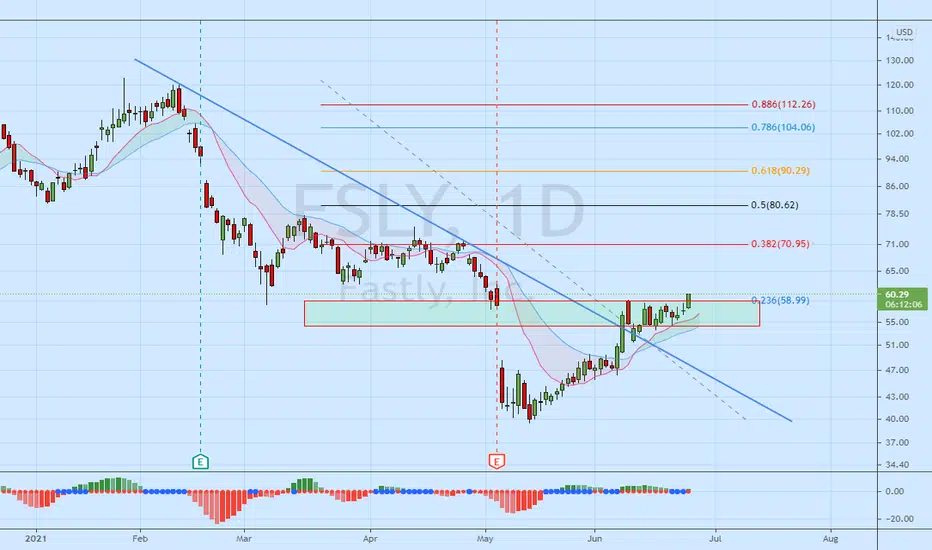
$FSLY has been a great swing trade so farNYSE:FSLY closed the gap and could continue to be a great swing trade if it can break the 58 resistance which it has tested several times in the past week.
Indicators (MACD, RSI, OBV) look very constructive for the next level up.

Coming back to lifeWill be a good buy at $50 or below once it retraces for Wave 2. There is a potential to go back up to $100.

$FSLYgetting a bit of a beak (bull pennant) setting up on the daily and the strat method is looking good. I am long commons on this, sold ½ already for 30%. Holding ½ for potential break out
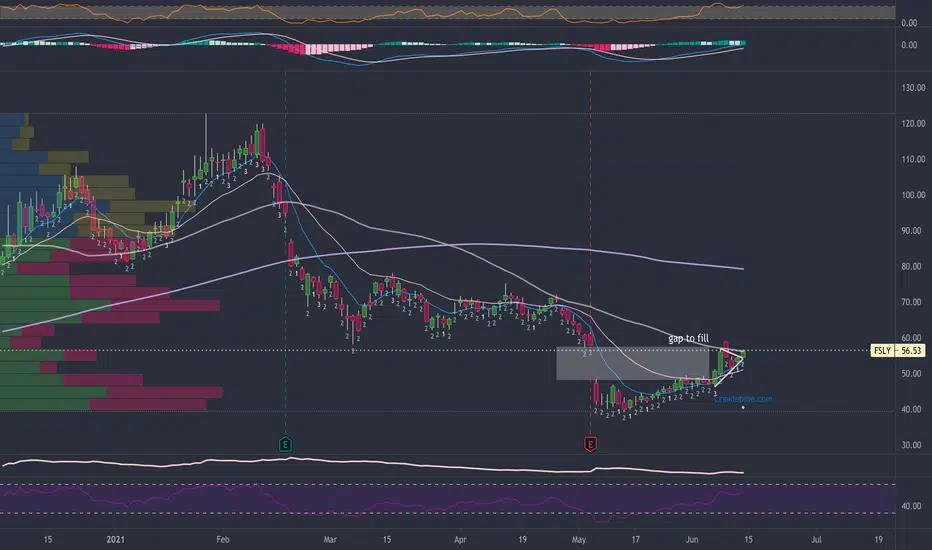
FSLY Gap Fill ReversalFSLY has filled its gap in its chart up to the 57.5 area. It has now also run into 50sma resistance. Now that the gap has been filled, i suspect this will pull back to the 50 range before it will continue its run. A break above 61 would trigger an exit.

FSLY to $60 SOON....and $100 in a year$FSLY Good breakout and ready for that gap fill to $58 and eyeing for $60 mark Great longterm stock. IT can double from here in next couple of years

FSLY about to explode and fill gap. Above avg volume trend. Tapped down trend line this morning and quickly reversed above previous 5 day highs. Price Tgt 60.


