$ETSY - playing retail e-commerce$ETSY is an e-commerce website for handmade goods.
I'd say in a soundbite that $$FB is $PINS what $AMZN is to $ETSY.
The stock was breaking out in August, and retraced to a strong support at 100-105 during the September selloff in a bear flag .
The stock has resumed its march upwards and was up 8% in a very good day for Internet retail stocks.
$130-135-140 are all resistances, but momentum is strong with this one.
3E2 trade ideas


ETSY LONG A strong company with good revenue streams and this is a company primed for growth. It broke the downtrend line but to enter would still like some stronger volume towards the close.
*NOT INVESTEMENT ADVICE*

ETSY Round UpETSY is showing a rounding formation upward to the 130-133 area. It has its moving averages converging nicely which will act as support. A break below the moving averages or outside of the rounding pattern would mean an exit will need to be taken.


$ETSY Possible Long entry above $120
Alert set for Break above the 50ma, with the
local downtrend as resistance..
Volume on Friday was poor despite the 4% gain.
Take note of volume resistance gap on the Fixed range.
Indicators are in Bullish uptrends.
A Break above $120 could see a nice rally to $128


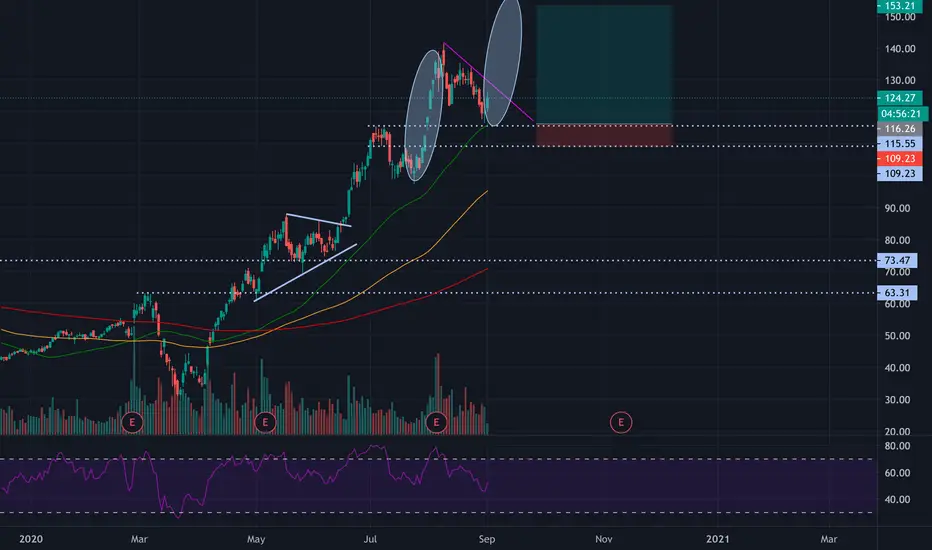
$ETSY - New Wave Cycle This is a great opportunity. $ETSY looked like a buy this morning and it raged! I was so happy. My account so happy. But when I zoomed out I noticed something troubling... We just completed a bull cycle and now commenced a bear cycle. I happened to time corrective minuette wave b at the perfect time. The good news is that I now know to sell, by puts targeting $80 range for primary wave 3. Target should be met by early next week (9.30.20).
I will do my best to post updates but think about loading up on puts and confirmation is below $106.
Good luck.


$ETSY - daily consolidation I have profiled hundreds of stocks for daily consolidation trends
14-21 days after a daily consolidation the stock rises by a meaningful amount.
This has shown to be a good trend 95% of the time

$ETSY On Watchlist
Strong reversal on Friday on high volume , lets see today id the Covid stocks will regain market dominance again.
Potential long if lows are tested and holds.

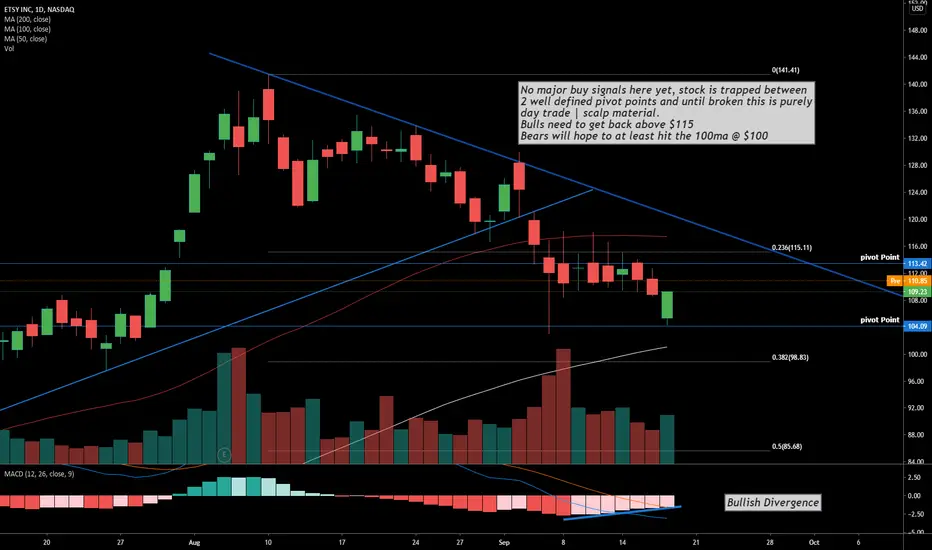
$ETSY Chart Analysis, Possible Day trade
No major buy signals here yet, stock is trapped between
2 well defined pivot points and until broken this is purely
day trade | scalp material.
Bulls need to get back above $115
Bears will hope to at least hit the 100ma @ $100

Oversold, signaling reversal with upcoming catalystOn Aug 28th this signaled a reversal demonstrating a similar pattern, oversold after two red days with a long-legged Doji candle, indicating this pattern may result in upside again. Support below can be used as entry upon re-test, short-term resistance above can be used for profit targets upon rejection. Fibs drawn are a retracement of the recent move high to low. Above the 0.5 fib is particularly bullish with targets above. Note the upcoming catalyst, inclusion on the S&P 500 slated for 9/21.

ETSY Buy at $117.10 and sell at 2% close of 10WMAEtsy will be added to the S&P500 on September 21st. This puts more eyes on ETSY, a website where mom and pop can sell goods online. History tells us that stocks tend to fall after they are added to the index for the first few days but tend to be up for the next few days after the announcement. As you see on the weekly chart it is a sell signal but there is a caveat there could be a high volume breakout through the 10WMA moving average and keep going past the $129.94 high next week would make this stock a buy. Looking at the after hours it has already gapped up past the 10WMA and might be on the way to past $129.94. Once it gets past I would like to see no more pull back to the 10WMA. Sideways/Up action would be find as long as it is away from the 10WMA. If it hit and closes 2% below the 10WMA then it is time to see. We shall see though. Becareful of the overall market there are signs of weakness. Fundamentals look great as shown below:
Quarterly Sales
DEC-19: -22%
MAR-20: -58%
JUN-20: 436%
Yearly EPS
2018: .61
2019: .76
2020: 1.93
2021: 2.18
Management 4% ownership


ETSY$ETSY Gave us two nice Breakout Trade Set ups last two callouts with great gains.
Like this potential set up as price traded off the 89 EMA with momentum
on friday as well as out of a zone. $ETSY also got added to the S&P 500 Friday.


$ETSY Inc Potential Targets
Inclusion into the SP500 could lead to a nice rally on Tuesday. The stock moved 5% after-hours.
Levels to consider as resistance.
$117.00 50MA
$117.76 Fib .382 dead cat bounce level.
$122.30 Previous Rising uptrend (blue) & previous pivot point.
Market stability is needed for any sustained rally higher.
PLEASE GIVE US A LIKE IF YOU FIND OUR CONTENT HELPFUL, THANK YOU.
