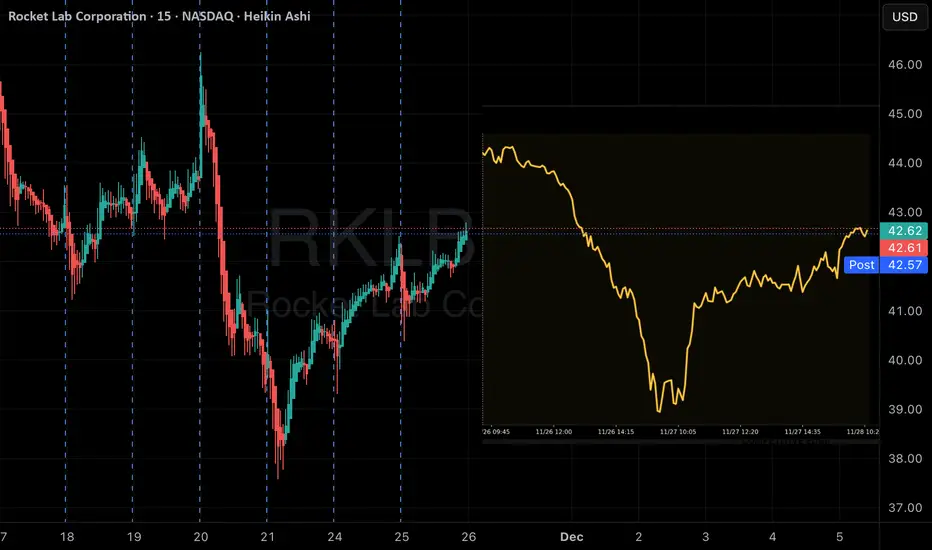
Fasten your seatbelts, we're about to take off!Rocket Lab (RKLB) is approaching a decisive technical inflection point after several weeks of heavy correction. The structure is shifting: compression, potential breakout, and early momentum recovery. Everything is lining up for a strong directional move.
Overall Structure
Price is attempting to break out of the descending H1 channel that has guided the entire decline from the 73–74 highs.
The 37.50 zone acted as a major floor: previous liquidity block + value-area low + FVG fill. The rebound that followed shows clear buyer defense.
Current Zone: 42.50 – 45.00
This is a rare confluence area:
EMA45
MA25/200 cluster
Retest of the former channel boundary
Key horizontal resistance
This zone is the switch.
Above it = takeoff.
Below it = turbulence.
Possible Scenarios
Bullish:
If RKLB closes an H1 candle above 45.00, the reversal becomes technically validated. Targets are straightforward:
53.80 (major pivot + prior distribution zone)
60.70 (extension of the breakout structure)
This represents a +20% to +40% upside if confirmation holds.
Bearish:
Rejection below 42.50 would send the price back toward 41.70, then possibly a full retest of 37.50 if momentum fades.
Momentum Check
RSI reclaimed the 50 line and is stabilizing above it — constructive, but still fragile.
MACD crossed bullish, though without real histogram expansion yet — early signal, not confirmed.
In summary: RKLB is entering a critical decision zone. The 45.00 level is the firewall. A clean breakout unlocks a high-velocity bullish corridor. A rejection keeps price trapped in the lower range.
Fasten your seatbelts,
The next move could be explosive.
Trade ideas

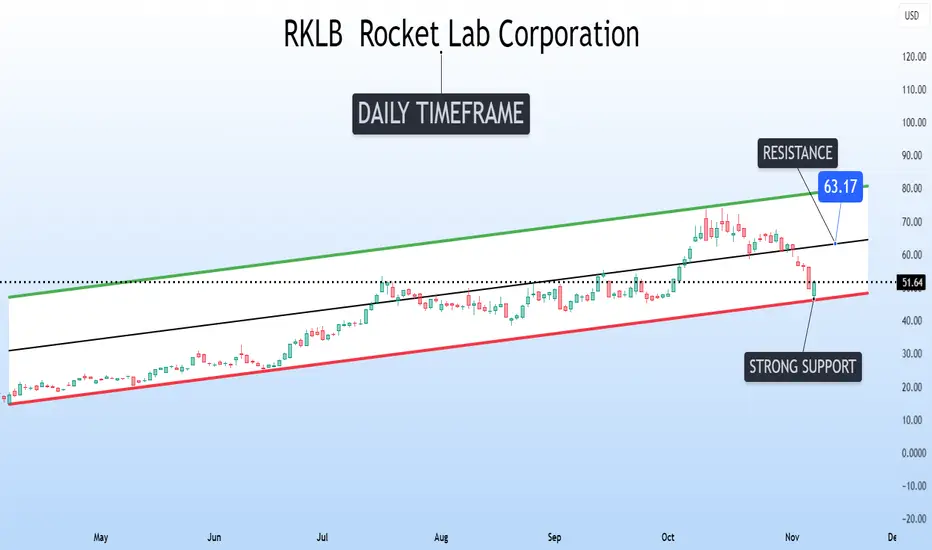
It's a time for RKLB - 45% potential profit - 62 USDThe chart shows Rocket Lab Corporation on the daily timeframe. After a strong bullish trend, the price entered a deep correction phase, dropping into the 41–42 USD area. Currently, the decline appears to be losing momentum, and price action shows signs of stabilizing around a key support zone. This area has previously acted as a demand zone, which increases the likelihood of a short-term bounce.
The price is currently positioned below two moving averages, but it has started to approach them from underneath. This may indicate a potential short-term trend reversal if the price breaks above the first moving average and holds above it. Such behavior often signals the beginning of a corrective or reversal move to the upside.
The RSI indicator is in low territory, suggesting that the stock is near oversold conditions. Historically, this often results in a technical rebound as selling pressure weakens and buyers re-enter at discounted levels. Moreover, recent candlestick structure indicates decreasing selling pressure and early signs of demand returning to the market.
The highlighted price projection toward the 62 USD level reflects a potential corrective move back into a previous resistance zone, which also aligns with a psychological price level. From a technical perspective, this area represents a logical first upside target following such a strong downward move. If buying momentum continues and price breaks through local resistance levels, a move toward the 60–62 USD region in the near term is a realistic scenario.
Overall, the technical picture suggests that the stock may be entering an early recovery phase after a strong decline, with growing probability of a short-term upward movement. The coming sessions will be critical — a breakout accompanied by increased volume would strengthen the case for a move toward the 62 USD level.
Potential TP: 62 $
⚠️ Disclaimer
This analysis is for educational and informational purposes only and does not constitute financial or investment advice. The financial markets involve risk, and past performance is not indicative of future results. Always conduct your own research or consult with a licensed financial advisor before making any investment decisions.

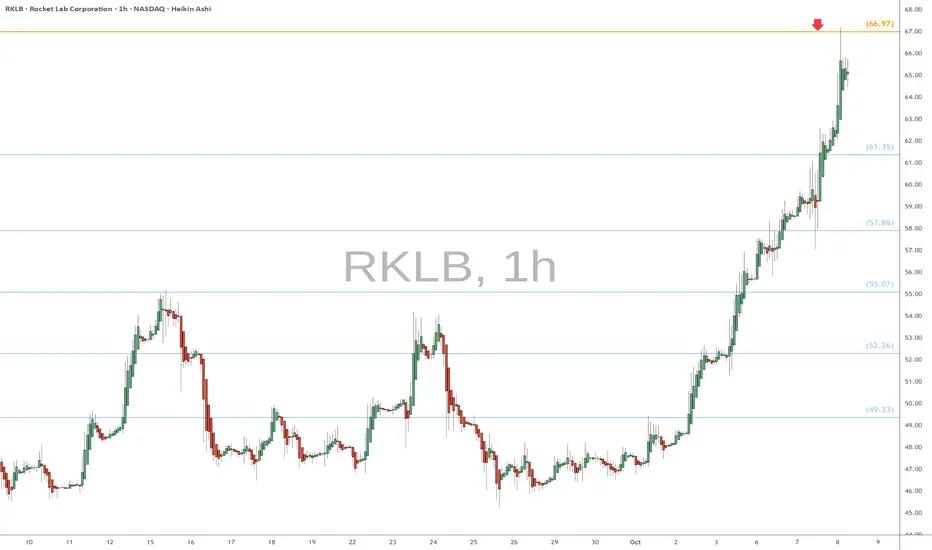
RKLB eyes on $66.97: Golden Genesis fib could make for a TOP RKLB rocketing (lol) from the last Golden Genesis break.
Now approaching the next Golden Genesis fib at $66.97
Look for a Dip-to-Fib or Break-n-Retest for next move.
.
Previous heads-up at last Golden Genesis:
Hit BOOST and FOLLOW for more such PRECISE and TIMELY charts.
========================================================
.
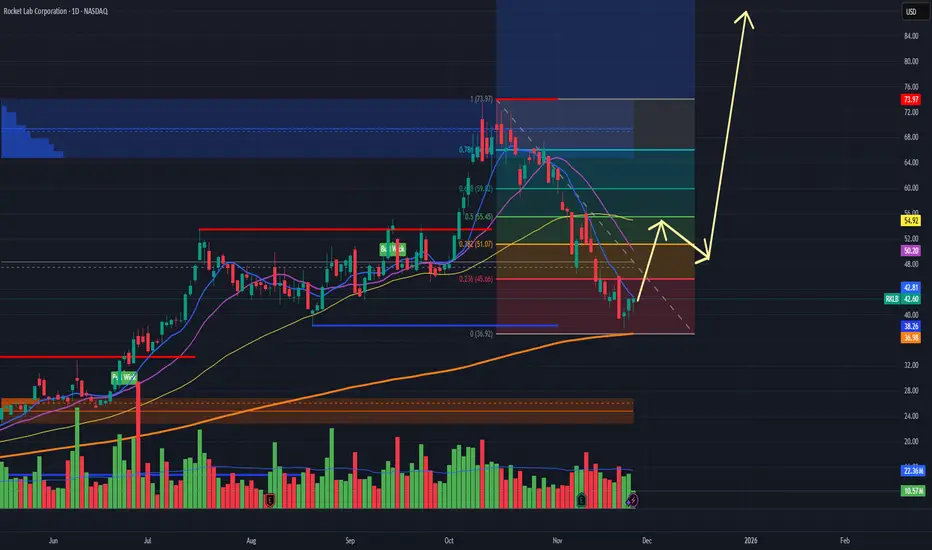
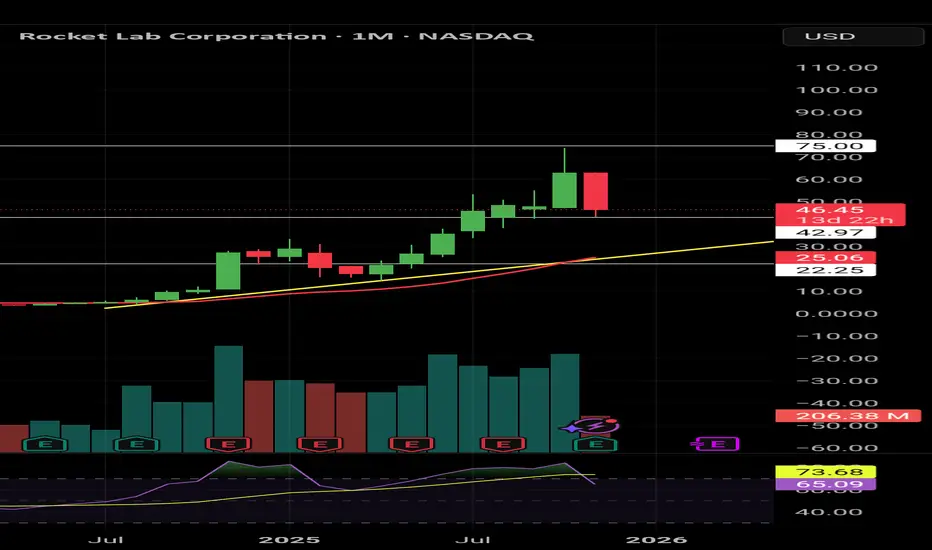
Rocket Lab to 80$Rocket Lab
NASDAQ:RKLB is showing a high-probability setup for a major run, supported by a bullish technical structure and strong underlying fundamentals.
Technical Perspective
The daily chart reveals Rocket Lab has bounced off its recent lows near $36.90 on 200SMA, forming a potential bottom with climbing volume. Fibonacci retracement levels show key resistance around $51 and $54, and a breakout above these puts the $73 and $83 zones firmly in play. Price action is now holding above the rising 200-day moving average—often viewed as a strong support line—and the yellow arrows forecast a classic “ABC” recovery pattern targeting prior highs and new expansion zones.
Momentum and volume profiles back this thesis: the last few green bars suggest accumulation is underway, and the blue buy zone near $42.60 offers a defined risk entry. Such setups feature optimal reward/risk ratios for swing and position traders.
Fundamentals
Rocket Lab recently posted $155 million Q3 revenue, up 48% year-over-year, with improving gross margins and projections for record turnover next quarter. The company sports a healthy contract pipeline (including government/hypersonic deals), rapid satellite deployment, and consistent launch cadence—all signs of operational momentum.
Analysts now see upside targets between $55 and $83, driven by both revenue acceleration and vertical integration. Most importantly, Rocket Lab continues to narrow EBITDA losses, proof that its path to profitability is intact.
Why a Double Is Plausible
Technical setup favors a rally back toward the $80 level if supply at $54 is absorbed.
Growth rates far exceed sector averages; additional launches and government contracts can fuel a re-rating.
Accumulation on the chart supports a near-term reversal and multi-month breakout.
With momentum building and fundamentals supporting a much higher valuation, Rocket Lab is positioned to potentially double from current levels within the next rally cycle.
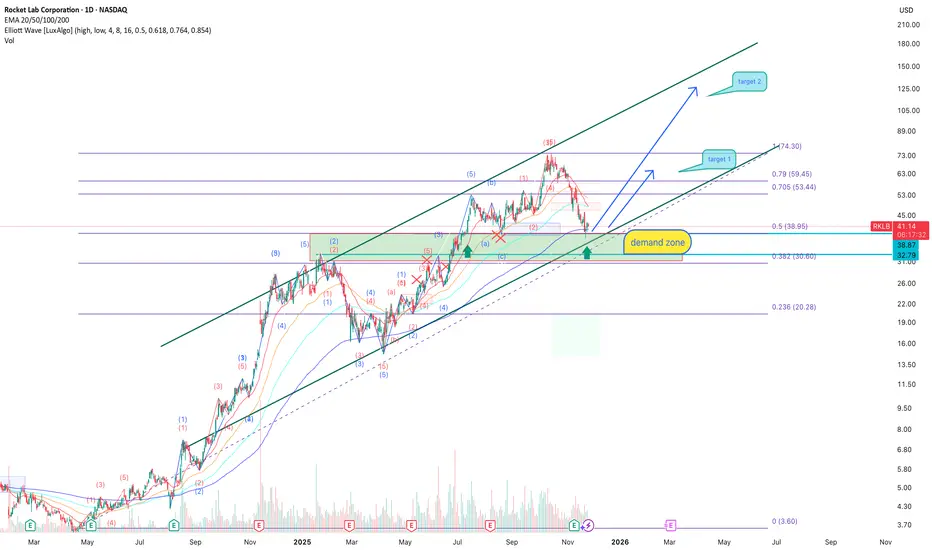
RKLB: demand zone may launch the next rallyRocket Lab remains one of the strongest long-term stories in the small-launch sector. The company continues expanding production capacity, scaling its launch cadence, securing new government contracts, and increasing recurring revenue from satellite services. The global demand for small-satellite deployment is growing faster than supply, and RKLB is steadily becoming the second major player after SpaceX in the commercial-launch and orbital-services niche. Additional growth in spacecraft manufacturing and analytics strengthens the company’s strategic positioning. From a long-term fundamental perspective, the recent price decline looks more like a technical correction inside a broader bullish cycle, rather than a structural reversal. For mid- and long-term investors, this area historically acts as a key accumulation zone -especially when fundamentals align with major technical supports.
Technically, price has held a major demand zone between 38–33 USD - the same zone that previously generated strong upward impulses. The correction stopped right at the 0.5 Fibonacci retracement (38.95), and buyers are showing absorption on lower timeframes. Price remains inside the broader ascending channel, while EMA 20/50 are stabilizing above the demand level, suggesting momentum may soon shift upward again. A clean entry setup forms once the market breaks and confirms the 0.705/0.79 Fibonacci cluster, opening the road toward the first target at 59.45 and then the extended target at 74.30. The bullish scenario remains valid as long as price stays within the demand zone and above the long-term trendline.
Fundamentally, the engine is already running -now all the chart needs is technical ignition to send RKLB back into the upper band of the long-term channel.
QuantSignals V3: RKLB Put Setup ActivatedRKLB QuantSignals V3 Weekly 2025-11-25
Ticker: RKLB
Signal Type: Weekly Short-Term Play
Direction: PUT (SHORT) — Contradicting Weekly Composite Guidance
Confidence: 60% (Moderate)
Current Price: $42.63
Entry: $0.29
Target 1: $0.58
Target 2: $0.87
Stop Loss: $0.15
Expiry: 2025-11-28 (3 days)
Weekly Momentum: BULLISH (+1.22%)
Options Flow: Neutral PCR 0.98, max OTM put volume indicates hedging
🧠 Key Technical & Chart Insights
Stock overextended at 87.3% of weekly range, RSI 90.3
Katy AI predicts sharp short-term decline (-14.73%) to $36.35 over 3 days
Support at $40.00, $39.00, $38.00; Resistance at $43.27
🎯 Trade Rationale
Katy AI’s high-precision 168-point prediction overrides bullish weekly composite score
Short-term reversal opportunity after +10.35% daily gain
Tight stop loss at $0.15 and conservative position size (2%) mitigate directional conflict
⚠️ Key Risks
Contradicts weekly composite bullish guidance (+2.0)
Moderate-high risk due to short 3-day horizon and potential news catalysts
Requires strict monitoring and potential scaling out at Target 1

Last hope I seeA bit of divergence between price action and rsi. Couple weeks left for a turnaround but not looking good.

Rocket Lab Successfully Launches HASTE MissionRocket Lab continues to strengthen its position in the U.S. defense ecosystem with the successful launch of its HASTE suborbital mission. The mission, executed for the Defense Innovation Unit (DIU) and Missile Defense Agency (MDA), highlights Rocket Lab’s growing role in hypersonic technology testing—an area of strategic national importance.
The HASTE rocket, a suborbital variant of Rocket Lab’s Electron launcher, carried multiple government and industry payloads designed to test technologies relevant to missile-defense applications. This flight, conducted from Launch Complex 2 in Wallops Island, Virginia, marks the company’s sixth HASTE mission since 2023. The 14-month turnaround from contract signing to launch showcases Rocket Lab’s ability to deliver rapid, cost-efficient flight testing compared to traditional government programs—an advantage that has become increasingly valuable in the evolving defense landscape.
This mission also reinforces the HyCAT program’s goal of expanding low-cost, high-cadence hypersonic testing. As U.S. agencies push to accelerate development of hypersonic aircraft, re-entry vehicles, and counter-hypersonic systems, commercial partners like Rocket Lab are becoming essential contributors.
Technical Analysis:
RKLB shares have been bullish for most of the year and recently hit an all-time high near $74 before pulling back. The chart shows price tapping a key support zone around the $39 region. Bulls will want to see a clean bounce here, which could send price toward psychological levels at $72, $110, and $120. A failure to hold this zone, however, opens a potential drop toward the deeper support around $31 support area.
Overall, Rocket Lab’s strong fundamental momentum, increased government partnerships, and expanding launch cadence continue to provide long-term upside potential—while near-term volatility will depend on how price reacts to current support.

Looking rough for short term. Massive red candle.If we retest trend line we are looking around $30. If we can get a strong push from a possible year end rally maybe a retest of highs?
Rocketlab Bullish Flag DeviationI will try a long here. Risk 5% of Capital. Low leverage. Wide stop loss below latest low.
IMO: Be deviated just below support line in white and the bullflag. We are now testing the gap up. next days we can see higher price discovery fast. Gov. Shutdown is coming to an end.
Target as shwon in the chart. Aiming here for 120% gain on position size.

Flagging to more upside?Broke out of triangle after earnings push. Would love to see a retest of +/-$60 to close some calls that where bought on last week's dip.

Rocket Lab is bouncing from the bottom of its ascending channelRocket Lab NASDAQ:RKLB is bouncing perfectly from the bottom of its ascending channel on the daily timeframe.
This level has acted as strong support multiple times before, and once again buyers stepped in right where they needed to.
If momentum continues, the next key area to watch is the mid-range resistance near $63.
A solid move toward that level could signal the start of another strong leg for the top of the channel around $80.
Trend reversalThe leading company in the space sector dropped 7% yesterday, but reversed at the lower edge of the indicated channel and closed with a nearly +5% gain.
This could be an interesting opportunity for entry or accumulation.
Always remember to set stop-loss levels due to the high volatility typical of these stocks.

KLOKThe content of today's is provided for educational purposes.
I , YES , I make NO promises or guarantees of earnings.
YO , YES , I'M NOT a broker/dealer, not a Certified Financial Planner
and not a Registered Investment Adviser. GRACIA$:{)
-RKLB-
Short Put
P-47
Exp.--11/14/25
S--44.21
IV4--11/07
OI--OK
Liq.--OK
EarningD.--11/10/26
W.atr--8.68

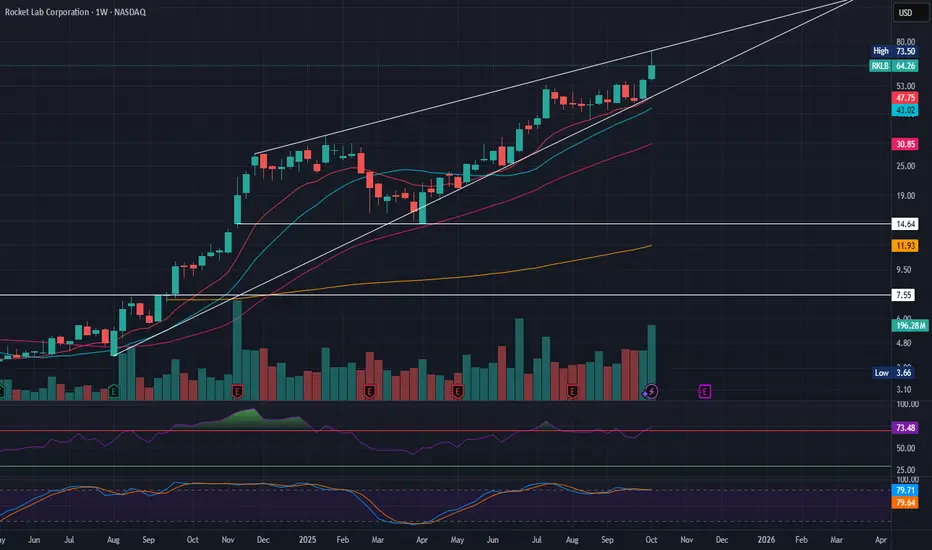
ROCKET LAB has topped. Sell signal on Bearish Divergence.Last time we took a look at Rocket Lab (RKLB) was more than 5 months ago (May 12, see chart below) where we gave a Buy Signal exactly on the 1D MA50 and the price instantly reacted with a rebound, easily hitting our $32.00 Target:
This time we are getting a Sell Signal on the chart as despite the stock's Higher Highs, its 1D RSI has been trading under Higher Lows since July 17, exhibiting a Bearish Divergence. The last similar Bearish Divergence was seen on January 24 2025, which was RKLB's previous Channel Up Top.
That signal triggered a correction that extended all the way back to the 0.382 Fibonacci retracement level and hit the 1D MA200 (orange trend-line) before bottoming. As a result, we are now turning bearish on Rocket Lab, targeting $40.00 (Fib 0.382).
-------------------------------------------------------------------------------
** Please LIKE 👍, FOLLOW ✅, SHARE 🙌 and COMMENT ✍ if you enjoy this idea! Also share your ideas and charts in the comments section below! This is best way to keep it relevant, support us, keep the content here free and allow the idea to reach as many people as possible. **
-------------------------------------------------------------------------------
💸💸💸💸💸💸
👇 👇 👇 👇 👇 👇

5 Truths That Took Me 2 Years to Accept and 5 to UnderstandTrading isn’t something you “get” in a few weeks.
You might catch a lucky streak early on and feel like that Lambo is just a few months away; but that illusion fades fast.
The truth is, trading is a rollercoaster. Especially in the early stages, when emotions, variance, and lack of structure hit all at once.
Even for those few who survive beyond the average life span of a retail trader (which is painfully short), it takes years for the craft to settle into something resembling steady, reliable income.
Over time, traders collect scars and lessons that only experience can teach.
Here are five of the most important ones I’ve learned after more than two decades in this game.
They may sound simple or vague now, but trust me, if you stick around long enough, one day you’ll read them and nod quietly, realizing they’ve all become true.
1️⃣ Technical Analysis isn’t linear, perfect, or enough.
Patterns evolve, markets change, and setups fail.
I’m sure you’ve experienced it, that “perfect trade” that still turned into a loss.
That’s why TA should be treated as a lens, not a compass.
Relying 100% on technical analysis is too basic; if you want to succeed, you need something deeper: context, probability, and process.
2️⃣ I’m never right or wrong.
A loss doesn’t mean you were wrong, it’s just risk doing its job. In technical terms, it’s variance at work.
The only real mistake is confusing randomness with failure.
3️⃣ Consistency always beats prediction.
The future is uncertain.Trying to predict the next tick, the next day, or the next week is futile.
Once you understand that your system lives inside uncertainty, everything changes.
Discipline compounds, prediction doesn’t.
Stop treating trading as a guessing game and start treating it as a process.
4️⃣ Emotions are a sign you’ve misunderstood your system.
If you find yourself reacting to your last win or loss, it’s a sign you don’t truly understand how trading works.
Each trade is just one data point in the variance of your system.
When you start to see it that way, emotions disappear and clarity takes over.
5️⃣ Chasing outsized returns produces outsized losses.
Every shortcut in trading is just a longer route to pain.
Your system has an expected future value: it fluctuates in the short run, but it’s stable in the long term.
When you try to force profits or speed up growth, what you’re really doing is increasing risk to a level that can destroy you.
Remember: it’s not about getting rich fast; it’s about staying solvent long enough for your edge to compound.
🧠 Trading isn’t about being smart, reading charts well, or even being right; it’s about being disciplined, logical, and consistent.
Each of these lessons was learned through years of mistakes, setbacks, and reflection.
They might sound vague, simple, or even wrong today, but trust me, when you reach your tenth year in trading, you’ll see every one of these truths play out in real life.
If you’d like me to expand on any of them, drop a comment below, I’d love to dive deeper.

RKLB Next target is 65.60Rocket Lab showed good strength to end the week last week, finally closing above the recent downtrend line. Next structure target would be 65.60, with partial profits being taken at key fibonacci levels along the way. The thesis changes is we break 34.

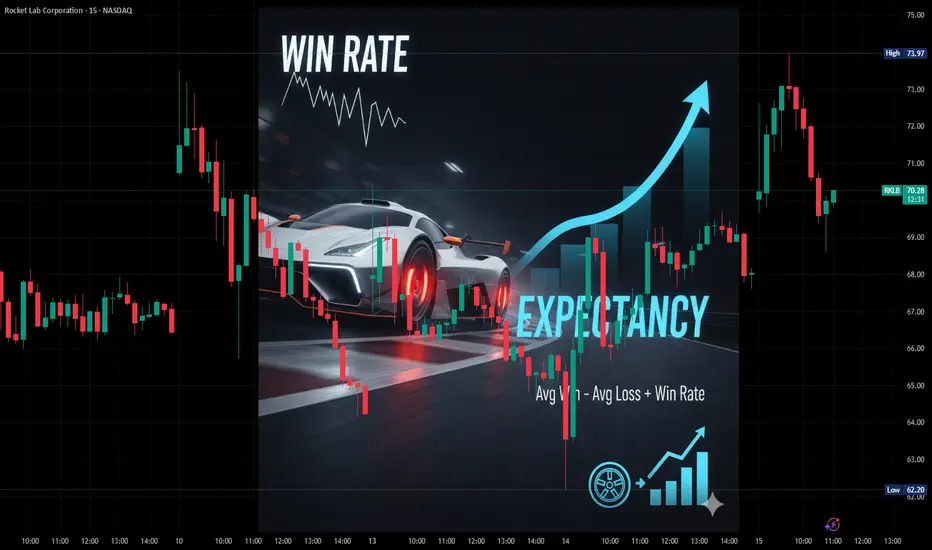
Why Win Rate Lies: The Metric That Keeps Traders BrokeWhy Win Rate Lies (and What to Measure Instead)
Everyone loves a high win rate. Every newbie dreams of having a 75%+ success rate.
But here’s the trap: your win rate only tells you how often you’re right, not how much you make when you are. Even worse, focusing on win rate puts you on the wrong path: trying to predict outcomes instead of focusing on what really matters: being profitable.
Let’s dissect this a bit.
As a quantitative trader, I know I can design hundreds of systems with a 75% win rate. It’s simple: take frequent, small profits and place wide stop losses. Voilà, your win rate looks great on paper.
The problem? Those small wins can’t save you when that one big loss hits. The math doesn’t forgive.
Building a truly profitable system is much harder, because you need to balance the trade-off between win rate and risk/reward. A system that wins often but loses big doesn’t have an edge, it just has good marketing. See the futility in chasing high win rates?
The real path is focusing on expectancy.
Expectancy not only accounts for win rate but also includes your average win and average loss, capturing the critical balance between how often you’re right and how much you gain or lose when you are.
Chasing a high win rate is like designing a race car and spending all your money on the engine. It’ll hit top speed on the straights (your wins), but without investing in decent brakes, you won’t look so great when the first corner arrives.
RKLB to peak $80-90 in Q4'25 or Q1'26. Trim gains. Buy in 2026.All good things must come to an end, and well... I think we're coming to the end here.
There's a lot I could write about how great this company is, but the stock chart says all that needs to be said.
THE UPSIDE
The rising wedge ends in the next quarter or two. I think there's still room for ~some~ upside with the upcoming SDA award Rocket Lab could win. There's also potential for broader NASA / general space news.
THE DOWNSIDE
I do not think that investors understand the company, and they will not like what they see when Neutron launches / gets delayed / has issues (practically inevitable for RKLB). Most revenues come from satellites, so maybe it's a non-issue. However, Neutron could change that math, but that's years away at best.
THE CONCLUSION
It's about time to lock in some gains in the $70-90 range IMO, and to look to buy the stock back in 2026.
Long trade 📘 Trade Journal Entry
Pair / Ticker: RKLB (Rocket Lab Corporation – NASDAQ)
Date Range: Mon 6th Oct → Wed 8th Oct 2025
Session Context: London to New York → New York PM Continuation
Direction: Buyside Trades (Continuation Sequence)
Timeframe: 15 minutes
🔹 Trade 1
Entry: $56.91
Profit Target: $68.04 (+19.54 %)
Stop Loss: $56.11 (-1.42 %)
Risk-Reward (RR): ≈ 13.75
Duration: 1 day 21 hours 30 minutes → Target Reached (BS Level 27_98)
📘Model Type: Breaker Block → FVG Continuation Model nested
within the Higher-Timeframe Accumulation Phase.
🔹 Trade 2
Entry: $65.29 → $67.77
Profit Target: $77.09 (+18.07 %)
Stop Loss: $64.33 (-1.47 %)
Risk-Reward (RR): ≈ 12.29
15min TF overview
Status: Active / In Progress toward 2.618 Fib extension ( $77 – $77.13 zone )
🧭 Technical Context and Narrative
Market Structure: Strong uptrend continuation following prior accumulation below $50.
Break of structure confirmed with multiple BOS points and sustained EMA support (50 > 200 WMA).
🧭FVG Alignment: Each impulse leg created stacked FVGs used as entry zones for continuation buyside setups.
🧭Volume Signature: Distinct volume spikes at breakout levels ($53 → $56 and $65 → $67) confirm institutional activity and absorption.
🧭Sentiment Driver: Risk-on rotation and momentum growth stock bid support the buyside bias as the tech sector recovers post-correction.
🧭Fib Projection: Measured move target extension aligns with 2.272–2.618 zones ($72 – $77) for the current leg.
💡 Sentiment and Outlook
Market sentiment remains bullish, driven by volume expansion and liquidity breaks above NY and LND session highs. Expectation of a continuation move toward the $77 handle, with partial profit zones near the 2.272 Fib ($72.01) before final distribution. Maintain buyside bias as long as price remains above $65 and the current FVG ( $66 – $68 ) holds as support.

Long trade 🚀 Rocket Lab Corporation (RKLB) — 15M Chart & Sentiment Analysis
Date: Tues, 7th Oct 2025
Ticker: RKLB (NASDAQ)
Close: $61.51 (+5.15%)
After Hours: $61.54 (+0.05%)
🧭 Technical Overview (15M Chart)
Bias: Buyside continuation
Structure:
Breakout above prior range ($38.36–$53.18) with retest at $56.90 zone.
Bullish structure with EMA alignment — 50 EMA > 200 EMA.
High-momentum candle structure with volume confirmation.
Trade Setup:
Entry: $56.91
Stop: $56.11 (-1.41%)
Target: $68.06 (+19.56%)
R/R: ≈ 1:13.9
15min TF
Volume: Increasing with each leg — confirmation of institutional inflow.
Key Fibonacci Extensions:
1.272 → $57.20
1.618 → $62.32 (near-term resistance)
2.0 → $67.98 (target zone)
2.272 → $72.01
2.618 → $77.14
Overall Sentiment: Bullish momentum with moderate caution
Positive Drivers:
📈 Growth: FY 2025 Q2 revenue up 53.46%, with expanded launch schedule.
🤝 Partnerships: Secured a 10-launch deal with Syn-spective, strengthening global presence.
💰 Inside News: Reported $4.40 million in insider purchases (2 sales by CFO Adam C. Spice).
🚀 Contract Pipeline: Now 21 missions under contract — reinforces reliability and revenue.
📊 Stock Momentum: +29% in the last month; strong institutional accumulation observed.
Concerns / Neutral Factors:
⚠️ Operating margin at -44.68% for FY Q2 — high burn rate remains a risk.
📉 Return on invested capital (ROIC): -40.95% — short-term profitability still lagging.
🧮 Analyst stance: Caution on valuation despite expansion potential; price currently exceeds most target estimates.
Trade Narrative
The trade aligns with both technical and sentiment strength — a confirmed structural breakout supported by expanding launch contracts and insider accumulation. Maintaining above $56.90 keeps the buyside trajectory intact, targeting $68.00–70.00 (Fib 2.0–2.272) as the next liquidity objective. Failure to hold below $56.90 would indicate a re-entry toward $53.00–$ 54.00 for potential re-accumulation.
Conclusion:
Rocket Lab (RKLB) exhibits strong bullish continuation both technically and sentimentally. The alignment of launch expansion news, insider activity, and high-volume breakout supports the next upside projection toward $68–70, provided $56.90 remains defended as structural support.

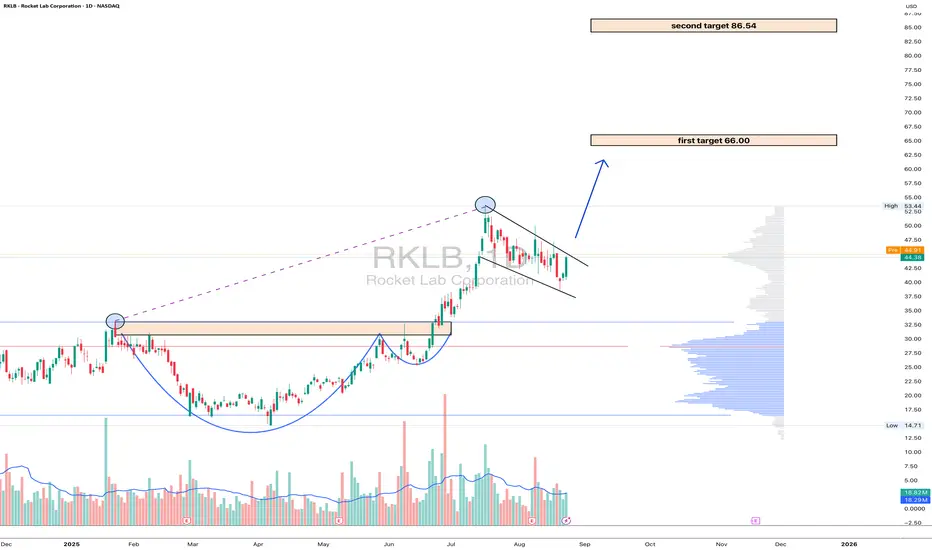
RKLB: the rocket is fueled and ready for orbitOn the daily chart of Rocket Lab (RKLB) , the price is trading at $44.38 after a confident breakout above key consolidation zones. Technically , the break of the $40 level confirmed the strength of the bulls and solidified the upward structure. The next target is $66 - a strong resistance aligned with the Fibo extension and if momentum holds, the market could extend toward $86.54, where long-term levels converge. EMA indicators remain below the price, reinforcing the bullish outlook.
Fundamentally , Rocket Lab stands as a leader in the small-launch vehicle sector, strengthened by contracts with NASA and consistent commercial demand. Amid growing interest in the aerospace industry and rising competition with SpaceX, the company benefits from diversified revenue streams and steady launch schedules. On the geopolitical side, increased defense programs in the U.S. and allied nations provide additional long-term support.
Tactically , the zone above $40 now acts as a support: as long as price holds above it, the bullish scenario remains intact. Targets are set at $66 and $86.54. Short-term corrections are possible if the market overheats, but the broader structure points upward, with institutional flows suggesting accumulation.
If this scenario plays out, Rocket Lab won’t just launch satellites - it’ll launch portfolios into orbit.