Take a bullish position on AMZN as price action signals upside mCurrent Price: $244.22
Direction: LONG
Targets:
- T1 = $255.50
- T2 = $262.00
Stop Levels:
- S1 = $239.50
- S2 = $234.00
**Wisdom of Professional Traders:**
This analysis synthesizes insights from thousands of professional traders and market experts, leveraging collective intelligence to identify high-probability trade setups. The wisdom of crowds principle suggests that aggregated market opinions often outperform individual forecasts, minimizing biases and offering a consensus view on AMZN’s current trajectory.
**Key Insights:**
Amazon remains at the forefront of innovation and market dominance across multiple sectors, including e-commerce, cloud computing, and digital advertising, with 2025 projections indicating sustained growth across its key business units. AWS, Amazon’s cloud platform, continues to outperform competitors by capitalizing on generative AI technologies, offering enterprise solutions that promote adoption and profit expansion in high-margin areas. Amazon's growing efficiency in supply chains and expanding advertising network further solidify its revenue streams.
Furthermore, the stock’s technical structure exhibits bullish signs, with AMZN climbing past the critical $240 resistance level during early November. Accompanying this breakout were significant volume surges indicative of strong institutional buying interest. With holiday-season retail and AWS growth expected to peak during Q4, Amazon’s market positioning remains highly favorable, supported by attractive fundamentals.
**Recent Performance:**
AMZN has shown strong appreciation in recent weeks, gaining 6.8% over October thanks to better-than-expected Q3 2025 earnings. The stock previously oscillated within a range of $220-$238, consolidating before bursting through resistance at $240 in early November. This breakout was catalyzed by positive investor sentiment surrounding high-growth segments such as AWS and digital advertising revenue. While small pullbacks occurred on lighter volume, the price action remains predominantly upward, aligning with broader industry optimism.
**Expert Analysis:**
Leading financial analysts expect AMZN to outperform seasonal expectations during the end-of-year holiday quarter due to robust e-commerce sales and its world-class logistics network—an essential differentiator. Technical experts, meanwhile, highlight AMZN's “golden cross” pattern, where the 50-day moving average has crossed above the 200-day moving average, signaling prolonged bullish momentum. RSI levels at 62 indicate that the stock has upward room without approaching overbought territory, providing traders with confidence for further gains.
**News Impact:**
Recent announcements on Amazon’s large-scale collaborations to enhance generative AI capabilities within AWS have fueled investor expectations for continued innovation and financial performance. Amazon’s revised Q4 guidance anticipates record-breaking holiday sales driven by improving consumer demand alongside logistics efficiency. Additionally, commentary from company leadership has reinforced optimism regarding expanded market opportunities amidst persistent global demand for cloud computing services.
**Trading Recommendation:**
Taking a LONG position on AMZN at $244.22 is strongly supported by both fundamental performance and technical indicators. The stock's breakout above $240 confirms bullish momentum, with price targets set conservatively at $255.50 and $262.00. To safeguard against volatility, traders should establish stop-loss levels at $239.50 and $234.00, ensuring minimal risk exposure. With seasonal revenue acceleration, robust AWS growth, and sustained institutional interest, a well-timed entry could provide significant profit potential during Amazon’s strongest quarter in 2025.
Do you want to save hours every week? Register for the free weekly update in your language!
Trade ideas

How Currency Trading Works1. Introduction
Currency trading, also called foreign exchange (forex or FX) trading, is the global process of buying and selling different currencies. It’s the largest financial market in the world, with over $7.5 trillion traded daily. The main goal is to profit from fluctuations in exchange rates between currencies — for example, buying euros and selling U.S. dollars if you believe the euro will strengthen.
Unlike stock exchanges that operate in specific locations, the forex market is decentralized and functions electronically through a network of banks, institutions, brokers, and traders. It operates 24 hours a day, five days a week, covering all major time zones — from Sydney to London to New York.
2. Structure of the Forex Market
The forex market operates over-the-counter (OTC), meaning there’s no central exchange. Trades occur electronically between participants worldwide. Key market participants include:
Central Banks: Influence currency values through interest rates and monetary policy.
Commercial and Investment Banks: Provide liquidity and handle large transactions.
Corporations: Exchange currencies for global trade and hedging.
Hedge Funds and Financial Institutions: Engage in large-scale speculation.
Retail Traders: Individuals trading through online brokers.
This decentralized structure ensures constant liquidity and continuous trading opportunities.
3. Currency Pairs and Exchange Rates
Currencies are traded in pairs, such as EUR/USD or USD/JPY.
The first currency is the base currency.
The second is the quote currency.
The exchange rate shows how much of the quote currency is needed to buy one unit of the base currency.
Example:
If EUR/USD = 1.1000, it means 1 euro = 1.10 U.S. dollars.
When a trader buys EUR/USD, they are buying euros and selling dollars, expecting the euro to rise. Selling the pair means expecting the euro to fall against the dollar.
4. Major, Minor, and Exotic Pairs
Currency pairs fall into three main categories:
Major Pairs: Include the U.S. dollar and another major currency like the euro, yen, or pound. (Examples: EUR/USD, USD/JPY)
Minor Pairs (Crosses): Don’t include the U.S. dollar. (Examples: EUR/GBP, GBP/JPY)
Exotic Pairs: Combine a major currency with one from a developing economy. (Examples: USD/INR, EUR/TRY)
Majors are the most liquid and widely traded, while exotic pairs are less liquid but often more volatile.
5. How Forex Trading Works
In forex trading, you buy one currency and sell another simultaneously. For example:
You buy EUR/USD at 1.1000 expecting the euro to rise.
If the rate increases to 1.1100, you can sell for a profit.
If it falls to 1.0900, you incur a loss.
This system allows traders to profit in both rising and falling markets — one of the key attractions of forex.
6. Bid, Ask, and Spread
Each currency pair quote shows two prices:
Bid price: Price at which you can sell the base currency.
Ask price: Price at which you can buy the base currency.
Spread: The difference between the two, representing the broker’s fee.
Example: EUR/USD = 1.1000 / 1.1002 → spread = 0.0002 (2 pips).
Tight spreads mean lower trading costs.
7. Leverage and Margin
Forex trading often involves leverage, which lets traders control large positions with small capital.
For instance, with 1:100 leverage, $1,000 can control a $100,000 position.
If the trade moves 1% in your favor, you gain $1,000; if it moves 1% against you, you lose the same amount.
While leverage boosts potential returns, it also magnifies risks — making proper risk management essential.
8. Fundamental Drivers of Currency Prices
Currency values are influenced by a mix of economic and political factors, including:
Interest Rates: Higher rates attract foreign investment, boosting demand for the currency.
Inflation: Low inflation strengthens a currency’s value.
Economic Growth: Strong GDP and employment data support currency appreciation.
Central Bank Policy: Actions by the Federal Reserve, ECB, or RBI directly move markets.
Trade Balance: Surpluses strengthen a currency; deficits weaken it.
Political Stability: Investors prefer politically stable nations.
Successful traders follow economic calendars and analyze these events to anticipate market reactions.
9. Technical Analysis
Apart from economic fundamentals, traders use technical analysis — studying price charts and patterns to forecast future moves.
Common tools include:
Support and Resistance levels – key price zones where markets tend to reverse.
Candlestick Patterns – like Doji, Engulfing, and Pin Bar.
Indicators – Moving Averages, RSI, MACD, Bollinger Bands.
Trendlines and Channels – to identify overall direction.
Technical analysis helps traders time entries and exits more precisely.
10. Trading Styles
Forex traders use different approaches depending on their risk tolerance and goals:
Scalping: Very short-term trades lasting seconds or minutes.
Day Trading: Positions opened and closed within the same day.
Swing Trading: Holding positions for days or weeks to capture medium-term moves.
Position Trading: Long-term approach based on macro trends.
Each style demands discipline, strategy, and awareness of market volatility.
11. The 24-Hour Forex Market
The forex market operates continuously across four major sessions:
Sydney Session: Opens early but with low volume.
Tokyo Session: Focused on yen and Asian pairs.
London Session: Most liquid and volatile; overlaps with other sessions.
New York Session: Active for USD-based pairs and overlaps with London.
The London–New York overlap (around 7 PM to 10 PM IST) is the busiest period with the most price action.
12. Role of Brokers and Trading Platforms
Retail traders access forex via brokers, who connect them to global liquidity providers. Brokers offer trading platforms like MetaTrader 4 (MT4), MetaTrader 5 (MT5), and cTrader, which display live prices, charts, and order tools.
Two main broker models exist:
ECN/STP Brokers: Directly route orders to the interbank market with transparent pricing.
Market Makers: Quote their own prices and act as the counterparty to trades.
When choosing a broker, traders look for tight spreads, fast execution, and strong regulation.
13. Risk Management
Because leverage and volatility are high in forex, risk management is critical.
Some essential practices include:
Stop-Loss Orders: Automatically limit losses when the market moves unfavorably.
Take-Profit Orders: Lock in gains at preset targets.
Position Sizing: Adjust trade size relative to account balance.
Avoiding Over-Leverage: Using excessive leverage can lead to rapid losses.
Emotional Discipline: Avoid chasing losses or impulsive trades.
Smart risk control ensures longevity in trading, even when not every trade is profitable.
14. Technology and Automation
Technology plays a huge role in modern forex trading.
Algorithmic trading systems and Expert Advisors (EAs) automatically execute trades based on programmed strategies.
AI and big data are increasingly used to analyze sentiment, volatility, and macroeconomic patterns in real time.
Additionally, mobile apps and online platforms have made trading accessible to millions of individuals worldwide.
15. Regulation and Legal Aspects
Due to its global nature, forex regulation varies across countries.
Major regulators include:
U.S.: CFTC and NFA
U.K.: FCA
Europe: ESMA
India: SEBI and RBI
In India, trading is allowed only through recognized exchanges like NSE or BSE, and only in INR-based pairs (USD/INR, EUR/INR, GBP/INR, JPY/INR). Offshore forex trading using foreign brokers is restricted under Indian regulations.
16. Pros and Cons of Currency Trading
Advantages:
High liquidity and 24-hour access
Low transaction costs
Opportunity to profit in both up and down markets
Low capital requirement due to leverage
Challenges:
High risk due to leverage and volatility
Emotional stress and discipline demands
Unpredictable geopolitical and economic shocks
Potential for scams in unregulated regions
Understanding both sides helps traders maintain realistic expectations and develop sustainable strategies.
17. Example of a Simple Trade
Let’s consider a practical example:
Suppose a trader believes that the British pound (GBP) will strengthen against the U.S. dollar (USD) due to better U.K. economic data.
They buy GBP/USD at 1.2500.
Later, the rate rises to 1.2600 — a 100-pip gain.
If the trader’s position size is $100,000, each pip is worth $10.
Profit = 100 pips × $10 = $1,000.
However, if the rate falls to 1.2400, the trader loses the same amount.
This shows how small movements can produce large profits or losses, especially with leverage.
18. The Psychology of Forex Trading
Beyond strategy, trading psychology determines long-term success.
Emotions like fear, greed, and impatience often lead traders to exit early or overtrade.
Maintaining discipline — sticking to a plan, accepting losses, and managing expectations — separates professionals from beginners.
Many traders adopt journals or checklists to review trades and control behavior.
19. Global Importance of Forex Trading
Forex plays a crucial role in the global economy by facilitating:
International trade and investment
Cross-border business operations
Hedging against currency risks
Global financial stability
Every multinational company, bank, and government depends on currency conversion — making forex the lifeblood of global commerce.
20. Conclusion
Currency trading is a dynamic, high-liquidity financial arena that connects economies across the world.
By understanding how currencies are traded, what drives their value, and how to manage risk effectively, traders can navigate this vast market with confidence.
However, success in forex isn’t just about knowledge — it requires patience, emotional balance, and continuous learning. When approached responsibly, currency trading offers a unique opportunity to participate in the heartbeat of the world’s financial system.
AI as a Catalyst for Global Economic IntegrationIntroduction: A New Era of Intelligent Globalization
Artificial Intelligence (AI) is redefining how the world communicates, trades, and grows economically. Unlike the previous waves of globalization powered by industrialization or digital communication, the AI revolution represents a more intelligent and automated form of global integration. It is not just connecting markets—it is aligning human decision-making, production efficiency, and cross-border collaboration on a scale never seen before.
AI acts as a catalyst for global economic integration by enabling smarter supply chains, automated financial systems, predictive analytics for trade, and adaptive manufacturing that transcends geographical limitations. From multinational corporations optimizing global logistics to small businesses accessing international markets through AI-driven e-commerce, the influence of artificial intelligence is broad and transformative.
In the following sections, we explore how AI fosters global integration, reshapes economic landscapes, and bridges gaps between developed and developing economies.
1. The Foundation of Economic Integration in the AI Age
Economic integration refers to the process where nations coordinate economic policies, remove trade barriers, and align market systems to promote free flow of goods, services, capital, and technology. Historically, it evolved in stages — from free trade agreements and customs unions to common markets and economic unions.
Now, AI adds a fifth dimension to this progression: intelligent integration. This stage is marked by the use of machine learning, automation, and data analytics to:
Synchronize economic data across borders
Predict market behavior
Improve trade efficiency
Foster innovation in global industries
AI creates digital bridges that are faster and more accurate than political treaties or traditional trade mechanisms. It ensures that integration is not just about policy coordination but about real-time decision alignment across continents.
2. AI and the Transformation of Global Trade Dynamics
Global trade is the lifeblood of economic integration. Traditionally, logistics inefficiencies, fluctuating demand, and geopolitical uncertainties hindered smooth trade flows. AI is eliminating these barriers through advanced analytics and automation.
a. Predictive Trade Analytics
AI can analyze large datasets of global demand, pricing trends, and shipping routes to forecast trade movements. This helps exporters and importers anticipate shifts in demand, reduce wastage, and optimize production levels.
For instance, platforms like IBM Watson and Google Cloud AI provide supply chain optimization solutions that monitor real-time trade conditions and suggest best routes and timings.
b. Smart Logistics and Supply Chains
AI-driven supply chains are becoming self-learning systems. Algorithms can monitor port congestion, weather disruptions, or political instability and automatically reroute shipments. Autonomous vehicles and drones further enhance delivery speed and cost efficiency.
Global logistics firms like Maersk and DHL already use AI for predictive maintenance, route optimization, and fuel management — all of which make global trade more seamless.
c. Cross-Border Payment Automation
AI-based fintech systems enable smoother international transactions. Machine learning helps detect fraud, optimize currency conversion, and reduce transaction time. Digital banks use AI algorithms to assess risk and facilitate instant credit approvals, making it easier for small and medium enterprises (SMEs) to engage in global trade.
3. AI Empowering Emerging Economies
One of the most promising aspects of AI in global integration is its potential to level the playing field between developed and developing nations.
a. Access to Global Markets
AI-driven platforms such as Alibaba’s AI commerce tools or Amazon’s recommendation systems allow small producers from Asia, Africa, or Latin America to reach global customers efficiently. AI translates languages, automates marketing, and predicts consumer demand, enabling local entrepreneurs to compete internationally.
b. Digital Skill Development
AI-based education platforms are providing upskilling opportunities across the world. Through adaptive learning systems, even remote communities can gain technical and financial literacy. This democratization of knowledge promotes workforce integration into global value chains.
c. Agriculture and Manufacturing Uplift
In regions where agriculture and low-cost manufacturing dominate, AI tools enhance productivity. Smart sensors, predictive weather models, and AI-based quality control enable local producers to meet international standards, expanding their market access and economic integration.
4. Financial Integration through AI Innovation
The financial system forms the backbone of economic connectivity. AI is revolutionizing banking, investment, and insurance sectors by creating faster, safer, and more intelligent systems.
a. Global Digital Payments
AI powers the infrastructure behind cross-border digital payments through real-time fraud detection and transaction optimization. Tools like SWIFT GPI and RippleNet use AI to provide near-instant settlements and transparent tracking — reducing the friction of international money transfers.
b. Algorithmic Trading and Market Efficiency
Stock exchanges and investment platforms rely on AI algorithms for predictive modeling, market sentiment analysis, and risk management. These systems help maintain liquidity and transparency in international markets, aligning capital flows across countries.
c. Financial Inclusion
AI-driven mobile banking platforms such as M-Pesa in Africa or Paytm in India extend access to global financial systems for previously unbanked populations. This inclusion accelerates integration by increasing participation in international commerce and remittance flows.
5. Redefining Global Supply Chains
The pandemic and geopolitical tensions have highlighted vulnerabilities in global supply chains. AI is addressing these by introducing resilient and adaptive systems.
Predictive supply chain management: AI forecasts disruptions before they occur.
Automation of inventory control: Smart sensors and robotics balance supply-demand mismatches.
Decentralized manufacturing: AI enables localized production through 3D printing and robotics, reducing dependency on a single country or supplier.
By distributing production intelligence globally, AI ensures that integration is both efficient and sustainable. Companies can collaborate seamlessly across continents with synchronized production schedules and data-sharing platforms.
6. AI and Global Labor Market Integration
AI is not just transforming how businesses operate; it’s reshaping how people work globally.
a. Remote and Cross-Border Collaboration
AI-driven communication tools like Zoom AI Companion, Microsoft Copilot, or ChatGPT enable remote teams from different countries to collaborate effectively. Natural language processing (NLP) tools overcome linguistic barriers, promoting global teamwork.
b. AI in Talent Matching
Platforms like LinkedIn Talent Insights and Indeed AI Recruiter use machine learning to match employers and job seekers across borders. This global labor fluidity supports economic integration by ensuring that talent can flow to where it’s most needed.
c. Productivity and Skill Shift
While some jobs are being automated, AI is simultaneously creating demand for new skills in data analytics, robotics, cybersecurity, and digital marketing. Global labor mobility is increasingly based on AI literacy, encouraging educational institutions and governments to align skill frameworks internationally.
7. Policy, Governance, and Ethical Coordination
As AI-driven integration accelerates, international policy alignment becomes critical.
a. AI Regulation Frameworks
Organizations such as the OECD, EU, and UNESCO are developing AI ethics and data governance standards. Harmonizing these regulations ensures safe and fair use of AI across borders, fostering trust in international trade and data exchange.
b. Data Sharing and Security
Global data flow is the currency of AI-driven integration. Establishing secure and transparent mechanisms for cross-border data exchange is essential for maintaining economic stability and protecting privacy.
c. Collaboration between Nations
Multilateral initiatives like Global Partnership on AI (GPAI) promote research collaboration, resource sharing, and collective policymaking. This cooperative model strengthens the foundation for a globally integrated AI economy.
8. The Role of AI in Sustainable Global Growth
Economic integration today must balance profit with sustainability — and AI is central to this balance.
a. Energy Efficiency
AI optimizes energy consumption in manufacturing, logistics, and transportation. Global initiatives use AI to reduce carbon footprints while maintaining economic growth.
b. Climate Monitoring and Green Trade
AI models help predict climate patterns and assist governments in designing sustainable trade policies. International collaboration on AI-driven environmental technology promotes green integration across markets.
c. Inclusive Growth
AI enables equitable access to technology, finance, and education — reducing inequality and promoting balanced global development.
9. Challenges in AI-Driven Integration
Despite its potential, AI-driven integration faces several challenges:
Digital Divide: Unequal access to AI infrastructure widens the gap between advanced and developing nations.
Job Displacement: Automation threatens traditional employment sectors if reskilling is not prioritized.
Ethical and Data Privacy Concerns: Differing regulations across nations may hinder seamless data flow.
Algorithmic Bias: AI systems can perpetuate inequality if trained on biased data.
Addressing these issues requires a coordinated global strategy emphasizing inclusivity, transparency, and shared innovation.
10. The Road Ahead: Building a Unified AI-Enabled Economy
The next decade will witness the evolution of “AI Globalization 2.0”, where human intelligence and artificial intelligence co-develop economic ecosystems. Nations investing in AI education, digital infrastructure, and ethical frameworks will lead the global integration movement.
Partnerships between governments, corporations, and academia will create a globally interoperable AI network — a system where data, ideas, and innovations move across borders as freely as goods and capital once did.
Ultimately, AI will not just integrate economies but align human progress with technological intelligence, ensuring that globalization evolves toward shared prosperity and sustainability.
Conclusion: Intelligence as the New Currency of Integration
AI has become the central nervous system of the global economy. It drives efficiency, enhances collaboration, and democratizes opportunity. As the world becomes more interconnected through intelligent systems, economic integration will no longer depend solely on trade treaties or capital flows — it will depend on data intelligence, digital cooperation, and shared ethical values.
In essence, Artificial Intelligence is not just a tool of globalization — it is its new architect. It is redefining what it means for nations, businesses, and individuals to be connected, and guiding humanity toward a more integrated, innovative, and inclusive global economy.

AMZN cash flows are strong despite capital expendituresAMZN is valued not on earnings but on operating cash flow. Cash flows are strong with FCF and net operating income remaining robust. Capital expenditures are high in 2025 as the company invests in infrastructure needed for future competitive edge. This may be temporarily leaning on valuations.

AMZN - Could it?2.618 price target, roughly 700-800 USD
Wonder if it could happen
Not financial advice

Amazon Wave Analysis – 20 October 2025
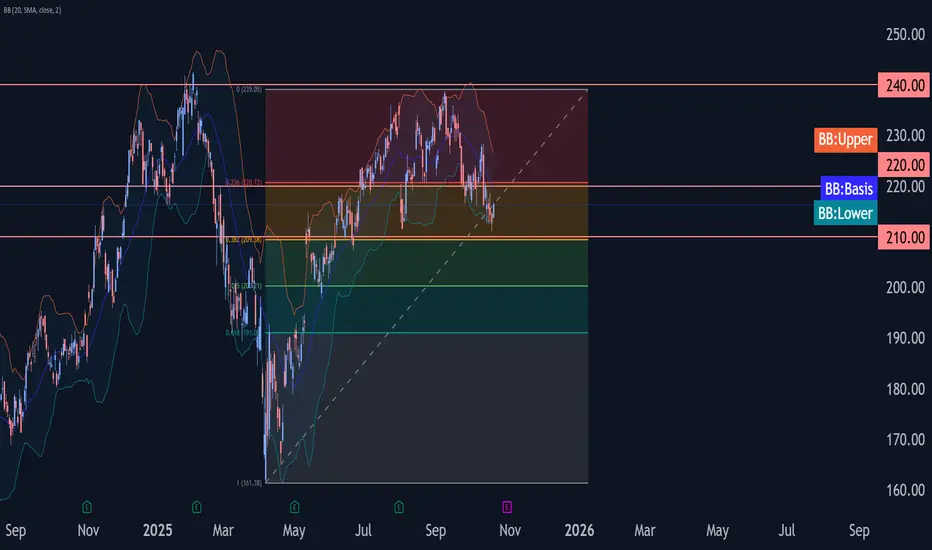
- Amazon reversed from support level 210.00
- Likely to rise to resistance level 220.00
Amazon recently reversed from the support area between the key support level 210.00 (which has been reversing the price from June), lower daily Bollinger Band and the 38.2% Fibonacci correction of the upward impulse from April
The upward reversal from this support zone created the daily Japanese candlesticks reversal pattern Hammer.
Given the strength of the support level 210.00 and the oversold daily Stochastic, Amazon can be expected to rise to the next resistance level 220.00 (former strong support from September).
AMZN | Long Setup | AWS/Ads Margin Mix | Oct 20, 2025AMZN | Long Setup | Q4 Seasonality + AWS/Ads Margin Mix | Oct 20, 2025
🔹 Thesis Summary
Amazon underperformed YTD but enters its strongest seasonal window into Q4 with margin mix improving (AWS + Ads). With earnings on Oct 30 and analyst targets clustered above spot, a defined-risk long seeks a channel continuation toward 292–317, stretching to 417 on multi-quarter follow-through.
🔹 Trade Setup
Bias: Long
Entry Zone: 209–216 (prior breakout retest + HVN)
Stop Loss: 142 (below summer higher-low and volume shelf)
Take-Profits:
• TP1: ~241
• TP2: ~267
• TP3: ~290
• Max Target: 317.1 (extension 417.3 on multi-quarter trend)
R:R (from 213 mid-entry): to TP1 ≈1.4:1, TP2 ≈2.2:1, TP3 ≈3.8:1, Max ≈5.0:1 (417 ≈9.7:1)
🔹 Narrative & Context
Price respects a 2023–2025 rising channel; recent pullback held the channel midline and a dense volume node near 210–212. Multi-tap resistance at 241–246 is the first decision area; clearing it opens 260–292 (measured move from the summer base). Seasonality favors strength into Nov–Dec, and earnings (Oct 30; EPS est 1.57 on $177.8B rev) can catalyze a range expansion. Street positioning remains constructive: 1-yr price-target avg ~265, range 230–306, with a dominant Strong Buy skew and a visible EPS beat cadence on recent quarters. Operational quality remains intact (Gross margin ~49.6%, Op margin ~11.5%, Profit margin ~10.5%). Balance sheet leverage is restrained (LT Debt/Equity ~0.40).
Valuation & Context (Pro Metrics, Framed Simply)
Forward P/E ≈ 28.3x vs large-cap megatech peers mid-20s → modest premium → market pricing AWS/Ads mix resilience → premium is acceptable if EPS growth tracks mid-teens.
P/FCF (screen) elevated vs Alphabet/Microsoft → investors paying up for reinvestment runway → acceptable if AI capex converts to durable cash yields; watch 2026 FCF inflection.
ROIC ≈ 15% vs peers: GOOGL ~29%, MSFT ~23% → solid but not best-in-class → upside if Ads/AWS mix lifts returns.
EPS growth next 5y ~19% → above retail/consumer staples → supports multiple stability through the cycle.
Debt/Equity ~0.46 → conservative leverage → reduces drawdown risk around macro or regulatory shocks.
🔹 Contrarian Angle (Your Edge)
Consensus clusters $230–$306 with focus on AWS deceleration. Price structure shows accumulation above 209–212 and an intact up-channel. With Q4 seasonality, improving operating leverage, and continuing Ads share gains, we see a path to 292–317 in 1–3 quarters and 417 on a multi-quarter trend extension if margins expand 100–150 bps from mix.
🔹 Risks (Balanced)
AWS growth undershoots or margin compression from AI capex.
Regulatory/antitrust actions affecting retail or Ads.
Consumer softness or post-earnings gap below 200 invalidating the base.
🔹 Macro Considerations
Track NDX breadth and real yields; higher real rates could cap the multiple.
USD strength pressures international; weakness helps.
Event risk: Oct 30 earnings, CPI/PCE prints, and large-cap tech earnings read-through; watch cloud commentary from MSFT/GOOGL for competitive signals.
🔹 Bottom Line
AMZN screens slightly expensive on headline multiples, but the mix (AWS/Ads) and Q4 seasonality justify a defined-risk long. Above 246, momentum opens 260–292; sustained strength targets 317, with 417 as an extended objective if margins and FCF inflect through 2026.
🔹 Forward Path
If this post gets 10+ likes, I’ll publish a follow-up on the weekly structure, update earnings levels (gap/hold/fail), and adjust targets based on post-print volume profile.
Like & Follow for structured ideas, not signals. I post high-conviction setups here before broader narratives play out.
⚠️ Disclaimer: This is not financial advice. Always do your own research. Charts and visuals may include AI enhancements.
🔹 Footnote
Forward P/E: Price divided by expected earnings over the next 12 months. Lower = cheaper relative to profits.
P/FCF (Price-to-Free-Cash-Flow): Price vs. the cash left after investments. A measure of efficiency.
FCF Yield: Free cash flow per share ÷ price per share. Higher = more cash returned for each dollar invested.
ROE (Return on Equity): Net income ÷ shareholder equity. Shows management efficiency with investor capital.
ROIC (Return on Invested Capital): Net income ÷ all invested capital (equity + debt). A purer profitability gauge.
Debt/Equity: Debt divided by equity. <1 usually means balance sheet is conservative.
R:R (Risk-to-Reward): Ratio of expected upside vs. downside. 3:1 = you risk $1 to make $3.

Amazon.com Limps Toward EarningsAmazon.com fell on its last earnings report and has continued to struggle as more numbers approach.
The first pattern on today’s chart is the bearish gap on August 1 after weak profit guidance overshadowed strong backward-looking numbers. The ecommerce giant rebounded from the decline but couldn’t hold the gains, which may reflect weakening fundamentals.
Second, AMZN had a weekly close of $228.15 on September 12. It peaked at the same level on October 9 and 10. Has old support become new resistance? The shares also stalled near their 50-day simple moving average (SMA), a potential sign of intermediate-term weakening.
Third is the August 4 close of $211.65. Closing below that line may be viewed as the start of a breakdown. AMZN also closed under its 200-day SMA for the first time since May 9.
Fourth, last week featured a potentially bearish descending triangle. You also have MACD falling and the 8-day exponential moving average (EMA) below the 21-day EMA. All of those signals may be viewed bearishly in the short term.
Finally, AMZN is an active underlier in the options market. That could help traders take positions with calls and puts.
TradeStation has, for decades, advanced the trading industry, providing access to stocks, options and futures. If you're born to trade, we could be for you. See our Overview for more.
Past performance, whether actual or indicated by historical tests of strategies, is no guarantee of future performance or success. There is a possibility that you may sustain a loss equal to or greater than your entire investment regardless of which asset class you trade (equities, options or futures); therefore, you should not invest or risk money that you cannot afford to lose. Online trading is not suitable for all investors. View the document titled Characteristics and Risks of Standardized Options at www.TradeStation.com . Before trading any asset class, customers must read the relevant risk disclosure statements on www.TradeStation.com . System access and trade placement and execution may be delayed or fail due to market volatility and volume, quote delays, system and software errors, Internet traffic, outages and other factors.
Securities and futures trading is offered to self-directed customers by TradeStation Securities, Inc., a broker-dealer registered with the Securities and Exchange Commission and a futures commission merchant licensed with the Commodity Futures Trading Commission). TradeStation Securities is a member of the Financial Industry Regulatory Authority, the National Futures Association, and a number of exchanges.
Options trading is not suitable for all investors. Your TradeStation Securities’ account application to trade options will be considered and approved or disapproved based on all relevant factors, including your trading experience. See www.TradeStation.com . Visit www.TradeStation.com for full details on the costs and fees associated with options.
Margin trading involves risks, and it is important that you fully understand those risks before trading on margin. The Margin Disclosure Statement outlines many of those risks, including that you can lose more funds than you deposit in your margin account; your brokerage firm can force the sale of securities in your account; your brokerage firm can sell your securities without contacting you; and you are not entitled to an extension of time on a margin call. Review the Margin Disclosure Statement at www.TradeStation.com .
TradeStation Securities, Inc. and TradeStation Technologies, Inc. are each wholly owned subsidiaries of TradeStation Group, Inc., both operating, and providing products and services, under the TradeStation brand and trademark. When applying for, or purchasing, accounts, subscriptions, products and services, it is important that you know which company you will be dealing with. Visit www.TradeStation.com for further important information explaining what this means.

AMAZON (AMZN) - H4 - Double Top Breakdown (19.10.2025)📊 Setup Overview:
Amazon stock (NASDAQ: AMZN) is forming a Double Top Reversal Pattern on the 4H chart, signaling potential weakness after failing twice to break above the major resistance zone near $238–$240.The price has also broken below the ascending trendline with a cloud crossover, confirming bearish momentum building up. NASDAQ:AMZN
📈 Trade Plan:
Bias: Bearish below $220
1st Target: $197.91 ✅
2nd Target: $183.99 🎯
Resistance Zone: $238 – $240
🧩 Technical Confluence:
1.Double Top formation near major resistance zone
2.Trendline break confirming reversal
3.Ichimoku Cloud crossover indicating bearish momentum
4.Volume profile shows selling pressure increasing below $215
📉 Fundamental Amazon (AMZN):
Amazon remains one of the most dominant global tech giants, but several near-term factors could impact its price action:
⚡Upcoming Earnings (Late October 2025):
1.Analysts project Q3 FY2025 revenue around $158–160 billion, with EPS expectations near $1.24–$1.30.
2.Focus will be on AWS (Amazon Web Services) performance — which still contributes over 50% of total operating income, but has shown slower growth due to corporate cost-cutting and cloud competition.
⚡Retail & E-commerce Trends:
1.Amazon’s North America segment remains strong but margin pressure continues due to logistics and rising fulfillment costs.
2.The company’s push into AI-driven retail advertising could offset some of that weakness if ad revenue exceeds expectations.
⚡Broader Market Context:
1.With U.S. yields staying elevated, large-cap tech stocks like Amazon may face valuation compression.
2.Institutional rotation toward value and defensive stocks could further weigh on AMZN in the short term.
🎯Overall, fundamentals remain strong for the long-term, but the technical structure suggests a near-term correction before accumulation resumes.
#AMZN #AmazonStock #NASDAQ #USStocks #TechnicalAnalysis #DoubleTopPattern #BearishSetup #PriceAction #EarningsWatch #StockMarket #SwingTrading #TradingView #Ichimoku #CloudCrossover #ChartsDontLie #Kabhi_TA_Trading
⚠️ Disclaimer:
This analysis is for educational purposes only and not investment advice. Always perform your own due diligence and manage risk appropriately before taking any position.
💬 Support the Analysis:
If this chart helped you — LIKE 👍, COMMENT 💬 your thoughts, and FOLLOW ✅ for more daily stock & forex chart breakdowns from Kabhi_TA_Trading!

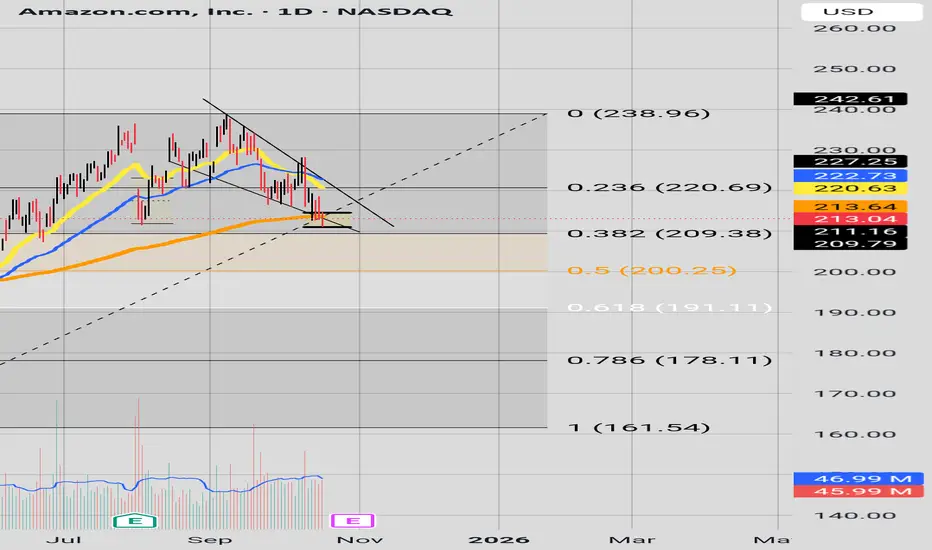
Inflection PointWe have a hammer candle near the 200 EMA and the 0.382 Fibonacci Level. The 200 EMA 213.64$ needs to be held. If we get strong bearish activity below 209$ with a break below the fallen wedge the bears will celebrate. Bulls need in a few days bullish activity with a higher close above Friday hammer candle.
AMAZONAMAZON has done what we expected last week, this week we are expecting an up move to start.
Disclosure: We are part of Trade Nation's Influencer program and receive a monthly fee for using their TradingView charts in our analysis.

Global Trade Future in an AI-Driven EconomyIntroduction
Global trade has always been a cornerstone of economic development, enabling countries to exchange goods, services, and technologies to promote mutual growth. Over centuries, innovations such as the steam engine, telecommunication, and the internet have reshaped how nations trade. Now, as the world enters the era of Artificial Intelligence (AI), we stand at the threshold of another massive transformation — one that promises to redefine the very nature of global commerce, logistics, and economic competitiveness.
AI is no longer just a futuristic concept; it has become an integral component of trade strategy, supply chain management, and decision-making processes. From predictive analytics that forecast market demand to intelligent automation that optimizes logistics and customs operations, AI is revolutionizing global trade in unprecedented ways. The integration of AI into international trade will not only boost efficiency and transparency but also shift the balance of economic power among nations.
1. The Role of AI in Reshaping Global Trade Dynamics
AI is reshaping the foundation of global trade through its ability to analyze massive datasets, identify patterns, and make autonomous decisions. Traditional trade systems relied heavily on human judgment, which often led to inefficiencies and delays. With AI, businesses and governments can make real-time data-driven decisions, improving the flow of goods and reducing costs.
For instance, AI-powered trade analytics help governments and corporations identify emerging market opportunities, detect trade anomalies, and optimize export-import operations. Machine learning algorithms can also predict trade trends by analyzing economic indicators, consumer behavior, and geopolitical developments. These insights empower businesses to act quickly and strategically, strengthening their global position.
Moreover, AI can support policymakers in negotiating trade agreements by simulating various economic scenarios and predicting the impact of tariffs, quotas, or sanctions. This capability enables better-informed decisions that promote fair trade and stability in the global market.
2. AI-Driven Supply Chain Transformation
The backbone of global trade lies in efficient supply chain networks. However, these networks are often complex, involving multiple countries, regulations, and logistical challenges. AI is transforming this landscape by introducing predictive intelligence, automation, and real-time optimization.
a. Predictive Logistics and Demand Forecasting:
AI-driven systems analyze consumer demand patterns, weather data, transportation routes, and geopolitical risks to forecast supply needs accurately. Companies can anticipate demand fluctuations and adjust production schedules and shipping plans accordingly, reducing waste and costs.
b. Smart Warehousing and Automation:
AI-powered robots and automated systems are now handling warehouse operations — from sorting packages to managing inventory. This not only accelerates delivery times but also reduces errors in logistics management. Companies like Amazon and Alibaba are leading this revolution with AI-driven fulfillment centers.
c. Route Optimization and Risk Management:
AI algorithms can evaluate trade routes and suggest the most cost-effective and least risky paths for shipments. By integrating satellite data, customs regulations, and weather forecasts, AI ensures smoother transportation of goods across borders.
d. Sustainability and Carbon Tracking:
AI tools are helping companies monitor carbon emissions in their supply chains, promoting greener logistics. This aligns with the global shift toward sustainable trade practices, as nations increasingly link environmental responsibility with trade policy.
3. AI in International Trade Finance and Payments
Global trade transactions depend heavily on financial systems that facilitate payments, credit, and risk management. AI is now transforming international trade finance by improving transparency, reducing fraud, and enhancing financial inclusion.
a. Automated Credit Assessment:
Machine learning algorithms analyze financial data, transaction history, and market conditions to evaluate the creditworthiness of buyers and sellers. This reduces the dependency on traditional banking systems and enables small and medium-sized enterprises (SMEs) to access financing easily.
b. Fraud Detection and Cybersecurity:
AI plays a critical role in identifying fraudulent trade transactions. By examining transaction patterns and anomalies in real time, AI systems can flag potential scams before they occur. This strengthens the integrity of international trade finance systems.
c. Blockchain and AI Integration:
When combined with blockchain, AI can enhance transparency in trade finance by verifying document authenticity and automating smart contracts. This fusion minimizes human intervention, speeds up payment processing, and reduces disputes between trading partners.
4. AI-Powered Trade Policy and Economic Forecasting
Governments and international organizations rely on accurate data to formulate trade policies and economic strategies. AI has become a vital tool in this domain, offering unparalleled predictive capabilities.
AI systems analyze global market trends, price fluctuations, and geopolitical risks to forecast trade outcomes. For example, AI can simulate the potential impact of new tariffs or sanctions on a country's exports and imports. This empowers policymakers to craft adaptive trade policies that safeguard national interests while maintaining global competitiveness.
Furthermore, AI-driven economic models assist in predicting the impact of global crises — such as pandemics or conflicts — on international trade. By modeling potential disruptions, governments can take preventive measures to stabilize their economies.
5. The Rise of Smart Ports and Digital Customs
The logistics and customs sectors are crucial in facilitating international trade. AI is revolutionizing these areas through automation, digitalization, and intelligent monitoring systems.
a. Smart Ports:
Ports around the world are adopting AI-based systems to manage cargo flow, schedule docking, and inspect containers. For example, the Port of Rotterdam uses AI to predict vessel arrival times and optimize terminal operations, reducing congestion and improving efficiency.
b. Digital Customs Clearance:
AI-enabled customs systems can automatically verify trade documents, inspect goods through image recognition, and detect compliance issues. This minimizes delays, reduces corruption, and enhances trade transparency.
c. Predictive Border Management:
By analyzing real-time trade data, AI helps governments identify illegal shipments, potential smuggling activities, and compliance violations. This ensures national security while keeping legitimate trade unhindered.
6. Global Competitiveness in the AI-Driven Economy
The integration of AI into global trade will inevitably reshape global economic hierarchies. Countries that invest heavily in AI infrastructure, research, and data capabilities will gain a competitive edge.
a. Developed Nations Leading the Way:
Countries like the United States, China, Japan, and members of the European Union are spearheading AI-driven trade innovations. They are deploying AI in logistics, customs, and production to enhance export efficiency and competitiveness.
b. Opportunities for Emerging Economies:
Developing nations, too, can leverage AI to boost trade performance. By adopting AI-based manufacturing and logistics technologies, they can integrate more deeply into global supply chains. For example, AI can help African and South Asian nations optimize agricultural exports through predictive crop analytics and logistics automation.
c. AI as a Strategic Trade Asset:
In the future, AI will itself become a tradable commodity — in the form of algorithms, data platforms, and machine learning models. Nations that dominate AI technology will have significant leverage in international negotiations, similar to how oil-rich nations influenced trade in the 20th century.
7. Challenges in an AI-Driven Trade Environment
While AI offers enormous benefits, it also brings several challenges that global stakeholders must address to ensure inclusive and fair trade growth.
a. Data Privacy and Security:
Trade operations rely on massive datasets shared across borders. Ensuring data security and compliance with international privacy laws remains a major challenge.
b. Technological Inequality:
Not all countries possess the infrastructure or expertise to adopt AI at the same pace. This digital divide could widen the gap between developed and developing economies.
c. Job Displacement:
Automation in logistics, manufacturing, and finance could lead to significant job losses, particularly in developing economies dependent on manual labor. Governments must focus on upskilling and reskilling programs to manage this transition.
d. Ethical and Regulatory Issues:
AI systems can sometimes make biased or opaque decisions. Transparent and standardized AI governance frameworks are needed to maintain fairness in international trade.
e. Dependence on Digital Infrastructure:
AI-driven trade depends heavily on stable digital networks and data access. Cyberattacks or digital infrastructure failures could disrupt global trade operations.
8. Future Outlook: AI and the Next Generation of Global Trade
The future of global trade in an AI-driven economy is promising yet complex. By 2035, AI could contribute an estimated $15 trillion to the global economy, with a substantial portion coming from enhanced trade efficiency and innovation. The integration of AI into trade processes will create a more connected, transparent, and resilient global economy.
a. Hyper-Personalized Trade Ecosystems:
AI will enable customized trade experiences, where buyers and sellers connect through predictive matchmaking based on demand and supply algorithms.
b. Autonomous Trade Systems:
In the future, AI-driven autonomous ships, trucks, and drones will handle transportation, while blockchain-based smart contracts will execute transactions automatically, minimizing human intervention.
c. Data-Driven Trade Governance:
Trade organizations like the World Trade Organization (WTO) and regional trade blocs will increasingly rely on AI for policy modeling, compliance monitoring, and dispute resolution.
d. AI-Powered Digital Trade Platforms:
Digital marketplaces powered by AI will facilitate cross-border trade for SMEs, providing global reach without the complexities of traditional export systems.
Conclusion
The rise of Artificial Intelligence marks the beginning of a new era for global trade. As AI continues to permeate every aspect of economic activity — from production and logistics to finance and governance — it is redefining how nations interact and compete. The fusion of data, automation, and intelligence is creating a more agile, transparent, and inclusive global trading system.
However, this transformation demands responsible governance, international cooperation, and equitable access to technology. Nations must work together to create standardized AI regulations, invest in digital infrastructure, and ensure that the benefits of AI-driven trade are shared globally.
Ultimately, the future of global trade in an AI-driven economy will depend on how humanity harnesses this technology — not just for profit, but for sustainable, fair, and inclusive global prosperity.
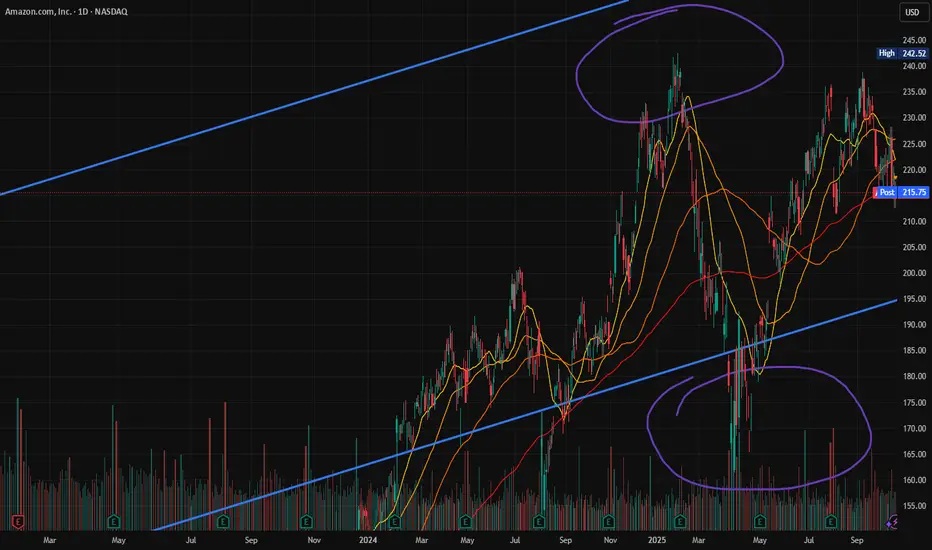
Amazon at the Edge – Bounce or Breakdown?On the daily chart of Amazon (AMZN), the price is sitting right on its long-term uptrend line — a trendline that has supported the stock multiple times since early 2023. The current price hovers around $220, with the 50-day SMA near $225, acting as short-term resistance.
In the short term, a confirmed move above $225 could trigger a rebound toward $235 and $248. A logical stop loss for this bullish scenario is below $210, where the short-term structure would weaken.
In the longer-term view, as long as the price stays above the uptrend line (around $205–$208), the broader trend remains bullish with targets at $255 and $270. However, a confirmed breakdown below $200 would invalidate the uptrend and could lead to a deeper correction toward $185.
Overall, Amazon is at a critical decision zone — the next few sessions will reveal whether it bounces back into strength or breaks its multi-year trendline support.

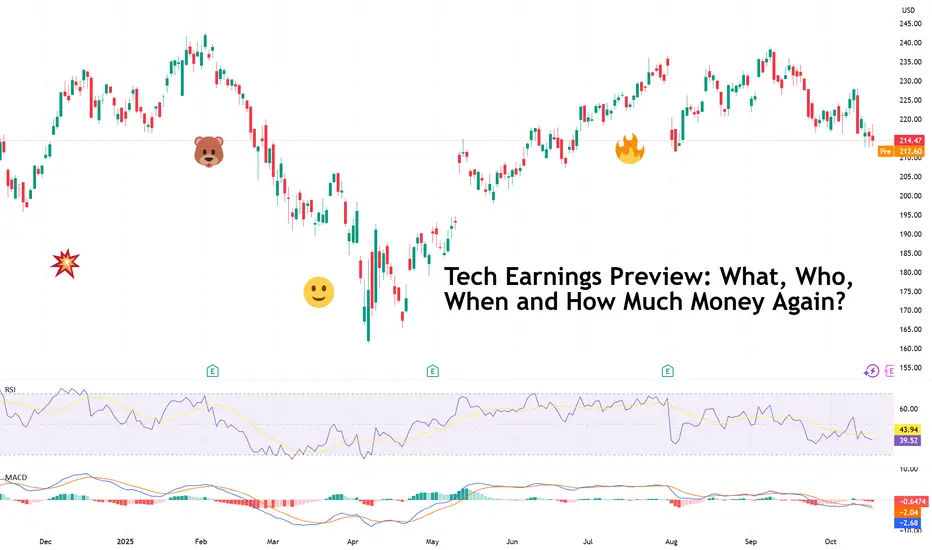
Tech Earnings Preview: What, Who, When and How Much Money Again?“ I don’t know, probably at least around $600 gazillion dollars ,” Zuck, probably if you asked him how much Meta NASDAQ:META will spend over the fiscal year.
It’s earnings season , which means Wall Street’s most expensive hobby — guessing how much the tech giants will make while pretending it’s about “long-term fundamentals” — is back in full swing.
💥 Welcome to Earnings Season
Happy third-quarter earnings, everyone. The candles are lit, the spreadsheets are out, and $1.6 trillion vanished from US stock valuations last Friday. Perfect timing.
Markets are reeling from tariff shocks and macro jitters, but traders have already shifted their gaze to the next big thing: Big Tech .
As is tradition, the Magnificent Seven — those trillion-dollar titans who make up roughly one-third of the S&P 500’s SP:SPX weight — are once again the main characters in this quarterly drama.
You’ve got AI. You’ve got spending. And you’ve got spending on AI.
🔔 Here We Go Again
This quarter, the storyline hasn’t changed much — it’s still “show me the money” season for artificial intelligence. Investors have spent the better part of two years rewarding CEOs for throwing the AI acronym in all their earnings calls. Is this time different?
• Amazon NASDAQ:AMZN reports the week of October 21, with everyone eyeing AWS — the quiet moneymaker funding Jeff Bezos’ rocket ambitions and your Prime Day discounts.
• Apple NASDAQ:AAPL , Microsoft NASDAQ:MSFT , and Meta NASDAQ:META follow around October 29. Investors will be laser-focused on who’s turning AI hype into product and revenue.
• And let’s not forget Alphabet NASDAQ:GOOGL , which already set the tone with a capex number that could fund a small country — $85 billion in 2025 alone , largely for AI infrastructure.
The question now: how much longer can these companies throw billions at Jensen Huang GPUs before shareholders start asking for a receipt?
🏗️ The AI Arms Race: Spending as a Strategy
The Magnificent Seven are still in an all-out hardware and data-center build-out. Meta’s Mark Zuckerberg is burning through cash to create the metaverse (yes, that still exists), but this time, powered by AI.
Nearly every megacap tech firm is building power plants to feed OpenAI. And Nvidia NASDAQ:NVDA — the company selling shovels in the AI gold rush — is counting every dollar.
Together, these firms are expected to spend hundreds of billions in the second half of 2025 just on computing power. Investors will be parsing every line of guidance for capex updates — because right now, spending is the strategy.
But the logic is sound (for now): If AI really does drive the next wave of productivity and profit, then whoever builds the infrastructure owns the future.
📊 The Numbers Game: What Wall Street Expects
Across the S&P 500 SP:SPX , earnings are projected to grow 8.8% year-over-year this quarter, on revenue growth of 6.4%, according to Seaport Research Partners. That may sound modest, but it’s for a reason: two-thirds of companies usually beat estimates.
Keep them achievable, and markets will celebrate. Pin them too high, and markets will be disappointed.
What’s more, earnings aren’t expected to stall anytime soon. FactSet data shows analysts projecting:
• 6.4% average annual sales growth for the S&P 500 through 2027
• 14% average annual earnings growth over the same period
That’s what rate cuts are supposed to do — a little liquidity trick, some risk-on mood, and suddenly even industrials and Buffett’s picks start looking interesting again.
Still, there’s one elephant in the room: valuation. The S&P 500 trades at 23 times forward earnings, which is, to use the technical term, “a lot.” At that level, even a small earnings miss could send stocks tumbling.
🧮 Winners, Losers, and the Market’s Short Memory
Some IPOs may have stolen headlines this year — looking at you, Figma NYSE:FIG and Circle NYSE:CRCL — but earnings season is where the real judgment happens.
A good report can add hundreds of billions in market cap overnight. But a bad one can do the same in the opposite direction .
Meta is under pressure to prove its huge spending on Superintelligence Labs is actually worth it. Apple’s got to show iPhone sales didn’t flatline in China. And Microsoft? Well, all it has to do is keep being Microsoft.
Amazon remains the dark horse. Its cloud business is stabilizing, retail’s humming along, and AI integration is just starting to take off. Traders are betting AWS will deliver, as it usually does.
🧘♂️ What Traders Should Watch
To navigate this volatility buffet, focus on:
• Forward guidance — Companies might beat earnings but guide lower, which can trigger pullbacks.
• Capex updates — Follow where the AI billions are flowing.
• Market reactions, not just results — The “sell the news” trade is real.
Sometimes the earnings game isn’t just about who made money — it’s about who surprised the market.
💡 Final Thought: Hype or Habit?
Big Tech’s gravitational pull on the markets isn’t fading anytime soon. Whether you’re bullish on AI or skeptical of its trillion-dollar promises, one thing’s certain — every move these companies make will ripple through every portfolio, index, and ETF on the planet.
As Q3 earnings hit full throttle, keep one eye on the charts and the other on the headlines . Because if there’s one thing Wall Street loves more than good earnings, it’s the story that comes after.
Off to you : How are you preparing to navigate the earnings season and the tech updates? Share your thoughts in the comments!
Option Alert: $AMZN NOV 07 2025 $220 Calls – 118% ROI Potential Enter: NASDAQ:AMZN NOV 07 2025 $220 CALLS
Buy in Price: $8.60 - $8.65
Take Profit: $18.75
Stop Bleeding: $7.57
ROI Potential: 118%
Exit Within: 2 Weeks
Option Alert: $AMZN NOV 07 2025 $220 Calls – 118% ROI Potential Enter: NASDAQ:AMZN NOV 07 2025 $220 CALLS
Buy in Price: $8.60 - $8.65
Take Profit: $18.75
Stop Bleeding: $7.57
ROI Potential: 118%
Exit Within: 2 Weeks

Amazon end of accumulation and expansion will beginAmazon has likely completed its accumulation phase and is showing signs of renewed bullish momentum. A breakout above recent resistance could confirm the start of a new upward trend.
Levels to watch: 232 - 252
⚠️ Not financial advice.

Ethereum is headed for a massive bull market. Hope you guys are ready for the fun part, because Ethereum—according to my analysis—is ready for some massive moves. This means altcoin season is coming in full force very soon. Be ready and ignore the FUD.
As always, stay profitable.
– Dalin Anderson

Amazon (AMZN) – Testing the Breaking Point! Will Buyers Step In or Is a Bigger Drop Coming?
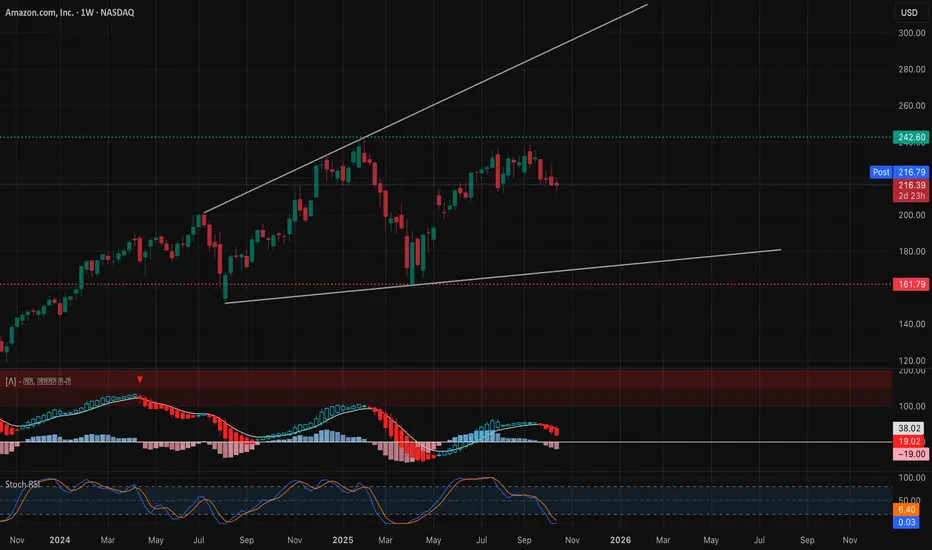
🧭 Weekly Chart – Macro Market Structure
Amazon’s weekly chart reveals a consolidation at the top of a long-term ascending channel, with clear exhaustion signs showing after months of strong accumulation. The structure printed a CHoCH (Change of Character) below the $242 resistance zone, signaling that sellers are regaining control short-term.
Price is now hovering around $197–$216, right above the key structural support that has held since mid-2024. The BOS (Break of Structure) at $197.9 last quarter remains unchallenged, so buyers still have a chance to defend this level.
However, the weekly MACD is flattening after a bearish crossover, and Stoch RSI at 76.9 shows the overbought cooling phase isn’t done yet.
* If $216 fails, expect a deeper retracement to $197 or even $182–$185, aligning with the lower trendline of the macro channel.
* If $220 reclaims, we could see a rebound toward $238–$242, the major supply zone where previous liquidity was swept.
Weekly Summary: Structure still bullish long-term, but short-term correction risk remains high. Bulls must defend $197–$211 zone to prevent a deeper downtrend shift.
⚙️ Daily Chart – Mid-Term Battle Zone
The daily chart paints a more tactical story: AMZN has just confirmed another BOS down while bouncing along the ascending trendline from April. A repeated liquidity grab near $211–$212 has kept price inside this structure.
The 9 EMA has crossed below the 21 EMA, confirming short-term bearish momentum. But the MACD is beginning to flatten, hinting that sellers may be losing steam.
* Bullish Scenario: If AMZN reclaims $218–$220, it opens room for recovery toward $226, then $232 (previous fair value gap and GEX wall zone).
* Bearish Scenario: A daily close below $211.50 would invalidate the local support, triggering continuation toward $197.50 and eventually $182 if the momentum snowballs.
Daily Bias: Neutral-to-bearish until buyers reclaim $220. Still range-bound, but the risk/reward favors patience until structure confirmation.
⏱ 1-Hour Chart – Short-Term Trading Plan
The 1-hour chart shows multiple CHoCH and BOS rotations, forming a clear descending range between $210–$228. The structure is still bearish overall, but the most recent BOS up with bullish divergence on MACD and Stoch RSI indicates potential for a short-term bounce.
Volume profile shows absorption below $212 — that’s where smart money likely reloaded positions.
* Trading Plan:
* Bullish setup: Above $217.5, target $222.5 → $228, stop below $214.5.
* Bearish setup: Below $211.5, short toward $205, stop above $215.
If $217.5 breaks with volume, intraday momentum can accelerate fast toward $222 where heavy GEX call wall aligns.
Short-Term Bias: Accumulation phase in progress. Expect choppy rebounds until one side breaks structure decisively.
💥 Options GEX & Institutional Positioning
From the Options GEX snapshot:
* Highest positive GEX (Call Wall): $222 → Key resistance / potential short-term magnet if breakout happens.
* 2nd Call Wall: $227.5 → strong gamma resistance, aligns with upside fade zone.
* Major PUT Support: $210 (–56.9% GEX) → strong liquidity and protection level.
* IVR 46.4 / IVx 44.4 → elevated volatility, great for traders who prefer spreads over straight directional bets.
Gamma Flow Interpretation: Market makers are heavily neutralized between $215–$220. Above $220, delta hedging could force a rapid squeeze. Below $211, negative gamma expands volatility and drives deeper flushes.
🎯 Option Strategy Suggestions
1️⃣ Bullish Play:
* Buy $220C / Sell $230C (Oct 25 expiry) → captures breakout to $230, limited risk and defined reward.
* For fast momentum: Buy 0DTE/2DTE $217.5 Calls once $218 breaks with strong volume.
2️⃣ Bearish Hedge:
* If $211 breaks, Buy $210P / Sell $200P (Oct 18 expiry) — clean structure for downside continuation.
3️⃣ Neutral Income Play:
* Expecting consolidation? Sell Iron Condor: $230C/$235C + $205P/$200P — capitalize on theta decay while AMZN stays trapped.
💬 Final Thoughts
AMZN is at a critical inflection point — it’s neither fully broken down nor ready to rally yet. This $211–$218 pocket is the battlefield. Bulls reclaiming $220 flips the narrative back to bullish continuation. Bears breaking $211 unlocks a path to $197.
My TA continues to show high win-rate precision, and traders can verify from past history that levels often react exactly as mapped.
If you want me to break down any stock that I don’t regularly post, DM me — I’ll be happy to TA it for you.
This analysis is for educational purposes only and does not constitute financial advice. Always do your own research and manage your risk before trading.

AMZN longAmazon is my most prominent position now with 800 shares. I have been accumulating heavily down here, as I expect a Google-like move from this mega-cap. The market has largely overlooked the fact that they have outpaced Google and Meta in ad growth, despite facing strong robotic and AI headwinds. Even a 1% increase in margins increases their earnings by about $ 7 billion.
Looking at the chart, we are positioned above a recent demand zone, with a Bezos sell wall at the supply. We recently flashed blue on volatility, indicating tremendous upside potential, and momentum has reset. I look for momentum to retest the teal line.

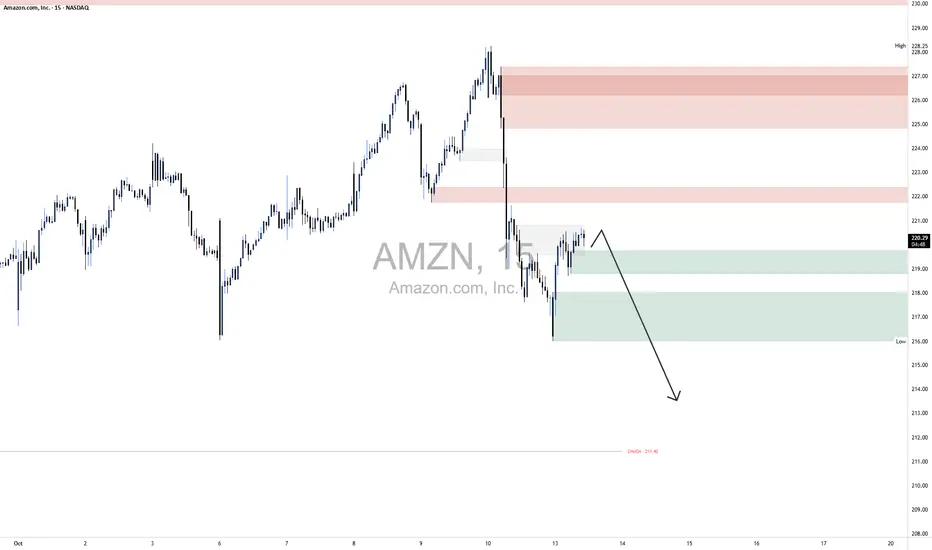
AMZN ShortThe broader market structure on AMZN (15-minute) is bearish, confirmed by a decisive Change of Character (CHoCH) near $226.46, followed by a Break of Structure (BOS) as price pushed below the prior higher low around $220.80. This transition from higher highs to lower lows confirms that sellers have taken control, and the overall direction now favors a continuation to the downside.
Looking at the supply and demand dynamics, the upper supply zones between $223–$226 and $227–$228 are strong, as each has previously triggered sharp, high-volume declines—showing clear signs of institutional selling pressure. In contrast, the lower demand zones between $217–$219 appear relatively weak after price broke through them aggressively before consolidating. Buyers attempted to step in here but failed to create higher highs, indicating that this demand could serve as a short-term reaction area rather than a strong reversal base.
Within the marked region, price is currently hovering just above the $219–$218 demand range after a shallow pullback. The current price action shows compression toward the downside with lower wicks but no impulsive bullish candles—suggesting that sellers are absorbing buy orders. A minor push higher into $220.80–$221.20 could occur to mitigate remaining imbalance before the next leg down toward $215–$214.
From a footprint analysis perspective, we’d expect to see heavy sell imbalances within the recent drop and limited buy delta absorption in the current consolidation, signaling that selling pressure remains dominant. A brief uptick in positive delta during any pullback would likely represent short covering rather than genuine buying strength.
Trade bias: bearish continuation. Expect price to react lower from the $220.80–$221.20 range and target the $215–$214 area next.
Invalidation level: a sustained break and close above $222.00, which would suggest a possible structural shift or deeper retracement toward higher supply at $224–$226.
Momentum: still favors sellers; buyers have yet to show a convincing recovery candle or delta flip.
$AMZN Tradespoon – Long Entry $227.74Tradespoon model generated long signal for NASDAQ:AMZN . Predicted range: $220.98–$229.14. Trend: +0.25%. NASDAQ:AMZN
