ASML LINE CHART STRATEGY AND STOCKS ASML Holding N.V. is a Dutch multinational corporation and the world's leading supplier of photolithography machines used by semiconductor manufacturers to produce integrated circuits, especially advanced chips for AI, smartphones, and computing.
Core Business Model
ASML designs, manufactures, and services highly complex lithography systems, primarily Extreme Ultraviolet (EUV) and Deep Ultraviolet (DUV) machines that etch nanoscale patterns onto silicon wafers. Revenue comes mainly from selling these multimillion-dollar systems (EUV units exceed $300 million each) to major chipmakers like TSMC, Samsung, and Intel, plus long-term service contracts and upgrades that generate recurring income.
Key Strengths
ASML holds a near-monopoly on EUV technology, essential for chips below 7nm, with no viable competitors due to decades of R&D investment and a global supply chain of over 5,000 suppliers. Its innovation pipeline, including High-NA EUV systems for sub-2nm nodes, drives sustained demand amid AI growth, supported by €38 billion order backlogs as of early 2025.
Top Customers
These three dominate ASML's sales due to their leadership in foundry and logic chips:
TSMC: Largest customer, fueling ASML's growth with massive EUV orders for AI chips like Nvidia's Blackwell.
Samsung: Key for memory and logic, using EUV for sub-7nm nodes amid AI demand.
Intel: Relies on ASML for 18A and future nodes, with significant EUV investments.
China-based firms (e.g., SMIC) represent 20-40% of recent sales but face export curbs, shifting focus to these top trio.
Chip Production Dependencies
ASML's EUV machines are essential for nodes below 7nm, used in 99% of advanced semiconductors:
TSMC: Needs EUV for 3nm/2nm processes powering Apple, AMD, and Nvidia GPUs.
Samsung: EUV critical for HBM memory and logic chips in AI servers.
Intel: High-NA EUV for sub-2nm to regain leadership.
Customer Key Dependencies Impact of ASML Tech
TSMC 3nm, 2nm logic/AI chips Enables 70%+ of global foundry output
Samsung HBM, 3nm DRAM/logic Powers AI memory without alternatives
Intel 18A (1.8nm), future nodes Critical for U.S. manufacturing resurgence
#ASML #STOCKS
ASML Holding NV
No trades
What traders are saying

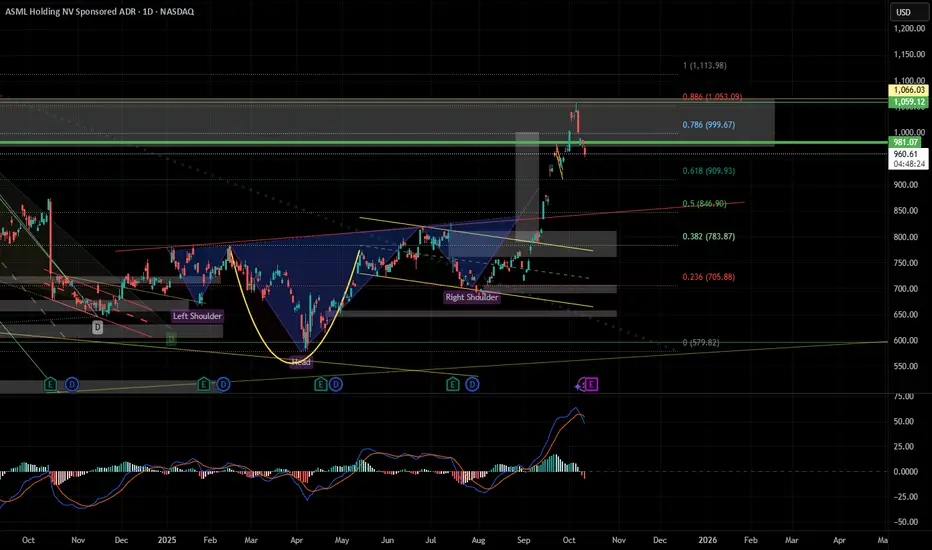
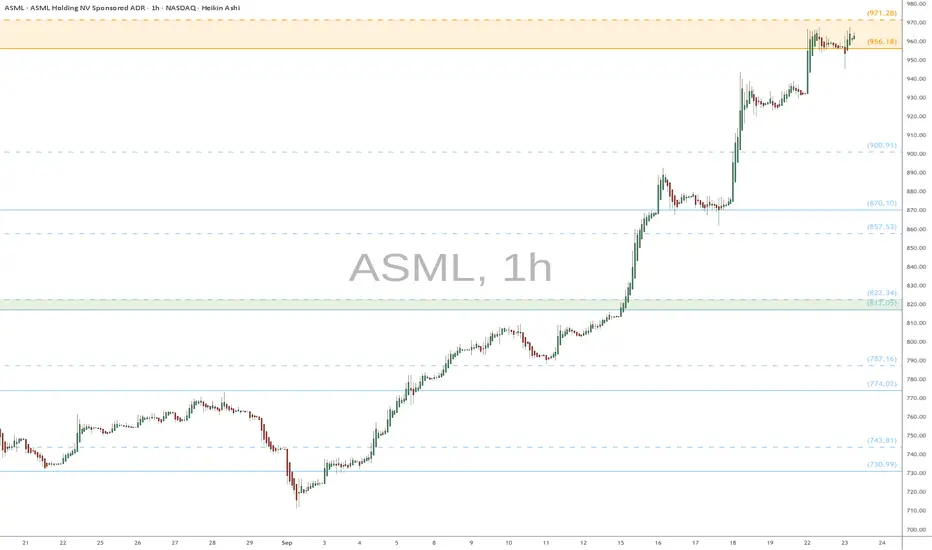
ASML watch $956-971: Double Golden fibs may give a DIP to buyASML has been growing in spurts along with the semi's.
It has just hit a Double-Goldden fib zone $956.18-971.28
Looking for a Dip-to-Fib or Break-n-Retest for long entries.
.
Previoius Analysis that nailed the EXACT BOTTOM:
Hit BOOST and FOLLOW for more such PRECISE and TIMELY charts.
========================================================
.
ASML Swing Trade: Katy AI & Analyst Upgrades Signal Momentum📊 ASML QuantSignals V4 Swing – 2026-02-03
💡 Core Thesis:
Analyst upgrades (RBC, Wells Fargo, Barclays) drive sentiment
Katy AI bullish vector → modest upside to ~$1,413–$1,486
Valuation premium-rich; social chatter muted
📈 Technicals:
Price: $1,396.60 > 50DMA: $1,183.82 > 200DMA: $913.87
VWAP: $1,436.08 → upside bias
RSI: 64.6 → Neutral/weak bull
Key Levels: Support $946.11 | Resistance $1,493.48
⚡ Tactical Game Plan:
Entry Zone: $1,390–$1,400 (limit order)
Target 1 (Scaling): $1,415 (+1.2%)
Target 2 (Runner): $1,486 (+6.4%)
Stop Loss: $1,380 (-1.2%)
Risk/Reward: ~3:1 (Target 1)
Execution: Buy limit order near $1,390–$1,400; add modest position if price breaks $1,415 on strong volume
🛡 Risk Architecture:
Risk Grade: Medium
Thesis Error: Close below $1,380 or downgrade by analysts
Tail Risk: Macro shock affecting tech sector

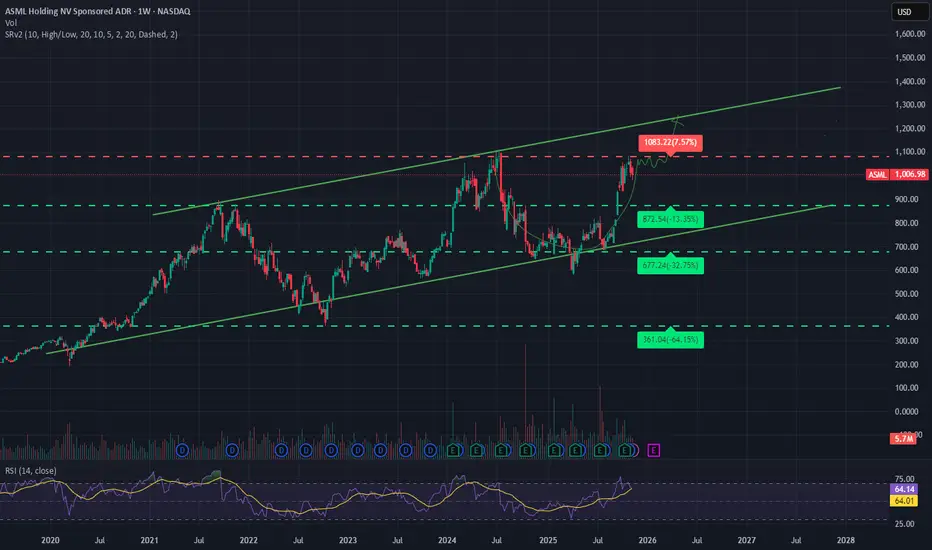
ASML Breakout - Bullish!ASML has just broken above its long-term rising channel, confirming a continuation of the primary uptrend.
This breakout suggests a trend acceleration, not exhaustion.
Based on the channel height and historical momentum, the minimum upside target is $1,815+.
As long as price holds above the former channel resistance, the bullish structure remains intact.

ASML: The One Company Powering the AI Chip BoomNASDAQ:ASML is not just another semiconductor stock. It is the backbone of the global chip industry. This Dutch company is the world’s only supplier of advanced EUV lithography machines, the critical tools used to make the most powerful AI and high-performance computing chips. If you want to build cutting-edge processors, you need ASML. There is no alternative.
Here is the surprising fact. Every single advanced AI chip from companies like Nvidia, AMD, Apple, or Intel depends on ASML’s machines. Without ASML, the AI revolution would simply slow down. That monopoly position is what makes this stock so special.
The stock has been strong over the past year as investors continue to price in the AI boom and record spending by chipmakers. After the Q3 earnings report, the stock jumped as management confirmed strong order demand and improving margins. ASML trades at a premium valuation, but investors are willing to pay for its unmatched technology and long-term growth story.
The biggest driving force is customer spending. TSMC, ASML’s largest customer, recently guided 2026 capital expenditure at around $52 to $56 billion , far above market expectations. Samsung and Intel are also investing aggressively. This means more chip factories, more machines, and more revenue for ASML.
Margins are another big story. Gross margins are expected to rise from around 52 percent in 2026 toward 56 to 60 percent by 2027 to 2030 as High-NA EUV systems enter mass production. These next-generation machines have no real competitor and cost hundreds of millions of euros each, giving ASML enormous pricing power.
Analysts have been upgrading the stock and raising price targets as confidence grows in the High-NA transition and long-term AI demand. Several large fund managers continue to increase exposure, calling ASML a core AI infrastructure play.
There are challenges. Export restrictions to China and short-term chip cycle slowdowns can create volatility. The stock is also expensive ( PE Ratio 46.98) compared to the broader market.
But the long-term picture remains very bullish. AI, data centers, 5G, electric vehicles, and smart devices all need more advanced chips. That means more EUV machines. Add a potential multi-million-euro share buyback in late 2026, and ASML looks positioned to stay one of the strongest compounders in the global tech market.
In simple terms, if AI keeps growing, ASML keeps winning.

ASML Keeps Progressing HigherASML has been bullish for most of the second half of 2025, and with the current strong push to new highs it looks like we are dealing with a new motive wave structure, now unfolding as wave five. But keep in mind that this is a final leg, and this wave could complete the higher degree structure. But for now, the trend still needs to complete five subwaves within wave five, which could allow price to extend higher, potentially toward the 1300 area, after a blue subwave four retracement as shown on the daily chart. The key level to watch is around 1110, which was also the high from July 2024. As long as price stays above that level, the uptrend remains intact. A push back below it would likely signal a temporary slowdown rather than a trend reversal.
Highlights
– ASML remains in a strong uptrend and is unfolding wave five
– Potential extension higher after a blue subwave four pullback
– Key support to watch is 1110
– A break below 1110 would signal temporary slowing, and enw correction ahead.

ASML, what are you trying to do?ASML is trading at interesting zone.
Two things could play out from here.
Concerning Points.
- PE stretched, median PE over the last 13 years has been 35.
- Has broken 10/20 day moving averages (daily).
- Several Gap up's on daily chart.
Positive points.
- AI play is still intact with strong demand.
- Dominant/only player.
- Zoom out to weekly chart, and you will see a cup and handle pattern forming.
Which leads me to believe that, it might consolidate here for some time, forming the handle.
followed by breakout.
ASML: Technically Strong Uptrend Supported by Excellent QualityNASDAQ:ASML ASML continues to exhibit a strong and well-defined uptrend, characterized by higher highs and higher lows, with price action firmly trading above both the 20- and 50-day EMAs. The EMAs are aligned in an orderly bullish structure, reinforcing positive trend strength and increasing bullish conviction. The current chart setup suggests a constructive retracement toward a key demand zone, where buyers may step in, presenting a favorable continuation opportunity within the broader uptrend.
Fundamentally, ASML remains a wide economic moat company and a critical enabler within the global semiconductor value chain. The company has delivered consistent growth in both revenue and EPS over the past five quarters. Profitability metrics are exceptional, with ROE at 52%, ROIC at 43%, and a stable net margin of approximately 28% over recent quarters. The balance sheet remains robust, supported by healthy liquidity with a current ratio of 1.3x and a very conservative debt-to-equity ratio of 0.14x, underscoring strong financial resilience and long-term investment quality. NASDAQ:ASML

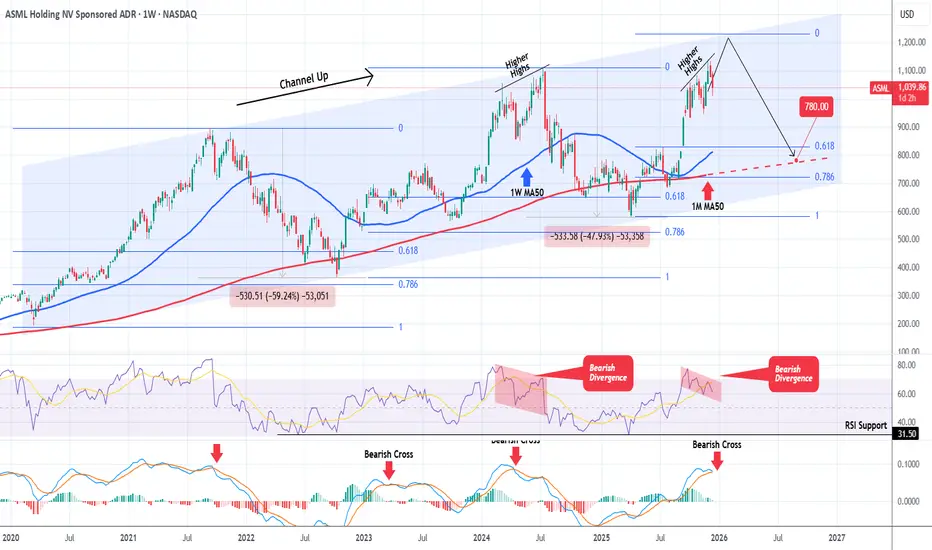
ASML is at or very close to its cyclical Top.ASML Holding (ASML) has been trading within a Channel Up since the March 2020 COVID Low and is currently approaching its Top. With the 1W RSI on a Bearish Divergence (Lower Highs against the price's Higher Highs) and the 1W MACD about to form a Bearish Cross, the stock doesn't have much room left to rise before peaking.
Assuming the maximum peak extension to be at 1235, and since both previous Bearish Legs declined to at least within the 0.618 - 0.786 Fibonacci Zone, we expect the price to drop to $780 (at least), which will also be a contact with the 1M MA50 (red trend-line).
---
** Please LIKE 👍, FOLLOW ✅, SHARE 🙌 and COMMENT ✍ if you enjoy this idea! Also share your ideas and charts in the comments section below! This is best way to keep it relevant, support us, keep the content here free and allow the idea to reach as many people as possible. **
---
💸💸💸💸💸💸
👇 👇 👇 👇 👇 👇
EASY SHORT TO $1000Failed auction of the all time highs. local range support also lost.
$1000 or even $950 next.
Calculate Your Risk/Reward so you don't lose more than 1% of your account per trade.
Every day the charts provide new information. You have to adjust or get REKT.
Love it or hate it, hit that thumbs up and share your thoughts below!
This is not financial advice. This is for educational purposes only.

ASML IDEAWe are currently sitting above the next significant demand zone. The current consolidation I suspect will draw in a lot of early buyers which can be wiped out by another bearish leg that will land us in the demand zone that we can buy from.

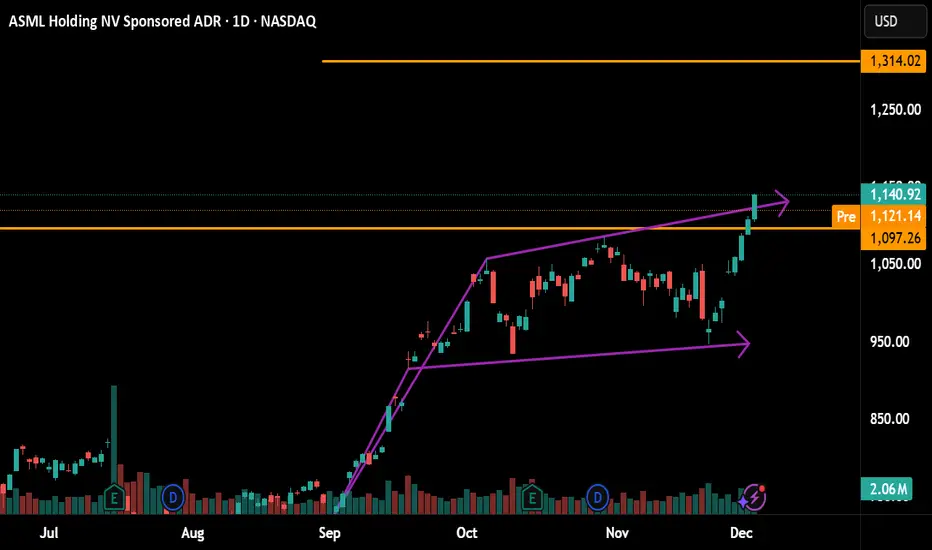
ASML : Flag Bullish Pattern activatedUpside Target 1314
cmp: 1140.92
SL: 929.
Risk Reward is not favorable so, decline is as strong opportunity 1000 around.
Manage Your Risk
Flag Bullish Pattern Breakout done
$ASML: Final Wave 5 Targets UnlockedNASDAQ:ASML has confirmed the end of the corrective Wave (4) on the daily chart and is powering through the initial phases of the final impulse move, Wave (5).
The price is currently challenging the key 0.5 Fibonacci level near $1,150, a critical resistance point. Sustained trading above this level signals high conviction for the Wave (5) continuation.
If the momentum holds, the primary targets for this final push are the 0.786 Fibonacci extension around $1,263 and the full 1.0 extension target around $1,350

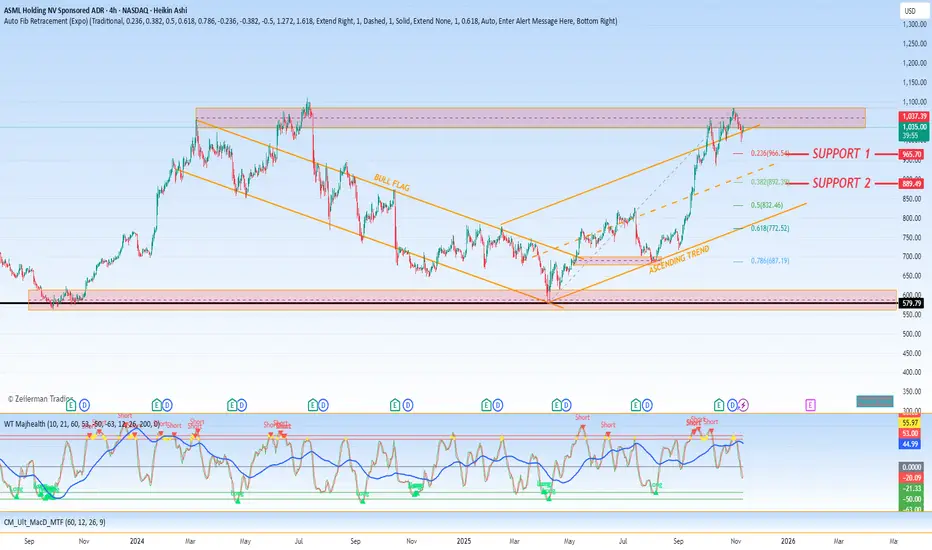
$ASMLExecutive Summary:
ASML ( NASDAQ:ASML ) is exhibiting a compelling technical picture defined by a period of consolidation within a larger bullish structure. The chart has formed a clear Double Top pattern followed by a Double Bottom, signaling a battle between buyers and sellers that has now resolved to the upside. This sequence, coupled with the recent formation and subsequent breakout from a Bull Flag pattern, indicates a resurgence of bullish momentum. Our analysis confirms a renewed upward trajectory, with key Fibonacci retracement levels at $966.54 and $892.39 established as critical support zones for any future pullbacks.
Detailed Technical Breakdown:
1. Pattern Evolution: From Consolidation to Breakout
The recent price action can be interpreted as a cohesive, multi-stage pattern signaling a healthy consolidation before a continuation of the primary uptrend:
Phase 1: Distribution & Testing (Double Top): The initial formation of a Double Top pattern near the highs represented a period of distribution and failed breakout attempts. This pattern indicated that selling pressure was sufficient to halt the advance at a specific resistance level, leading to a subsequent decline. In this context, it served as the distribution phase within the larger consolidation.
Phase 2: Accumulation & Base-Building (Double Bottom): The decline from the Double Top's neckline found firm support, forming a Double Bottom pattern. This is a classic reversal indicator, demonstrating that buyers were aggressively defending a specific price level and that the selling pressure from the Double Top had been exhausted. This pattern represented the successful test of a major support level and the accumulation phase.
Phase 3: Bull Flag & Momentum Renewal: Following the Double Bottom's confirmation, the price ascended into a Bull Flag pattern—a tight, downward-sloping consolidation characterized by declining volume. This pattern is typically a pause in a strong uptrend, reflecting a brief period of profit-taking before the next leg higher. The recent breakout above the flag's upper boundary signals the conclusion of this consolidation and the resumption of the dominant bullish trend.
2. Hierarchical Support Framework:
In the context of this renewed uptrend, the following Fibonacci retracement levels (derived from the most significant prior upward move) provide a structured roadmap for potential pullbacks, offering strategic entry points:
Primary Support (Shallow Pullback): 23.6% Level at $966.54
A retracement to this level would represent a minimal and healthy withdrawal within a strong trend. A bounce from this zone would signify potent underlying momentum and would be the most bullish of the potential pullback scenarios, suggesting a swift continuation toward higher highs.
Secondary & Major Support (Moderate Correction): 38.2% Level at $892.39
A deeper pullback to the $892.39 level would constitute a more significant test of buyer conviction. This level, known as the "shallow retracement," is a common area for institutional re-entry. While indicating greater near-term weakness than a test of the 23.6% level, a successful hold here would reaffirm the overall bullish structure and present a high-value opportunity for capital allocation.
3. Strategic Outlook and Price Projection:
The confluence of the Double Bottom reversal and the Bull Flag breakout provides a high-confidence bullish signal. The pattern's resolution suggests that the consolidation period has effectively recharged momentum for the next advance.
Implication: The path of least resistance is now firmly to the upside. The breakout from the Bull Flag projects a measured move target that is typically equivalent to the length of the preceding "flagpole," which points to a significant upward projection (a specific target can be calculated by adding the flagpole's height to the breakout point).
Strategy: The tactical approach is to view any pullback as a potential buying opportunity within the larger bullish trend. The identified Fibonacci levels at $966.54 and $892.39 serve as defined zones for strategic entry. A decisive break below the deeper $892 support, however, would necessitate a re-evaluation of the immediate bullish thesis, suggesting a broader correction may be underway.
ASML Holding | ASML | Long at $680.00NASDAQ:ASML Holding, a developer and servicer of advanced semiconductor equipment systems for chipmakers, dipped backed into my overall, long-term selected simple moving average (SMA). From here, stocks typically bounce or drop, but given the AI boom is far from "over", I anticipate another bounce to eventually close the gap near $1,060. It may show some minor weakness to close the gap in the low $600s and get the bears excited. But, unless the economy further shows major weakness in the semiconductor space, NASDAQ:ASML is in my personal "buy zone" at $680.
Target #1 = $730.00
Target #2 = $915.00
Target #3 = $1,060.00

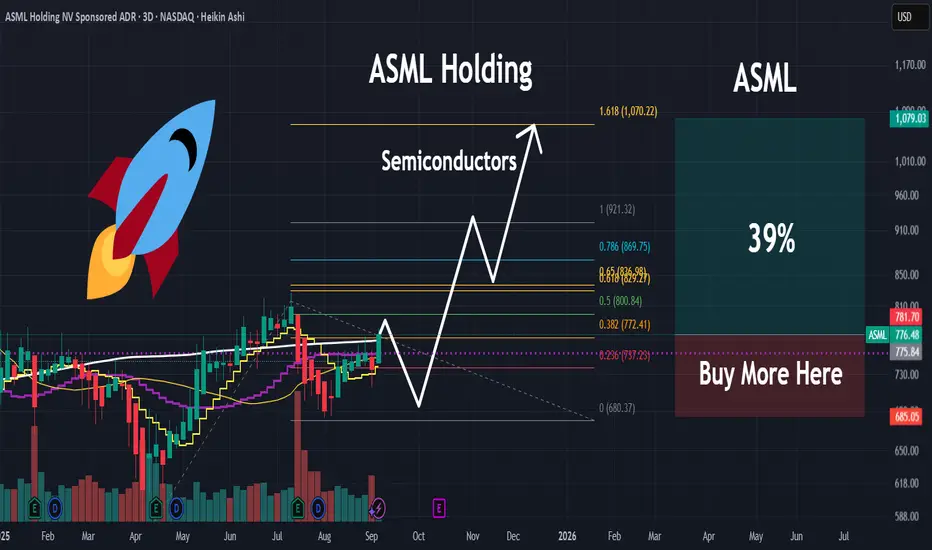
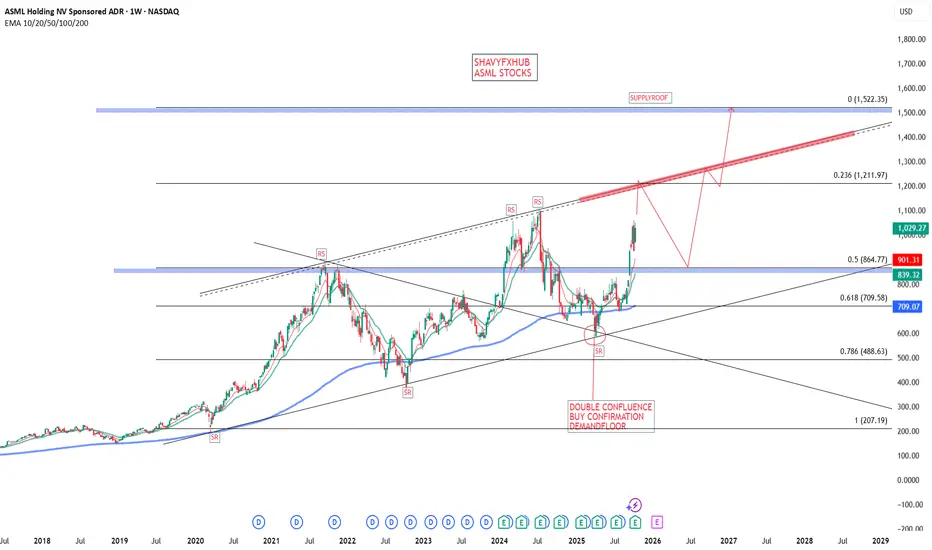
ASML | Something Is Brewing | SemiconductorsASML Holding NV engages in the development, production, marketing, sales, upgrading and servicing of advanced semiconductor equipment systems. It includes lithography, metrology and inspection systems. The company was founded on April 1, 1984 and is headquartered in Veldhoven, the Netherlands.
ASML
ASML is a Dutch multinational company specializing in advanced semiconductor manufacturing equipment, primarily known for its extreme ultraviolet (EUV) lithography machines essential for producing cutting-edge chips used in AI, smartphones, and computing.
Current Stock Price
As of October 18, 2025, ASML stock is trading around $1029.27.
KEY technical overviews from structure context
the rally started from 579.34 demand floor protected and currently closed at 1029.27 and a fall back retest into a broken supply roof will make 864.77 and an ideal position for any investor looking to go long on ASML STOCKS .the reward on this long could be surge exceeding 1211.97 and final take profit 1522.35 which all represent respective levels of supply roof and resistance to upswing.
the trade reasons are backed by the company monopoly in EUV SPACE .
The stock has shown a strong performance with a yearly return of approximately 38.35%.
Recent Financial Performance (Q3 2025)
Total net sales reached €7.5 billion with a gross margin of 51.6%.
Net income was reported at €2.1 billion, slightly beating market expectations.
Quarterly net bookings totaled €5.4 billion, with €3.6 billion attributed to EUV systems.
The company expects Q4 total net sales between €9.2 billion and €9.8 billion and a gross margin between 51% and 53%.
For full-year 2025, ASML projects about a 15% increase in total net sales compared to 2024.
Key Developments
ASML’s growth is driven by the increasing demand for semiconductor equipment, especially for AI and advanced computing chips.
The company has faced geopolitical challenges, including export restrictions affecting its China business, with expected sales declines in that market in 2026.
Despite these risks, ASML’s technological leadership in EUV lithography creates a near-monopoly, sustaining strong financial results and cash generation.
Market Capitalization
ASML’s market capitalization is approximately €345 billion (about $370 billion) as of October 2025, reflecting its industry dominance.
ASML remains a key player in semiconductor equipment with strong fundamentals, leveraging its EUV technology to meet rising global chip demand while navigating geopolitical risks.

ASML ASML is a Dutch multinational company specializing in advanced semiconductor manufacturing equipment, primarily known for its extreme ultraviolet (EUV) lithography machines essential for producing cutting-edge chips used in AI, smartphones, and computing.
Current Stock Price
As of October 18, 2025, ASML stock is trading around $1029.27.
KEY technical overviews from structure context
the rally started from 579.34 demand floor protected and currently closed at 1029.27 and a fall back retest into a broken supply roof will make 864.77 and an ideal position for any investor looking to go long on ASML STOCKS .the reward on this long could be surge exceeding 1211.97 and final take profit 1522.35 which all represent respective levels of supply roof and resistance to upswing.
the trade reasons are backed by the company monopoly in EUV SPACE .
The stock has shown a strong performance with a yearly return of approximately 38.35%.
Recent Financial Performance (Q3 2025)
Total net sales reached €7.5 billion with a gross margin of 51.6%.
Net income was reported at €2.1 billion, slightly beating market expectations.
Quarterly net bookings totaled €5.4 billion, with €3.6 billion attributed to EUV systems.
The company expects Q4 total net sales between €9.2 billion and €9.8 billion and a gross margin between 51% and 53%.
For full-year 2025, ASML projects about a 15% increase in total net sales compared to 2024.
Key Developments
ASML’s growth is driven by the increasing demand for semiconductor equipment, especially for AI and advanced computing chips.
The company has faced geopolitical challenges, including export restrictions affecting its China business, with expected sales declines in that market in 2026.
Despite these risks, ASML’s technological leadership in EUV lithography creates a near-monopoly, sustaining strong financial results and cash generation.
Market Capitalization
ASML’s market capitalization is approximately €345 billion (about $370 billion) as of October 2025, reflecting its industry dominance.
ASML remains a key player in semiconductor equipment with strong fundamentals, leveraging its EUV technology to meet rising global chip demand while navigating geopolitical risks.
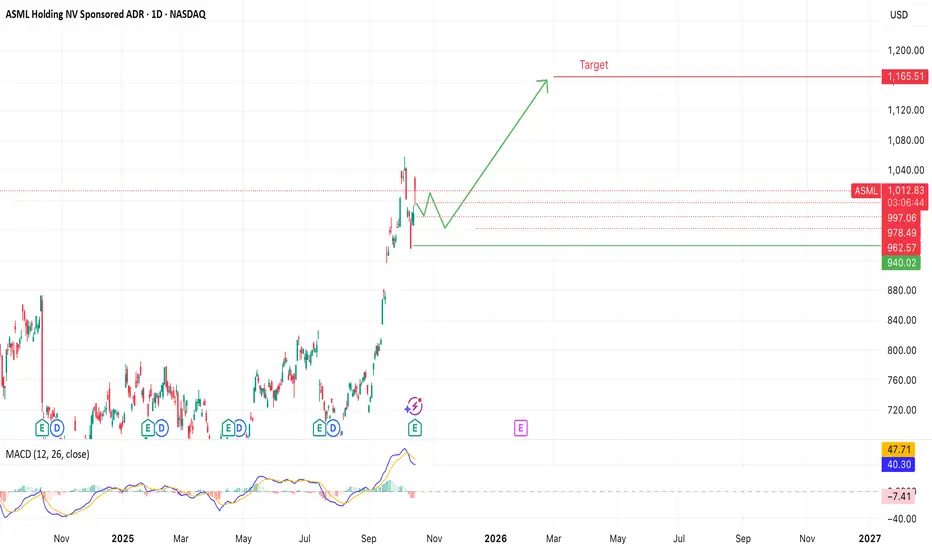
ASML — consolidation before the next move upAfter a strong earnings report (sales €7.5B, profit €2.1B, margin 51.6%), NASDAQ:ASML is consolidating above the $1,000 level — forming a potential base for the next leg higher.
Support: $960–980
Breakout confirmation: above $1,010
Target: $1,165 (+15%)
MACD remains bullish, suggesting momentum may soon resume.
If price holds above $1,000, the uptrend could continue toward the next profit-taking zone near $1,165
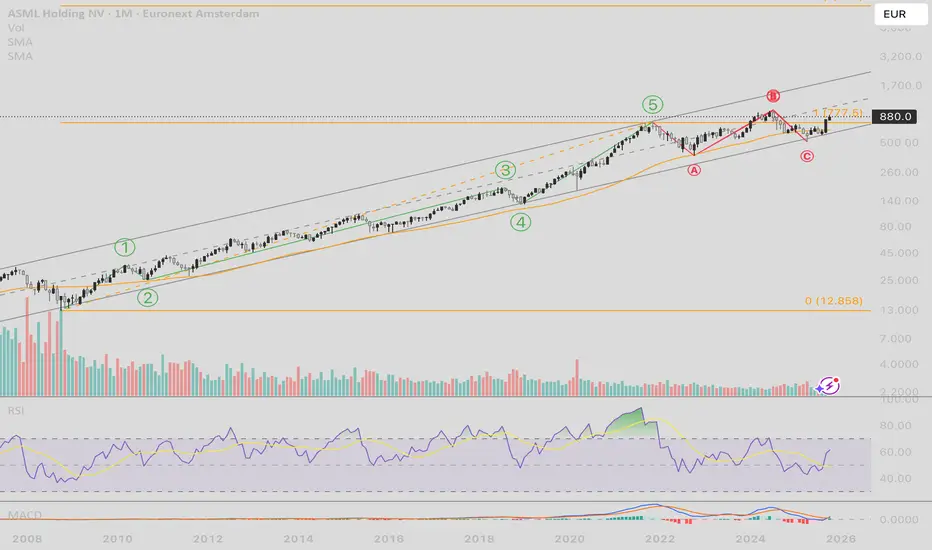
$ASML – Flat Correction Complete, New 5-Wave Cycle in ProgressNASDAQ:ASML – Flat Correction Complete, New 5-Wave Cycle in Progress
ASML appears to have completed a regular flat correction (A–B–C) between 2022 and 2024, retracing nearly all of the prior advance from the 2020–2021 highs.
The impulsive recovery from the €560 low suggests the next major motive wave sequence has begun.
Structure
Wave A: €777 → €400 (5-wave decline)
Wave B: retrace to ~€780 (≈95% of A)
Wave C: final low at ~€560 (5-wave form, RSI divergence)
This fits a 3–3–5 regular flat correction , marking the end of the prior cycle and the start of a new bullish phase.
Fibonacci Wave Targets and timeline estimate (approx.)
Wave 2: 0.382–0.618 retrace → €710–€640 , Q3–Q4 2025
Wave 3: 1.618 × Wave 1 → €1,150–€1,250 , Q1–Q4 2026
Wave 4: 0.236–0.382 retrace → €950–€1,000 , early 2027
Wave 5: 0.618–1.0 × Wave 1 → €1,300–€1,400 , mid 2028
If this count holds, the full impulse could unfold over roughly three years (2025–2028) , targeting the €1.2K–€1.4K zone at the upper boundary of the long-term channel.
ASML’s corrective phase appears complete. Holding above €640–€700 would confirm a sustained bullish cycle targeting new all-time highs in the coming years.
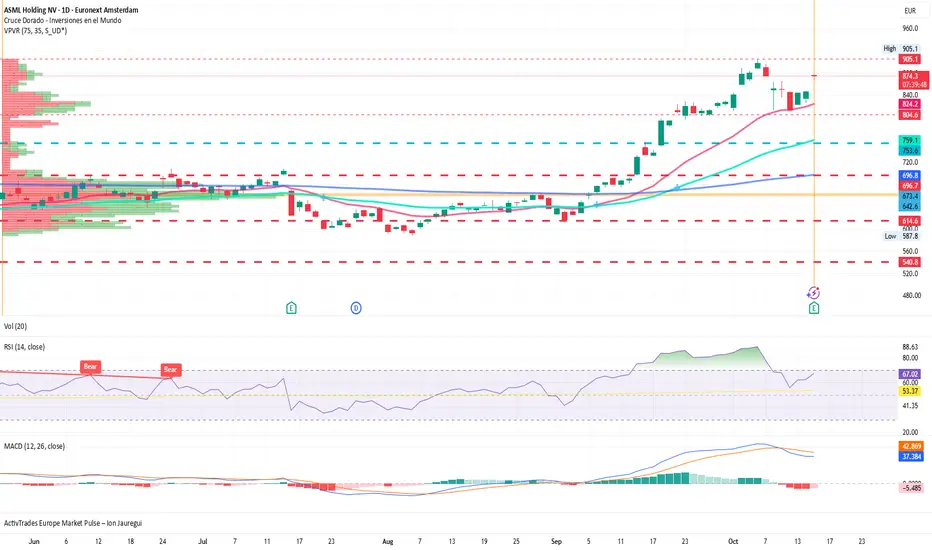
ASML Faces Technological and Geopolitical ChallengesASML Faces Technological and Geopolitical Challenges: A Giant Under Pressure
By Ion Jauregui – Analyst at ActivTrades
ASML Holding, the Dutch giant of advanced lithography, has reported solid quarterly results, confirming its role as a cornerstone in the global semiconductor industry. However, beyond the initial optimism, warning signs have emerged related to its exposure to the Chinese market and the growing European —including Spanish— interest in developing its own capabilities in this strategic sector.
Strong results, but with an Asian shadow
During the third quarter of 2025, ASML recorded net sales of €7.5 billion and a gross margin of 51.6%, figures that exceeded market expectations. The company projects an annual growth close to 15%, supported by the expansion of global demand for chips destined for artificial intelligence and data centers. Nevertheless, the company has warned of a significant decline in sales in China for 2026, a market that currently represents about a third of its new equipment revenue. Technological restrictions imposed by the United States and increasing geopolitical fragmentation threaten to affect the pace of orders in the region.
The European context and the race for technological autonomy
While ASML remains the undisputed leader in EUV lithography systems, Europe is accelerating its strategic autonomy agenda in semiconductors. Spain, in particular, is gaining ground in specific areas of the value chain. Startups such as Wooptix, specializing in advanced optical metrology, and national projects in Catalonia, Málaga, or Extremadura within the PERTE Chip initiative, demonstrate the country’s interest in positioning itself as a technological partner rather than a direct competitor. The development of advanced materials, such as synthetic diamonds for semiconductor use, aims to strengthen the European ecosystem without replicating ASML’s industrial model. For now, no Spanish company directly competes with ASML, but European investment momentum could open opportunities in complementary segments such as inspection, optics, and precision materials.
Technical Analysis (Ticker AT: ASML): Consolidation after highs
From a technical perspective, ASML shares are currently trading around €874 per share, remaining close to their historical highs of €905.1, driven by AI-related enthusiasm. The stock has shown a sustained upward trend since the beginning of the year, with key support around €804 and immediate resistance near €960. The RSI is in the overbought zone at 67.15%, indicating increased buying momentum at the start of the session. The MACD points to lateral movement, with the histogram in negative territory undergoing correction. Moving averages keep the price above the 50-day average, providing clear support for a new attempt to breach the highs.
A daily close above this resistance level could pave the way for new all-time highs, while a break below the support mentioned could trigger a consolidation phase toward €830. Volume remains stable, reflecting institutional confidence, though with signs of caution given the geopolitical scenario. ActivTrades Europe Market Pulse indicates a balanced market risk environment.
Still the King
ASML remains a global technological benchmark, essential for producing advanced chips. However, China’s weight in its revenues and international regulatory pressure could shape its growth path in 2026. Meanwhile, Europe —and Spain in particular— is seeking to gain ground in segments surrounding the Dutch colossus. More than a direct rivalry, what is emerging is an innovation network that could, in the medium term, diversify the European technological landscape.
*******************************************************************************************
The information provided does not constitute investment research. The material has not been prepared in accordance with the legal requirements designed to promote the independence of investment research and such should be considered a marketing communication.
All information has been prepared by ActivTrades ("AT"). The information does not contain a record of AT's prices, or an offer of or solicitation for a transaction in any financial instrument. No representation or warranty is given as to the accuracy or completeness of this information.
Any material provided does not have regard to the specific investment objective and financial situation of any person who may receive it. Past performance and forecasting are not a synonym of a reliable indicator of future performance. AT provides an execution-only service. Consequently, any person acting on the information provided does so at their own risk. Political risk is unpredictable. Central bank actions can vary. Platform tools do not guarantee success.
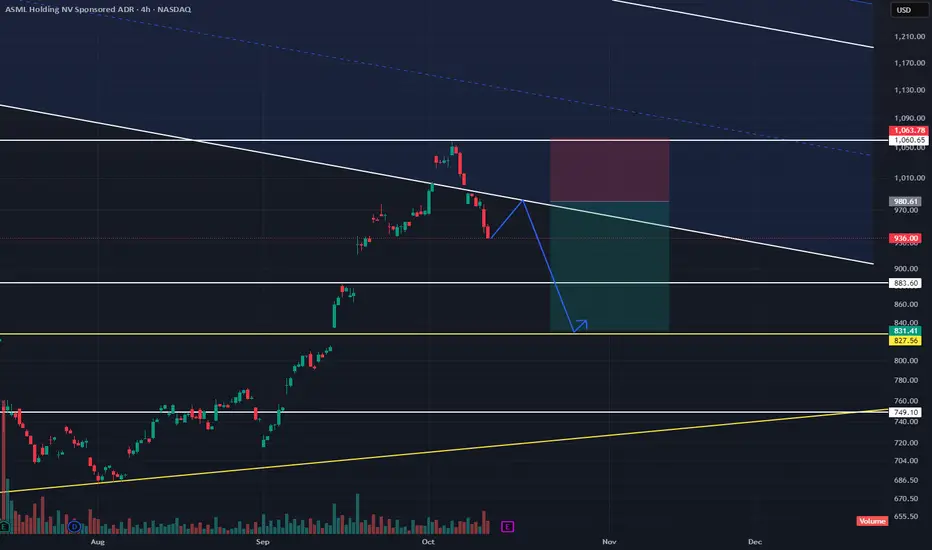
ASML SHORT 2X The price got rejected once again from the descending trendline resistance.
A short-term correction toward the 880–830 range seems likely.
This zone (highlighted in yellow) could act as a potential accumulation or reversal area.
If the 827 support holds, we might see a solid bounce from here.
However, a clear breakdown below this level could shift the entire structure.
📊 Stay alert — the next major move will be decided right here.
ASMLASML almost closed the gap...looks like it missed by some cents...but it hit the .886 fib level and should pull back to about 846 to close some gaps making it retrace 50% which is common