Comcast Corp - Short down trendFrom chart patters and technical analysis this stock has it's indicators RSI, MACD & Volume showing that price will be following a down trend to complete the 5 elliot impulse wave theory
*** This is not an investment advice***
Trade ideas

Head and Shoulders ShortHead and Shoulders Short position with close below Neckline.SL just above top of Head.Trading with the downtrend.TP 1 is the next Support level and TP 2 is the next Support level.

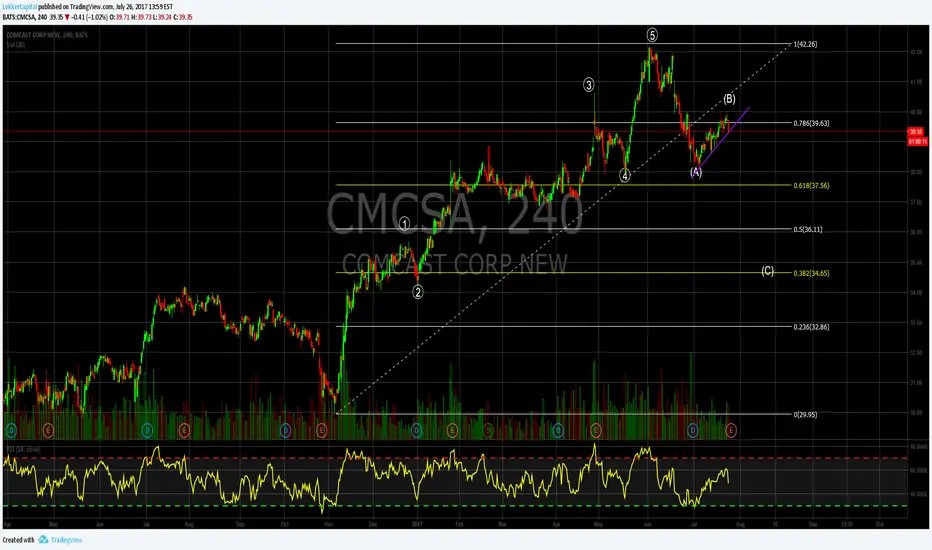
$CMCSA BULLISH CYPHERlooking at price action on comcast from the election in 2016 on the daily time frame. I have plotted a bullish cypher which price has obeyed pretty well. This is not the best of the patterns in terms of R/R, but thats why its our jobs as traders to understand that and position accordingly.
My game plan is to get long here under todays high if possible and position for a stop just below the November low. 1st target at 37 second, 2nd @ 40.

Some planning and a good time to buy Well It's that time now where we can sit back relax and get a good look at our charts. It's Bank holiday, end of 1st Q, end of the month, end of the week those bars are printed so we should be able to get a decent look at what may be going on.
For me firstly Iv'e just briefly been taking a look at the majors and volatility etf's to get an overall stand on the market. What i like here on the S&P500 We can see that in March we did not make a new low, held within February's range and just settling around the 12ema on the monthly and right around the 50ema on the weekly chart where we started to see a little bounce, particularly tech which was nice to see starting to bounce on Friday. So for now i don't think there's any reason to assume we are in a bear market yet. Noticed a few breadth indicator charts flying around too with notable lower spikes on recent selling than previous weeks.
S&P 500 MONTHLY VIEW
We didn't make a new high either but did test it so this could go sideways for a period of time, but we closed in the bottom of the range so for now i will assume we can enjoy a little bull run with many sectors and stocks oversold.
That being said, on to my scans not going to go into great detail. On this chart was just a simple scan looking for stocks where 5 period stochastic on the daily is below 30 oversold and on the weekly the 50ema is moving up smartly over a period of 20, Some might like to look for stocks over longer periods but for me i'm a short term swing trader i like to trade the now so i'm just looking for short term trades. All i'm doing then is analysing the charts on multi time frames looking at macd behaviours and momentum oscillators etc.
This one popped up right near the top of my list and straight away just looking across the board the time frames where falling in to place. What i also noticed without having to crunch numbers and go through financials was that this stock is a really nice growth stock just looking at that trend which has been strong and steadily growing along the way since 2010 when it was trading for under $10. This will have picked up many investors along the way. With that in mind this would be a perfect place for some investors to get involved again as it's the first visit to the 200 ema since this trend kicked into gear, Looks fairly cheap having dropped 25% since recent high, also at a monthly support level.

Dow drops once again #40 (CMCSA)Needless say. Wait for a pullback! around (34.90)
It's not my job to teach, I only mention it
Imagine that you are a Pro Trader and I'm telling you how to do your job
I am an Analyst and stock picker; I not a Trader and I do not have to remind you that, Wait for a pullback!

#CMCSA #stock #shortCMCSA is undergoing a long term trend change. The trend is changing from up to down. There is an opportunity to play the double top that has formed.
Monthly
Comcast has formed an eve and adam double top. All indicators are ponting down. This stuck is experiencing a trend change from an uptrend to a downtrend. There are two levels of resistance, one of which is in the near future. The first is at the $33. Should look to see if the stock cuts through that line quickly. The second is around $15. That is a long way down.
weekly
Here again, you can see the double top more clearly. All indictors pointing down. A formation with indicators changes on the monthly chart further suggest trend changes that will effect the lower time frame charts.
Daily
Double top is evident again. All indicators pointing down. There is an opportunity for an almost 2 RRR to play the double top. That being said, one should be patient.It will take time to complete. There are many possible areas of resistance price could bounce off of.

SHORT COMCAST $CMCSATrend - Bearish
Indicator - 52 Week Low
Chart - Weekly
Strategy - Ride the trend short and cover on the touch of a 26 week high or 52 week high depending on your profits.
Time Frame - Could take up to a year to cover.

Good reasons to believe that it is going downThis is an early call, very little information yet but I see quite clearly a descent to touch the area of 28.
I do not care so much in which angle it descends, it may or may not take time to cover his downtrend. However, it seems difficult to continue ascending without first having a short rest.
Touching the R & S zone could give it a boost to push him up again, but it would be difficult to see levels greater than 43.. seeing longer-term charts, the decline is quite marked.
Let's see how it develops.

DragonFly DojiCMCSA, Set buy stop order with other cancels other for target/stop, still learning. Stock is up trending and formed a bullish looking candle stick after some consolidation.
Buy Order: 37.25
Target: 38.50
Stop: 36.50
Time Frame: March 12th

CMCSA Bullish Gartley Bullish Gartley on the daily (the measurements on the pattern are not ideal, but we got bullish divergence and price bouncing off of a significant trendline.
*Bought some April $37.50 calls @ $1.08*

#CMCSA #short #bearish #hourlyCMCSA has formed a bear flag (thats a bull flag upside down). Indicators and trend on charts 15 minute thru daily are all bearish. Expect this one to execute over next day or two.
Please keep to your stop as I expect sometime today or early next week we will see a powerful swing higher in the indices. That rising tide will (even if temporarily) pull up many stock prices.

Too Fast Too GoodHi guys. Here's a high volume stock that showed a spectacular run recently. We also have a breakout. That being said I'm humbly seeing some potential weakness in the move. Not a short though but just an observation. Thank you for taking a look.

Comcast Idea 1 Buy order: 42.00
Sell: 42.75 1.8% gain
Stop: 41.50 - 1.2% loss
Duration: 3 business days.


CMCSA start of new waveCMCSA just completed 12345-ABC move and formed descending wedge. Looking for break and move higher


$CMCSA good entry for long term playLooking good, not a sexy stock but a long term value play. I started a small position with no stop. Will reevaluate prior to market close today.