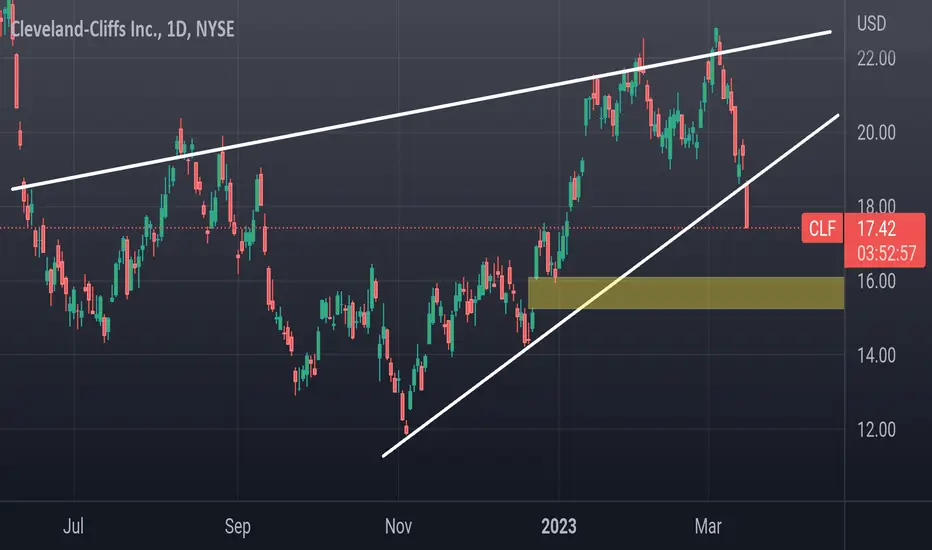
CLF lookin ready for another popIf Cliff fails here look for that gap fill around 12, but if 15 hold we're looking for 17.50 and 20
Trade ideas

CLF Falling Wedge Cleveland Cliffs $CLF looks primed to break out of it's falling wedge pattern. They are a Steel foundry. Up top is Iron and Steel price index, showing it's up and holding well. So that should help. CLF was a favorite on WSB last year and it was recently downgraded by Jim Cramer, so it has that going for it. Visibility at least, with this chart pattern could lead to some nice change on the breakout. POC first target, VAH second.

$CLF - to be prepared to be patientNYSE:CLF is a good industrial company with a long history and covers a full cycle of production.
Looks like it shows attempts to bounce of the historical bottom.
Would not like to analyze on the short time frames, cause I convinced, it will show awesome results, but only on the long period of time. This company is relevant for investors, who are ready to buy shares of the company with the stable business, just if it's in the bottom of the stocks market and being full of high level of patience with expectations for the amazing results.
It is clear, that trying to make some forecasts for so long time range - this is like shout to the aim, that you cannot see yet, but we can use a rules of tech analysis.
In this terms, I can predict 2 scenarios with 8-10 years of durability.
But before, I assume, this company should came from 16 to 8, approx in a year and after a slow and sustainable growth within 5-7 years it will have enough energy for the rocket show.
In scenario 1 potential is 8->48, +500%.
In scenario 2 potential is 8->80, +900%.
Honestly, I will not invest in this instrument due to this is not the industry, in which I'm interested in, but I would like to share a forecast for far away to check, either it will match or not with reality.
Mates, please, don't judge me for this peace of experiment ).
Does not constitute a recommendation
#investing #stocks #idea #forecast #furoreggs #experiment

CLF looks good on the daily and lots of bullish flowI expect a retest soon of that resistance on the daily

CLF downside to inverse H&SCLF price changes pushing to downside. looking at sell off to 15.85 and 14.60 for a potential inverse H&S


$CLF - Price go downI spik very best London
*Claps hands*
Price go down
*Claps hands*
Overvalued. About to post profits/losses, whatever, won't matter. Overvalued. I have a short position in CLF.


Cleveland-Cliffs Inc (Long)Cleveland-Cliffs Inc
Long
Entry at 21.30
Take Profit at 24.61 (15.54% profit from entry)
Stop loss at 19.52


8/24/22 CLFCleveland-Cliffs Inc. ( NYSE:CLF )
Sector: Non-Energy Minerals (Steel)
Current Price: $18.24
Breakout Price: $19.00
Buy Zone (Top/Bottom Range): $18.00-$16.00
Price Target: $21.50-$22.00 (1st), $24.00-$24.40 (2nd)
Estimated Duration to Target: 34-37d (1st), 60-65d (2nd)
Contract of Interest: $CLF 9/23/22 20c, $CLF 10/21/22
Trade price as of publish date: $0.54/contract, $1.05/contract

CLF | Long | 9.Aug.2022CLF | Long | 9.Aug.2022
In my opinion, there could be some bullish uptrend in commodity companies. I think CLF can clear Gap above

CLF and WTZ2 Cleveland may be another trading opportunity for some traders. I apply my favorite WTZ2 setup for competitive entry. Actually, the best entry is the opening price and stop should be placed at the gap but I have no time enough to monitor this stock; therefore, another entry is applied instead. Don't forget to calculate risk well before trigger your order. Enjoy!

Cleveland-Cliffs has overbought signal on my RSIBased on historical movement, the peak could occur anywhere in the larger red box. The final targets are in the green boxes. The pending bottom should occur within the larger green box as has been the historical case. Half of all movement has ended in the smaller green box. In this instance, the signal indicated SELL on May 27, 2022 with a closing price of 24.56.
If this instance is successful, that means the stock should decline to at least 24.42 which is the top of the larger green box. Three-quarters of all successful signals have the stock decline 2.961% from the signal closing price. This percentage is the top of the smaller green box. Half of all successful signals have the stock decline 6.296% which is the end point of the black dotted arrow. One-quarter of all successful signals have the stock decline 9.712% from the signal closing price which is the bottom of the smaller green box. The maximum decline on record would see a move to the bottom of the larger green box. These are the same concepts for the levels in the red boxes as well.
The ends/vertical sides of the boxes are determined in a similar fashion. The trough of the decline can occur as soon as the next trading bar after signal close, while the max decline occurs within the limit of study at 50 trading bars after the signal. A 0.4% decline must occur over the next 50 trading bars in order to be considered a success. Three-quarters of successful movement occur after at least 8 trading bars; half occur within 28 trading bars, and one-quarter require at least 46 trading bars.
The black dotted arrow represents median historical movement. Medians are a good metric, but they are just one of many I use when forecasting future movement.
As always, the stock could decline the very next bar after the signal without looking back (therefore the red boxes would not come into play) or the stock may never decline (and the green boxes may never come into play).

CLF pull back re entriesCLF pullback re entries
20% pullback to 27.5 for entry 1
ideal discount entry for long swing or hold @ 24-24.50 on VP & SD channel Support below VP gap

$CLF 30m$CLF 30 min inverse head and shoulders, bullish reversal. Previous highs for target once break out

where will CLF go next? 🦉 after a big rally it cannot decide where to go! waiting for a clear breakout from consolidation before taking my position here.

$CLF Great company but massively overboughtMy opinion on this stock is that its a great company in no doubt one of the greatest fields to be in 2022. But it is way to stretched at the current valuation and I can see the stock testing their support level at approximately 26.5$, the RSI currently is more than 75 points and the company normally trades at 50-55. I have opened a short position myself, let me know your thoughts on the company. As always that is not financial advise as I am just expressing my personal opinion so please do your research.


Short steel.. CLFTop of channel. Overbought on every indicator... 10% pullback expected .. 30$ puts 4/8

CLF Upward ContinuationThis same formation/pattern can be seen to repeat (in green)
Each drop is followed by an equal or greater rise
Assuming it continues the rise should be equal to the drop point so where I have placed the bars pattern

Stocks To Watch This WeekMany names are holding up well in this market. Get a pen and paper because I go quickly and make the trade your own.. These names have shown good relative strength and accumulation volume and most are in the growth sector. This may give good risk/reward entries on some of the best names. Some of these charts still need to confirm their price action. This video is my watchlist. Most of these names are at or near all time highs or multi year highs. There are 23 total stocks on this list Many of these have IPO'd in the last few years and still have a growth story ahead of them. Know your time frame and risk tolerance. Know your earnings dates! I go through these quickly so grab a pencil and paper and jot down the names that look interesting to you and then make the trade your own. Good Luck!
