Live Trade on Morgan Stanley (MS)Live Trade on Morgan Stanley NYSE:MS
The price has entered the demand zone and has shown an excellent reaction to it. Additionally, with confirmation from one of our proprietary trading systems, a buy signal has been issued targeting the specified levels.
Follow proper risk and money management.
This is just my personal view, so please trade based on your own strategy and trading system.
Follow me on TradingView for more analyses and live stock trades.
Morgan Stanley
No trades
What traders are saying

MS Earnings Play: Buy the Dip Before the Gap-Up!MS Earnings Signal | 2026-01-14
Direction: BUY CALLS
Confidence: 78% (High)
Trend: Short-term bullish
Expiry: Jan 16 (2 days)
Earnings Date: Jan 15, 2026
📌 Key Levels
Strike: $177.50 Call
Entry: ~$4.90
Target 1: $7.35 (+50%)
Target 2: $9.80 (+100%)
Stop Loss: $3.43 (-30%)
Position Size: 5% of portfolio
Katy AI predicts a rise from $179.84 → $185–186 into and after earnings
Momentum is strong after a minor -1.59% dip → optimal “buy the dip”
Support around $178, resistance near $181
Positive fundamentals: 100% historical beat rate, strong capital markets performance
PCR 0.79 → institutional bias favors calls
⚠️ Risks
Medium risk due to IV Crush post-earnings
Rising VIX (15.94) → market volatility
Pre-market monitoring required for gap-up

MS Pullback Finds Demand as Bullish Trend Remains IntactMS is currently in a pullback phase, where the formation of a bullish candlestick pattern signals emerging demand. The stock continues to structure higher highs and higher lows, while the 20-, 50-day EMAs are aligned to the upside, with price trading above them. This alignment reinforces the presence of strong bullish momentum despite the near-term consolidation.
Morgan Stanley operates as a globa NYSE:MS l financial services firm, providing investment banking, wealth management, and investment management services to corporations, governments, institutions, and individuals. Its operations are organized across Institutional Securities, Wealth Management, and Investment Management segments.
Fundamentally, MS is a wide economic moat company with a market capitalization of approximately $296.1 billion. The firm has delivered consistent growth in both revenue and EPS over the past four quarters. Profitability has remained stable, with ROE above 13%, ROIC above 3%, and net margins exceeding 5% over the last five quarters. The balance sheet is solid, supported by a current ratio above 1x and a debt-to-equity ratio of about 3.9x, reflecting the capital-intensive nature of large financial institutions while remaining within manageable levels.

Morgan Stanley ETF Platform Hits $10B as Stock Holds BullishMorgan Stanley (NYSE: MS) continues to strengthen its asset management footprint after its Investment Management division (MSIM) announced that its ETF platform has surpassed $10 billion in assets under management. Launched in 2023, the platform has expanded rapidly from six strategies to 18 ETFs, spanning active fixed income, responsible investing, and derivative income solutions.
The milestone highlights growing investor demand for transparent, tax-efficient, and actively managed ETF products, particularly from established global firms.
From a fundamental perspective, the growth of MSIM’s ETF platform is strategically important. ETFs provide scalable, recurring fee-based revenue and deepen client relationships across both institutional and retail channels. With Eaton Vance, Calvert, and Parametric strategies under one umbrella, Morgan Stanley is leveraging its broad investment expertise to compete in a fast-growing segment traditionally dominated by passive players.
As market volatility persists and investors seek diversified income and hedging solutions, MS’s expanding ETF lineup positions the firm for long-term asset growth and earnings stability. This also complements Morgan Stanley’s broader wealth and investment management strategy, which remains a core earnings driver.
Technical Analysis:
The chart shows Morgan Stanley in a clear long-term uptrend, with price trading well above its 50-, 100-, and 200-day moving averages. The stock recently pushed to fresh highs near the $180 area before a modest pullback, suggesting profit-taking rather than trend exhaustion. Former resistance around the $145–$150 zone has flipped into a strong support region, aligning with the rising 50-day moving average.
Momentum remains constructive, and as long as price holds above this support band, the bullish structure stays intact. A consolidation above support could set the stage for another continuation leg higher, while a deeper pullback toward the 100-day average would still be technically healthy within the broader trend.

$MS Tradespoon Output — Neutral → Turning Bullish SetupTradespoon model shows a neutral signal for NYSE:MS with a slight upside bias. Predicted range: $171.65–$177.28. Short-term vector: –0.21%. Probability of reaching the low/high range is 77%, with a 55% chance of positive change. NYSE:MS

Morgan Stanley (NYSE: $MS) Stock Rises Despite €101M FineMorgan Stanley (NYSE: NYSE:MS ) is gaining momentum in the market despite facing a €101 million fine from the Dutch Public Prosecutor’s Office over historical tax practices. The penalty involves dividend tax evasion tied to structured transactions executed between 2007 and 2012. Authorities stated that the bank filed incorrect returns as part of share acquisition strategies around dividend dates. Morgan Stanley accepted responsibility, repaid withheld taxes and interest by the end of 2024, and agreed to the settlement, closing the long-running case.
Despite regulatory scrutiny, Morgan Stanley continues expanding its presence in digital assets as major financial institutions deepen their crypto offerings. JPMorgan is preparing to accept Bitcoin and Ether as collateral for institutional loans by year-end, marking a significant shift toward wider blockchain integration in traditional finance. The bank already allows collateralization using crypto-linked ETFs, signaling rising comfort with token-backed financial products.
Broad adoption is accelerating as more banks commit to serving the growing digital asset market. Morgan Stanley plans to enable E*Trade clients to access cryptocurrencies next year, strengthening its strategic position as demand increases. Other major institutions—including State Street, BNY Mellon, Fidelity, and BlackRock—remain active through custody services, tokenization initiatives, and ETF support. Increasing regulatory clarity in the U.S. has encouraged firms to expand beyond basic crypto custody and move toward trading, advisory, and collateral services.
While the sector continues facing compliance challenges, investor appetite for blockchain-linked products is rising. Morgan Stanley’s stock has maintained positive momentum as investors look beyond penalties and focus on its growing role in digital finance.
Technical Outlook
The stock maintains an overall bullish structure, having broken above a key horizontal resistance at $141, which now acts as support. If price retraces, $141 remains the critical level to watch.

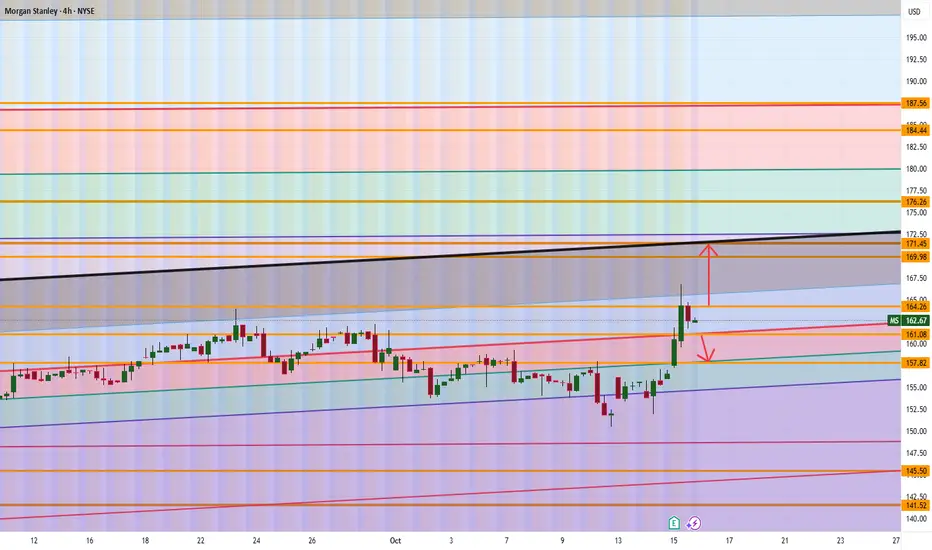
Morgan Stanley (MS) Simple Market Breakdown!MS is sitting at an important level right now; it’s getting ready to make its next big move 📊
Here’s what I’m watching:
📈 If we can close above 164.26, the next push could take us up toward 169–171 before hitting any major resistance.
📉 But if we drop below 161, then a move down toward 157.80 makes sense as the next target zone.
💡 In short: it’s all about which side breaks first; above 164.26 = bullish move 🔼, below 161 = bearish pressure 🔽.
Want to see how I’m planning around these levels and what confirmations I’m looking for before entering a position?
💬 DM me “MS” and I’ll share my full chart setup directly.
Mindbloome Exchange
Trade Smarter Live Better
Earnings Season Kicks Off with Strong Bank ResultsEarnings Season Kicks Off with Strong Bank Results
On 3 October, we noted growing optimism in equity markets ahead of the corporate earnings season. That sentiment was validated yesterday as several major banks reported results that exceeded analysts’ expectations, helping the S&P 500 index (US SPX 500 mini on FXOpen) rebound from last Friday’s sell-off.
Morgan Stanley (MS) led the rally, with its shares hitting a new all-time high above $166 following a robust quarterly report:
→ Revenue surged to a record $18.2 billion, up 18% year-on-year.
→ Earnings per share (EPS): actual $2.80, vs forecast $2.10.
Technical Analysis of Morgan Stanley (MS)
Price action in MS shares allows for the construction of an upward channel (shown in blue) that has been forming since the summer.
→ Yesterday, a wide bullish gap appeared on the chart.
→ The price advanced into the upper half of the channel, breaking above the $160 psychological level.
From a bullish perspective:
→ The breakout from a bullish flag pattern supports the scenario of a resumed uptrend within the channel.
→ The channel median, reinforced by the $160 support, could serve as a key level going forward.
However, there are several bearish signals to note:
→ Intraday price swings formed a wide up-and-down movement, resembling a bearish engulfing pattern that could develop further in today’s session.
→ The brief and shallow breakout above the previous high suggests a bull trap.
The RSI indicator also shows signs of bearish divergence, implying that:
→ The recent surge in MS shares may have prompted some long holders to lock in profits near record highs.
→ Despite strong fundamentals supporting long-term growth, the stock could be vulnerable to a short-term correction, potentially towards the bullish gap area.
This article represents the opinion of the Companies operating under the FXOpen brand only. It is not to be construed as an offer, solicitation, or recommendation with respect to products and services provided by the Companies operating under the FXOpen brand, nor is it to be considered financial advice.

MS eyes on $166.13: Genesis fib may give DIP to buy the SURGEMS got a massive bump up from earnings report.
It has just smacked into a Genesis fib at $166.13
Look for a Dip-to-Fib ($162.19) or Break-n-Retest.
.
Previous Trade that caught a PERFECT BREAKOUT
Which gave us a 22% gain:
.
Hit BOOST and FOLLOW for more such PRECISE and TIMELY charts.
=========================================================
.

Pullback in Morgan StanleyMorgan Stanley recently hit a new high, and now it’s pulled back.
The first pattern on today’s chart is the advance between September 5 and September 23. MS retraced half that move before bouncing, which may confirm its direction remains to the upside.
Second, prices held the rising 21-day exponential moving average (EMA). The 8-day EMA has also stayed above the 21-day EMA. Those signals may be consistent with an uptrend.
Third, Wilder’s Relative Strength Index (RSI) peaked above 76 before dipping toward 50. That may suggest the financial stock worked off an overbought condition and has returned to areas where dip-buyers may feel more comfortable.
Finally, some traders may view the recent pullback as a completed ABC correction, with the potential for the longer-term uptrend to resume.
TradeStation has, for decades, advanced the trading industry, providing access to stocks, options and futures. If you're born to trade, we could be for you. See our Overview for more.
Past performance, whether actual or indicated by historical tests of strategies, is no guarantee of future performance or success. There is a possibility that you may sustain a loss equal to or greater than your entire investment regardless of which asset class you trade (equities, options or futures); therefore, you should not invest or risk money that you cannot afford to lose. Online trading is not suitable for all investors. View the document titled Characteristics and Risks of Standardized Options at www.TradeStation.com . Before trading any asset class, customers must read the relevant risk disclosure statements on www.TradeStation.com . System access and trade placement and execution may be delayed or fail due to market volatility and volume, quote delays, system and software errors, Internet traffic, outages and other factors.
Securities and futures trading is offered to self-directed customers by TradeStation Securities, Inc., a broker-dealer registered with the Securities and Exchange Commission and a futures commission merchant licensed with the Commodity Futures Trading Commission). TradeStation Securities is a member of the Financial Industry Regulatory Authority, the National Futures Association, and a number of exchanges.
TradeStation Securities, Inc. and TradeStation Technologies, Inc. are each wholly owned subsidiaries of TradeStation Group, Inc., both operating, and providing products and services, under the TradeStation brand and trademark. When applying for, or purchasing, accounts, subscriptions, products and services, it is important that you know which company you will be dealing with. Visit www.TradeStation.com for further important information explaining what this means.

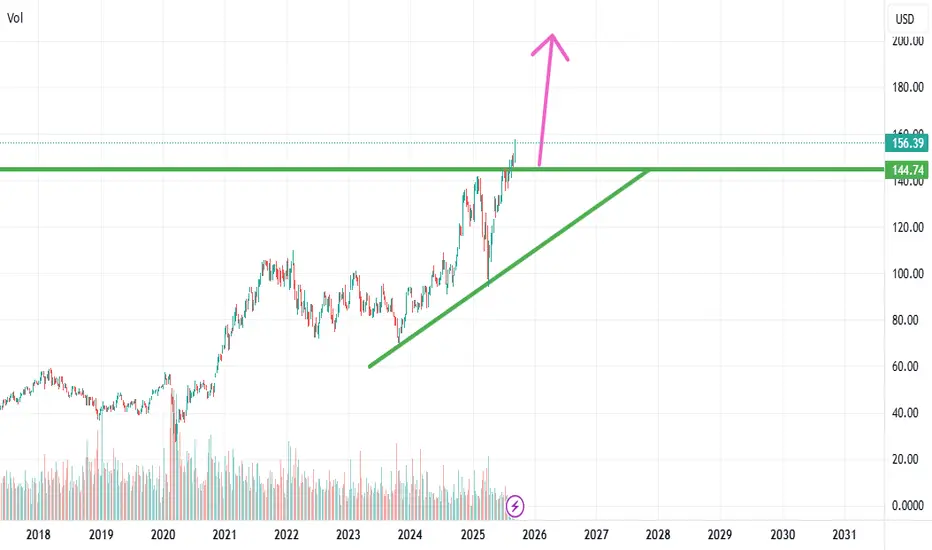
MS BUY OPPORTUNITY MS breaks weekly ascending triangle, signaling bullish continuation. Strong Q2 earnings and positive deal outlook support the move.
Price target 200
$MS Tradespoon - Long Entry $150.48Tradespoon model generated long signal for NYSE:MS . Predicted range: $148.96–$151.40. Trend: +0.06%. NYSE:MS

WATCHLIST FOR 8/11/2025 - 8/15/2025 - $SPY, $QQQ, $SMH, $HOODThis video explains why I'm bullish on spy, qqq, and several other tickers!

A potential break and retest on MS.OptionsMastery:
🔉Sound on!🔉
📣Make sure to watch fullscreen!📣
Thank you as always for watching my videos. I hope that you learned something very educational! Please feel free to like, share, and comment on this post. Remember only risk what you are willing to lose. Trading is very risky but it can change your life!

MS eyes on $119: Major Resistance may End Bounce or Strong BullMS recovering well from the tariff tantrum.
About to test a major resistance $119.08-119.20
Break would show strong bull, but dip more likely.
===========================================
.

Morgan Stanley: Post-Earnings Reaction & Technical SetupToday, NYSE:MS released strong earnings:
🔹 $2.13 EPS vs. expected $1.98
🔹 Revenue: $16.8B, including:
— +23% in equity trading
— +9% in fixed income
— $59B inflows into Wealth Management
Despite the beat, the stock dropped nearly 4%, signaling possible profit-taking after a 30%+ rally year-to-date.
Technical View
The price broke below the middle line of the Bollinger Bands, heading toward the lower band.
The Stochastic RSI turned sharply lower, confirming downside momentum.
Volume on the decline is above average — a bearish sign.
🟦 Key support lies around $130–131, a zone to watch for a potential bounce.
🟥 A breakdown below it could open the way to $127–128.
The market may have priced in the strong results ahead of time, leading to a sell-the-news reaction.
We now see a potential correction toward the $131 area — where buyers might step in.

MS Triple top "SELL" Short opportunityMS has been in a strong uptrend since April 7th 2025. Daily RSI is at 75 and is a great short opportunity near $139. MS has seen a 49% increase in 2.5 months from $94 to $140.
Target 1 on short would be a retest of previous high of $134 / stop would be anything over $141.50

Morgan Stanley (NYSE: MS) Reports Strong Q125 ResultsMorgan Stanley (NYSE: NYSE:MS ) Beats Q1 estimates with record Equity Trading Revenue. The bank posted earnings per share (EPS) of $2.60, beating analyst expectations of $2.18. Revenue reached a record $17.74 billion, topping forecasts of $16.44 billion.
The bank's equity trading revenue soared 45% year-over-year. It reached a new high of $4.13 billion as growth came across business lines and regions. Asia showed particularly strong performance. Prime brokerage and derivatives led gains, fueled by high client activity in volatile markets.
Morgan Stanley shares dropped 1% after the earnings release. However, the stock remains up over 20% in the past year. Volatility in global markets helped trading desks outperform.
Technical Analysis
Morgan Stanley bounced sharply from the $95 support zone. Buyers stepped in near the previous breakout level. Volume increased and confirmed renewed interest. This was seen as Trump paused tariffs for the next 90 days as well. Current price action suggests a recovery trend. The RSI stands at 39, hinting at oversold conditions. A potential path points to $142.03, which acts as the immediate resistance level.
If the price breaks $113 cleanly, momentum could carry it to $130 and beyond. If it fails, it is most likely to retest $95 support level. A strong break above recent highs would confirm bullish continuation. For now, Watch out the $113 and $142 levels closely.

Down by $90, then by $170I am waiting for a downward movement of $ 90, then $ 170. The cycle of 5 waves ends there starting in 2020.

Playing off the potential false breakout?Morgan Stanley's chart is at a critical juncture. After a slide in a descending channel, it briefly poked its head above, but that breakout looks shaky! Now it's dancing around the $115 support zone. A solid hold here, and we might see a bounce. But if that support caves? Watch out for further downside. Is MS about to regain its footing, or is this just a pit stop on the way down? What's your call? Share your predictions!

$MS Tradespoon - Long Entry $119.20Tradespoon model generated long signal for Morgan Stanley ( NYSE:MS ). Predicted range: $119.20–$123.87. Trend: +1.47%. NYSE:MS

Morgan Stanley Correction. MSOur last take on MS was dead on and quite profitable. The idea will be linked to this one. ABC zigzag, now impulsing down in C wave. Indicator below are bearish but quite choppy, making meaningful interpretation difficult. Price action, MIDAS cross and behavior of vWAP/US duo are key factors in this decision making.

The Last Step Of The 3 Step System ExplainedLook at this chart what do you see?
Yesterday I felt happy because for the first
time even if am broke I get to see the
light of a negative situation
to be esteemed is more important
than gold and silver.
Sometimes all you need is to be
Motivated so that no matter what you
are going through in your life
you can learn and understand what you are trying to
achieve
I enjoy taking walks because it gives
me a chance to think about
my shortcomings and strategies even more
Look below this chart NYSE:MS you
will see the cross-over on the Stochastic RSI
this is a sign that this price action is going
to go up
Just like the last step of the rocket booster
strategy to learn more rocket boost this content.
Check out the references below
to learn more about this 3-step system.
Disclaimer: Trading is risky you will lose money
whether you like it or not please learn risk
management and profit-taking strategies.
Also, feel free to use a simulation trading account.
