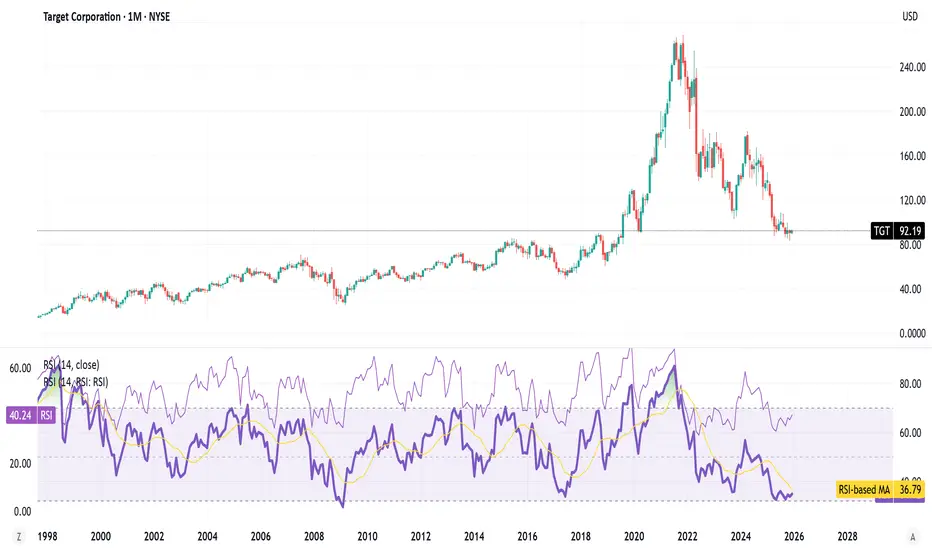
TGT Should be in our "Watch " list. Trough in "Progress"RSI, a momentum indicator in technical analysis measuring speed/magnitude of price changes (overbought >70, oversold <30).
Target Corporation
No trades
Trade ideas
$TGT Weekly Target $quezeWeekly is squeezing tight, looking for a possible momentum shift as its been very quiet and low volume compare to just a few years ago. Targeting $110-$130 in the short-term.

$TGT - Target - Pre-Covid Price LevelsTarget is down 67% from its all time highs.
Not sure how much more of a beating this stock price can take before value catches up.
Intrinsic Value calculations put this stock 40-60% undervalued. Some analysts suggest caution as sales declined around 2.7% in Quarter 3 and showed a higher operating margin of approximately 3.8% compared to previous years. We still don't think that's worthy of a 67% decline in the stock price as the stock is at Pre-Covid Levels.
The discount between current price and fair value is meaningful, so there is room for a strong move if positive catalysts hit such as better than expected holiday sales, a margin improvement, etc.
Disclaimer:
I do not provide personal investment advice and I am not a qualified licensed investment advisor. I am an amateur investor.
All information found here, including any ideas, opinions, views, predictions, forecasts, commentaries, suggestions, or stock picks, expressed or implied herein, are for informational, entertainment or educational purposes only and should not be construed as personal investment advice. While the information provided is believed to be accurate, it may include errors or inaccuracies. I will not and cannot be held liable for any actions you take as a result of anything you read here.
Conduct your own due diligence, or consult a licensed financial advisor or broker before making any and all investment decisions. Any investments, trades, speculations, or decisions made on the basis of any information found on here, expressed or implied herein, are committed at your own risk, financial or otherwise.
Feel free to give us a follow and shoot us a like for more analysis updates

TGT QuantSignals V3 — Earnings Downside Alert TGT QuantSignals V3 Earnings 2025-11-18
Direction: BUY PUTS
Confidence: 65%
Expiry: 2025-11-21 (3 days)
Strike Focus: $86.00
Entry Range: $2.59
Target 1: $5.08
Stop Loss: $1.52
Implied Move: $8.62 (9.6%)
24h Move: -0.53%
Options Flow: Bearish (High P/C Ratio) | PCR 1.76
Earnings Date: 2025-11-19 | Estimate: $1.74
Risk Level: Moderate-High | Tight risk management advised
Technical Notes:
Near 52-week lows
RSI 37.1 (approaching oversold)
MACD negative (-0.1463)
Support: $87.62 | Resistance: $90.64
News Sentiment: Bearish — competitive pressures, consumer weakness
Position Size: 2% of portfolio (reduced due to Katy conflict)
Summary:
High implied volatility + historical earnings miss pattern → bearish setup. Katy AI shows neutral, but composite signals + options flow + technicals justify a put trade. Use small size and tight stop.
TGT Bullish Divergence Weekly MACD-H and EFIBullish divergence on MACD-H, MACD lines, EFI, ATR channel divergence, even divergence on Stochastic RSI.
TP
100.51
E
90.8
SL
84.46
Trade #00015

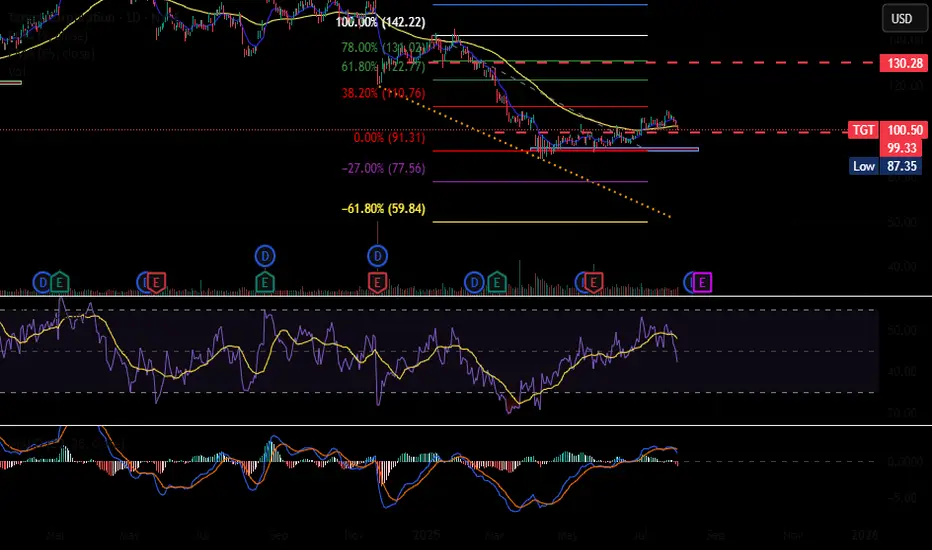
TGT 1D - hitting the target?On the daily chart, Target Corporation (TGT) has finally broken out of its long downtrend and closed above the consolidation box. The setup suggests a potential bullish reversal with targets at $123 and $146.8.
Technically , the structure looks solid: a possible retest of the breakout zone could offer a great mid-term entry. Volume supports the move, and RSI is recovering from oversold levels.
On the fundamental side, Target is regaining investor confidence. The company is expanding its digital sales, strengthening brand partnerships, and improving supply-chain efficiency. Rising margins and better inventory management hint that profits may start to recover - just in time for the holiday season.
Tactical plan: as long as price holds above $94, bulls have control. The next target? Well… Target itself.

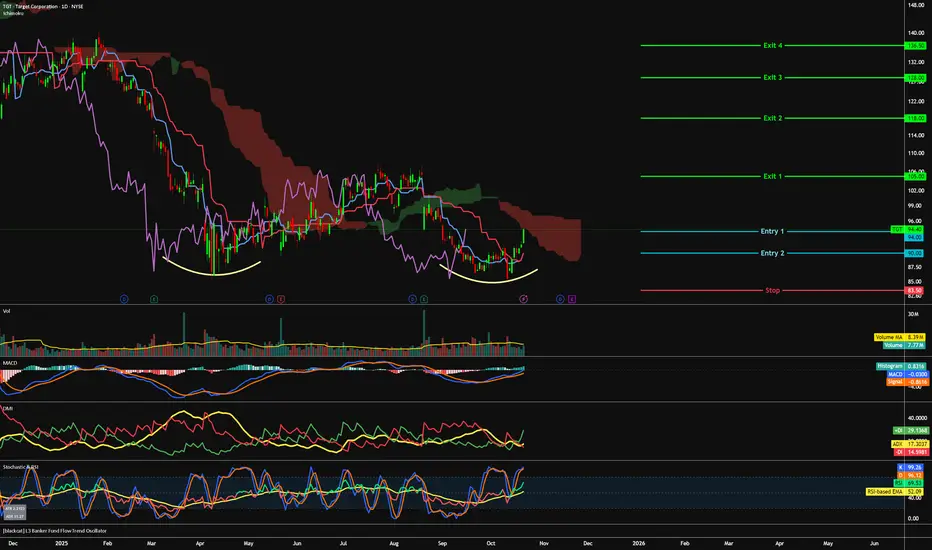
TGT - Seeking a new target=======
Volume
=======
- slight increase
==========
Price Action
==========
- double bottom / Rounding bottom noticed
=================
Technical Indicators
=================
- Ichimoku
>>> price below cloud, piercing cloud
>>> Red kumo contracting
>>> Tenken - Below clouds & pointing up
>>> Chiku - Below clouds & pointing up
>>> Kijun - Below clouds & pointing up
=========
Oscillators
=========
- MACD turning bullish
- DMI turning bullish
- StochRSI, bullish
=========
Conclusion
=========
- short to long term breakout swing
- price may reverse at current level, to enter spot or wait for pullback at entry 2.
- Entry and exits depends on your time horizon and risk management.
=========
Positions
=========
Entry 1 - $94
Entry 2 - $90
Stop - $83.50
Exit 1 - $105
Exit 2 - $118
Exit 3 - $128
Exit 4 - $136.50
Exit 5 - $160

Target at Multi-Year LowsTarget is low. Can it go lower? Of course.
Will it? Probably.
I am long here. I'll probably get longer.
No stop. No plan.

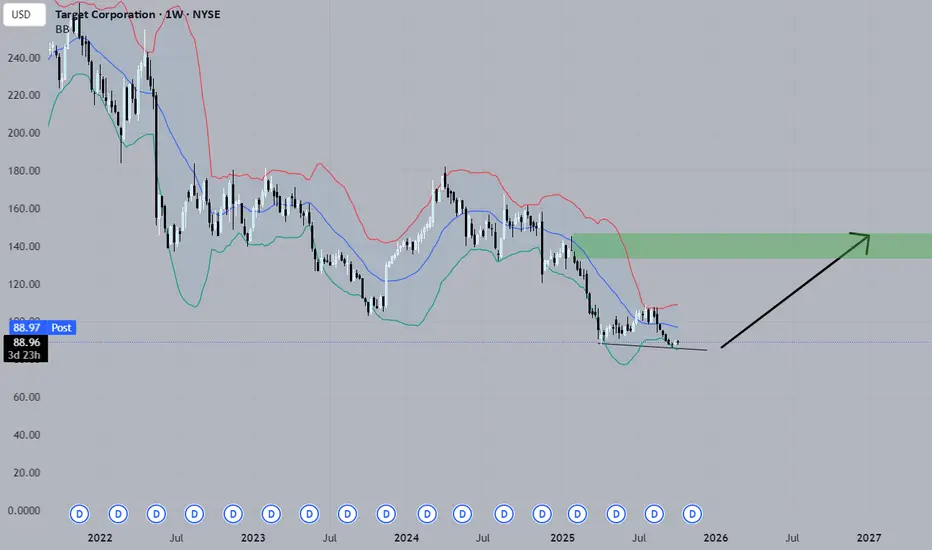
Time to Load up on TargetTarget (TGT) – Bullish Opportunity at $88.96 📈
TGT is showing a classic bullish divergence: while price has dipped, the RSI is holding higher lows, signaling potential upside momentum.
Fundamentally, Target remains strong:
High dividend yield with years of consistent payouts
New stores opening, driving future growth
Resilient business despite overreactions to DEI news
This combination of technical setup + solid fundamentals makes TGT a compelling buy for both income and long-term appreciation.
Target - $TGTKeep an eye on Target here - NYSE:TGT , from an intrinsic value standpoint, at $90 it can be 30-45% undervalued. Target is currently back at its 2020 lows and we like the current margin of safety at these levels.
Beginning to build a position here.
-------------------------------------------------------------------------------------------
Disclaimer:
I do not provide personal investment advice and I am not a qualified licensed investment advisor. I am an amateur investor.
All information found here, including any ideas, opinions, views, predictions, forecasts, commentaries, suggestions, or stock picks, expressed or implied herein, are for informational, entertainment or educational purposes only and should not be construed as personal investment advice. While the information provided is believed to be accurate, it may include errors or inaccuracies. I will not and cannot be held liable for any actions you take as a result of anything you read here.
Conduct your own due diligence, or consult a licensed financial advisor or broker before making any and all investment decisions. Any investments, trades, speculations, or decisions made on the basis of any information found on here, expressed or implied herein, are committed at your own risk, financial or otherwise.
Feel free to give us a follow and shoot us a like for more analysis updates.

TGT on Watch — Will Pull the Trigger around 87–83 ZoneTGT remains inside a broad downtrend, with price trading near 93 and well below the 98–102 resistance shelf. Both PMO and RSI (weekly & daily) are in bearish regimes — PMO(Top) under zero and curling lower, RSI(bottom) <50 and trending down — confirming weak momentum.
Bearish case (dominant):
Price rejection from 98–102 keeps sellers in control.
If 91–93 fails, next supports sit at 87 and 82.6. A close below 87 would confirm trend continuation toward the low 80s.
Bullish case (counter-trend only):
Buyers must defend 87 or 82 and push back above 98–102 to trigger a bounce.
If 102 breaks, upside opens to 113–118, but that would only be a relief rally inside the larger downtrend.
Macro & Seasonality:
September is historically a volatile/Bearish month, making TGT a close-watch trade.
Tariff headlines could act as a key swing factor for direction.
Lean: While 98–102 caps price, the weight of evidence favors the bearish side. Bulls only get traction if 87 holds and resistance is reclaimed.

$TGT🚨 NYSE:TGT is stepping up its game. The beauty section in remodeled stores is starting to look like a full-on NASDAQ:ULTA shop.
Target knows 💄 = high margins + repeat customers.
This could be a quiet but powerful growth driver.
#Stocks #Retail #Beauty

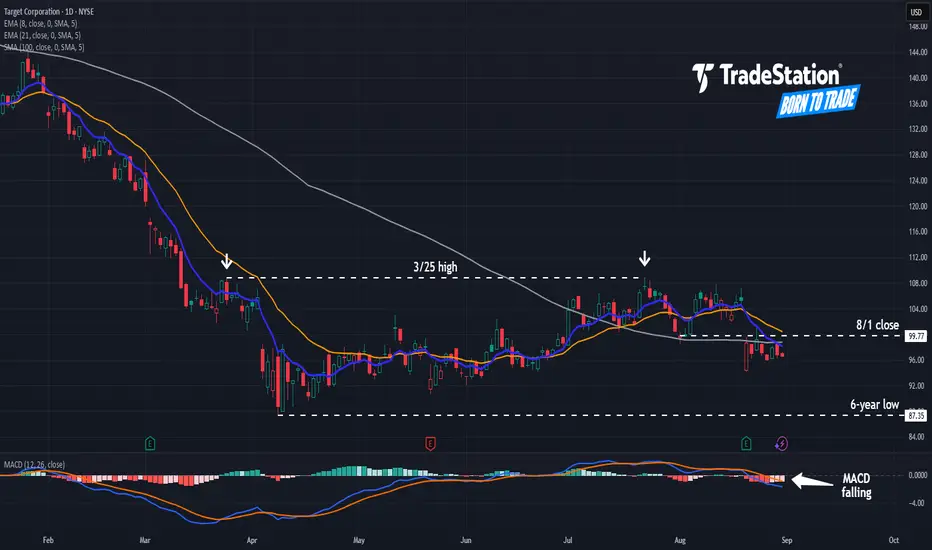
Target: Potential Downtrend ContinuationTarget has struggled all year, and some traders may see further downside in the big-box retailer.
The first pattern on today’s chart is the March 25 weekly high of $108.76. TGT probed that level in mid-July before dipping, which may confirm resistance is in place.
Second is August 1’s weekly close of $99.77. A weak quarterly report drove prices under that level last week and they’ve stayed there since.
Third, MACD is falling and the 8-day exponential moving average (EMA) is below the 21-day EMA. Those signals may be consistent with a bearish short-term trend.
Fourth, the stock is back below its falling 100-day simple moving average. That may be consistent with a bearish long-term trend.
Finally, TGT is an active underlier in the options market. It’s averaged about 90,000 contracts per session in the last month, according to TradeStation data. That may help traders take positions with calls and puts.
TradeStation has, for decades, advanced the trading industry, providing access to stocks, options and futures. If you're born to trade, we could be for you. See our Overview for more.
Past performance, whether actual or indicated by historical tests of strategies, is no guarantee of future performance or success. There is a possibility that you may sustain a loss equal to or greater than your entire investment regardless of which asset class you trade (equities, options or futures); therefore, you should not invest or risk money that you cannot afford to lose. Online trading is not suitable for all investors. View the document titled Characteristics and Risks of Standardized Options at www.TradeStation.com . Before trading any asset class, customers must read the relevant risk disclosure statements on www.TradeStation.com . System access and trade placement and execution may be delayed or fail due to market volatility and volume, quote delays, system and software errors, Internet traffic, outages and other factors.
Securities and futures trading is offered to self-directed customers by TradeStation Securities, Inc., a broker-dealer registered with the Securities and Exchange Commission and a futures commission merchant licensed with the Commodity Futures Trading Commission). TradeStation Securities is a member of the Financial Industry Regulatory Authority, the National Futures Association, and a number of exchanges.
Options trading is not suitable for all investors. Your TradeStation Securities’ account application to trade options will be considered and approved or disapproved based on all relevant factors, including your trading experience. See www.TradeStation.com . Visit www.TradeStation.com for full details on the costs and fees associated with options.
Margin trading involves risks, and it is important that you fully understand those risks before trading on margin. The Margin Disclosure Statement outlines many of those risks, including that you can lose more funds than you deposit in your margin account; your brokerage firm can force the sale of securities in your account; your brokerage firm can sell your securities without contacting you; and you are not entitled to an extension of time on a margin call. Review the Margin Disclosure Statement at www.TradeStation.com .
TradeStation Securities, Inc. and TradeStation Technologies, Inc. are each wholly owned subsidiaries of TradeStation Group, Inc., both operating, and providing products and services, under the TradeStation brand and trademark. When applying for, or purchasing, accounts, subscriptions, products and services, it is important that you know which company you will be dealing with. Visit www.TradeStation.com for further important information explaining what this means.
TGT Shortthis is my target bear chart i think we can still have a short opportunity into support. and continuation if breaks

TGT Earnings Play: Strong Bearish Setup – $100 Put🛒💥 TGT Earnings Alert – $100 Put (Aug 22, 2025) 🚨🔥
Earnings Snapshot
📉 Revenue Momentum: -2.8% TTM ❌
📊 Margins: Profit margin 4.0%, Gross margin 28.1% ⚠️
📈 Forward EPS Growth: 15.5% (aggressive) 💡
💵 Debt-to-Equity: 130.21 ⚖️
🏬 Sector Context: Discretionary retail under pressure, consumers shifting to essentials 🛒
Technical & Market Context
Price: $104.95, above 20-day MA ($103.40) but below 200-day MA ($115.47) ⚖️
RSI: 58.35 → neutral momentum
Volume: 3.8M, below average 📉
Options Flow: Expected bearish put skew 📉
Macro: Inflation & rising costs = headwinds 🚨
💥 Trade Recommendation
🎯 Strategy: Earnings Put
🏦 Instrument: TGT
💵 Strike: $100 Put
🗓️ Expiry: Aug 22, 2025
💰 Entry Price: $1.85
🎯 Profit Target: $5.50 (200%+)
🛑 Stop Loss: $0.92 (50% of premium)
⏰ Entry Timing: Pre-earnings close
📈 Confidence: 90% 🔥
⚠️ Key Risks:
Rapid IV crush post-earnings ⏳
Unexpected upside surprise 🚀
High leverage; manage sizing carefully ⚖️
Multiple Exit Scenarios
Profit Target Hit: Exit at $5.50 💰
Stop Loss: Exit at $0.92 ❌
Time-Based: Close within 90 mins post-earnings ⏱️
Trade JSON
{
"instrument": "TGT",
"direction": "put",
"strike": 100.0,
"expiry": "2025-08-22",
"confidence": 90,
"profit_target": 5.50,
"stop_loss": 0.92,
"size": 1,
"entry_price": 1.85,
"entry_timing": "pre_earnings_close",
"earnings_date": "2025-08-21",
"earnings_time": "BMO",
"expected_move": 5.0,
"iv_rank": 0.85,
"signal_publish_time": "2025-08-19 15:20:01 UTC-04:00"
}
📊 Quick Trade Recap:
🎯 PUT $100 | 💵 $1.85 → 🎯 $5.50 | 🛑 $0.92 | 📅 Aug 22 | 📈 90% Confidence
⏰ Entry: Pre-Earnings Close | 📆 Earnings: Aug 21 BMO | 📊 Expected Move: 5%

TGT ShortEntry: 106.33
Stop: 109.10
Target: 103.55
Signals (at entry):
Flow: Call/Put Vol Ratio: 0.49, Net Δ: -54.26
IV Skew (Put/Call): 1.10
Max Pain: 110
Due to the bearish option sentiment, a short trade was opened with a 1:1 risk.

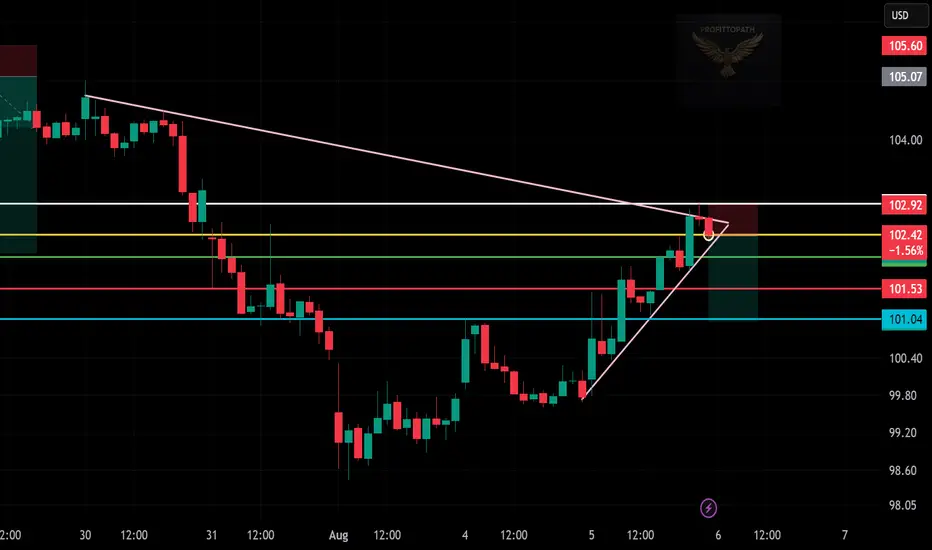
TGT Bearish Rejection Setup!🟥 🔻
🔺 Rising wedge meets triangle resistance wall.
🧱 Price stalls under $103 zone — weakness.
🧨 Short triggered with stop at $102.92.
🎯 Targets: $101.53, then $101.04 key level.
📉 Setup favors bears — clean downside move.
Target Calls $100 CallsTGT Technical Breakdown — August 1st
Target (TGT) remains within a well-defined ascending channel that began forming around April 9th, showing a consistent pattern of higher highs and higher lows. Today, price action has touched the lower trendline support of this channel near $99.50, which also coincides with a key psychological level.
While this area has historically attracted buyers, yesterday’s post-earnings reaction, which saw the stock fall several points, raises major concern about potential bearish sentiment in the short term. This makes the next move crucial.
Trade Plan & Critical Levels
🔎 Entry Trigger: I’m not entering yet. My entry will only be considered at $100.55, and even then, only if the price breaks this level with conviction — specifically, I want to see a strong bullish "power candle" to validate buyer momentum.
🛑 Stop Loss: $97.50 — just below the current trendline and a key invalidation point for this bullish structure.
📈 Targets Upon Confirmation:
$103.63
$105.00
$107.00
$108.73
Summary
The structure is still bullish, but yesterday’s earnings-driven drop introduces caution. $100.41–$100.55 remains the "must-break" zone. If bulls can clear this level with strength, momentum could carry the stock to the above targets. Otherwise, failure to hold the $99.50 support could see a breakdown toward the $97.50 area or lower.

$TGTNYSE:TGT slipping lower could be a red flag 🚨
Middle-income consumers might be feeling the squeeze less spending, tighter wallets.
If Target keeps dropping while dollar stores & luxury stay strong, the middle class might be getting crushed.
“TGT Pullback Entry – Clean Breakout Setup!Pattern: Breakout and retest of wedge
Entry Zone: Around $105.82
Stop Loss: Below $105.00 (white support line)
Target: $108.92 (green resistance zone)

TGT: Breakout From a 6-Month Base — Structure, MomentumThis NYSE:TGT setup is a great example of how structure + signal alignment can give traders a clean, high-probability play without chasing hype.
🔍 Breakdown: Why This Setup Matters
6-Month Base Breakout
Target spent half the year building a rounded base just below the Ichimoku cloud. The breakout above $100 is more than a number — it’s a psychological + structural shift. Buyers are finally in control.
Ichimoku Confirmation
Price cleared the cloud with a bullish TK cross weeks ago. Now, we’ve broken R1 pivot resistance and are sitting cleanly above the cloud. The trend is now officially flipped.
MACD Momentum
The MACD has been rising steadily, supporting the move. Green bars are growing in strength — no divergence or fade.
Risk/Reward
Entry: $102.43
Target: $127.07 (+23.31%)
Stop: $94.09 (–8.14%)
R/R: 2.87 — not extreme, but solid and realistic

Target will hit my Targets. They are beloved by the people!Target has been re structuring there entire business after DEI was taken away.
I think they realized that going down that path is not profitable and would bankrupt them quickly if they continued.
They boosted security measures and also strengthened there online store a lot.
Target #1: $116
Target #2: $120
