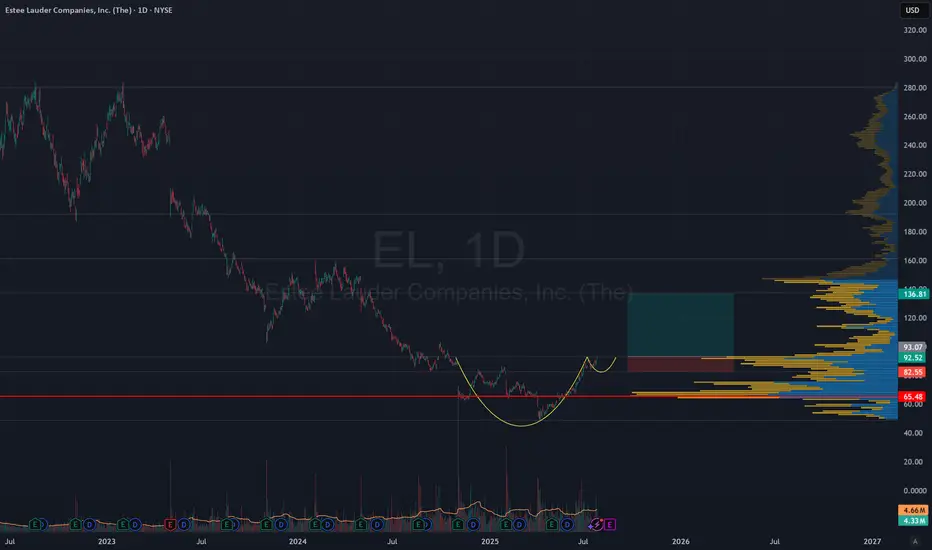
Estée Lauder ($EL) — Downtrend Break, $100 Reclaim: Eyes on $130Weekly chart shows a clean break of the primary downtrend with a reclaim of $100. Base case is a consolidation above $100, push into $115 resistance, then expansion toward $130–$155 if momentum persists. Gross margin profile remains elite, and short interest (~9.1M) adds squeeze fuel if buyers step in.
Key Levels
Support: $100 (breakout level; must hold on weekly closes)
Near Resistance: $115** (first obstacle/flip)
Targets: $130 → $145 → $155 (52-week high zone / measured move window)
Stretch (cycle): $206 / $270 on multi-month follow-through only if trend persists
SN:
Gross Margin ~74% supports premium multiple if growth stabilizes.
Short Interest ~9.1M could accelerate moves through $115 if volume expands.
Trade ideas

8 STOCKS I AM BUYING IN Q4 2025 ($NKE $EL $ELF $SHOP & MORE...)In this video, I'm going over what stocks I am personally buying in Q4 2025 & giving my basic reasoning for why.
I also give a few honorable mentions for stocks that I'm currently not buying, but are great opportunities right now!

looks like EL breaking out 🟢 Bull Thesis on EL (Daily Chart)
1. Base Formation Near Completion
EL has spent months carving a broad Stage 1 base between roughly $85 – $100, after a deep Stage 4 decline from its 2021-2022 highs (~$280).
This long consolidation suggests weak hands are mostly out and institutional accumulation may be underway.
The base is gradually tightening — recent daily candles show lower volatility and smaller ranges, a hallmark of a volatility-contraction pattern (VCP) before a potential breakout.
✅ Interpretation:
This is the type of “long, rounded base” Minervini loves — the longer the base, the stronger the eventual move.
2. Improving Moving-Average Structure
Price is currently testing the 50-day and 100-day moving averages from above, showing that short-term momentum remains constructive.
The 200-day MA is flattening after a long decline — a classic early Stage 2 precursor.
If EL can push through the $100–$105 zone, the 50-day will likely cross over the 200-day, creating a golden-cross setup and confirming trend reversal.
✅ Interpretation:
The moving-average alignment is on the verge of turning from neutral to bullish — an early trend reversal confirmation.
3. Positive Volume Asymmetry
Recent up-days have shown higher volume than down-days, hinting at quiet accumulation.
The ideal signal would be a volume surge ≥ 40-50 % above average when price clears the $105 resistance area — that would confirm institutional participation.
✅ Interpretation:
Volume behavior suggests large buyers are stepping in below resistance, which often precedes a powerful breakout.
4. Emerging Relative Strength (RS) Turn
EL’s RS line vs. S&P 500 has stopped falling and is beginning to curl upward — still early but improving.
If price can make new short-term highs while RS confirms with a higher high, that’s a double confirmation of leadership emerging from a laggard.
Bear Case from Daily Chart
1. Resistance Clusters & Pivot Failures
EL has a significant overhead resistance zone (around $95–$100, even $105 in longer view) which it has not yet broken convincingly.
In past attempts, EL “broke out” but then retreated below prior entry pivots (i.e. base failures). For example, IBD noted EL broke above a flat base (~$95.47) but later fell below it, marking a failed base.
Investors
The RS Rating was recently upgraded, but the stock needs to hold that breakout — prior weakness suggests traps.
Investors
2. Weak Momentum & Mixed Technicals
Some technical aggregators rate EL as “average” or “neutral” rather than strong. ChartMill, for instance, says EL is not showing a “nice entry/exit point” currently and advises waiting for consolidation first.
ChartMill
On shorter timeframes, moving averages (5-, 20-, 50-day) are mixed or under pressure, so upward momentum is not clean.
TipRanks
+2
Investing.com
+2
According to Moneycontrol, EL’s short- and medium-term technical rating is “bearish” (many moving averages below the price, negative crossovers).
Moneycontrol
3. Overbought / Exhaustion Signals
Technical signals suggest EL has entered overbought territory recently. For instance, its RSI surged above 70, which historically has preceded consolidation or modest pullback periods.
AInvest
With overbought momentum and limited recent leading strength, further upside without a rest may be hard to sustain.
4. Volume / Participation Concerns
A real breakout must be accompanied by above-average volume. The occasional volume spikes (e.g. in past “breakouts”) were often followed by weak follow-through or fading.
AInvest
+1
During the consolidation and base phases, volume tends to decrease, which is favorable for accumulation—but unless demand returns strongly at the breakout moment, the risk of a false breakout is high.
5. Risk of Reversion & Retracement
If EL fails to clear key resistance with strength, it may revert to support zones (e.g. $85–$90 area) because that’s been part of prior base structure.
A failure to hold breakout levels can quickly turn sentiment negative, triggering stops and accelerating downside.

EL - A new look to the personal images =======
Volume
=======
-neutral
==========
Price Action
==========
- rounding bottom and bullish flag noticed
- Weak selling pressure
- broken out of 2.5 years downtrend line
=================
Technical Indicators
=================
- Ichimoku
>>> price above cloud
>>> Green kumo budding
>>> Tenken + Chiku - above clouds and moving away
>>> Kijun - Above clouds and moving away
=========
Oscillators
=========
- MACD bullish
- DMI neutral
- StochRSI, bullish
=========
Conclusion
=========
- short to long term breakout swing
- price may reverse at current level, to enter spot or wait for pullback at entry 2.

EL Options Play: Long $95 Call – Pre-Earnings Setup
# 💄✨ EL Earnings Alert – \$95 Call (Aug 22, 2025) 🚀🔥
### **Earnings Snapshot**
📉 **Revenue Momentum:** -9.9% TTM ❌
📊 **Profit Margin:** -5.9%, Gross Margin 73.9% ⚠️
💡 **EPS Estimates:** Forward EPS \$2.70 vs trailing -\$2.42 📈
🏦 **Debt-to-Equity:** 215.93 ⚖️
💼 **Sector Context:** Luxury & consumer discretionary under pressure, defensive tilt helps slightly 🛡️
---
### **Technical & Market Context**
* **Price:** \$90.74, near short-term support/resistance ⚖️
* **RSI:** Neutral at 58 → potential upside resistance
* **Volume:** Stagnant, low conviction 📉
* **Key Levels:** Support \$84.68, Resistance \$92.00
* **Macro:** Defensive positioning favored, but luxury sector still faces inflation pressure 🚨
---
### **💥 Trade Recommendation**
🎯 **Strategy:** Long Call
* 🏦 **Instrument:** EL
* 💵 **Strike:** \$95 Call
* 🗓️ **Expiry:** Aug 22, 2025
* 💰 **Entry Price:** \$2.00
* 🎯 **Profit Target:** \$6.00 (200–300%+) 💎
* 🛑 **Stop Loss:** \$1.00 (50% of premium) ❌
* ⏰ **Entry Timing:** Pre-earnings close
* 📈 **Confidence:** 65%
⚠️ **Key Risks:**
* Stagnant fundamentals & weak revenue growth 📉
* Market volatility around earnings ⏳
* Premium decay post-earnings if target not hit 🚀
---
### **Trade JSON**
```json
{
"instrument": "EL",
"direction": "call",
"strike": 95.0,
"expiry": "2025-08-22",
"confidence": 65,
"profit_target": 6.00,
"stop_loss": 1.00,
"size": 2,
"entry_price": 2.00,
"entry_timing": "pre_earnings_close",
"earnings_date": "2025-08-20",
"earnings_time": "BMO",
"expected_move": 5.00,
"iv_rank": 0.75,
"signal_publish_time": "2025-08-19 15:23:34 UTC-04:00"
}
```
📊 **Quick Trade Recap:**
🎯 CALL \$95 | 💵 \$2.00 → 🎯 \$6.00 | 🛑 \$1.00 | 📅 Aug 22 | 📈 65% Confidence
⏰ Entry: Pre-Earnings Close | 📆 Earnings: Aug 20 BMO | 📊 Expected Move: 5%

Long positionBroke downward trend and forming a cup and holder pattern. upside potential 40%, Stop loss at -10%.
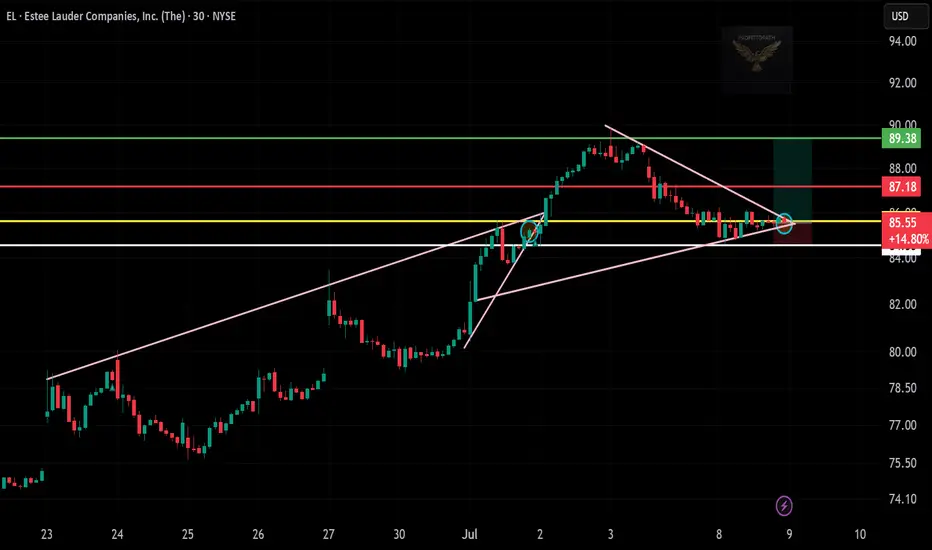
Best Long Trade Description (EL | Estee Lauder)📄
Ticker: NYSE:EL (Estee Lauder)
Timeframe: 30-Minute Chart
Trade Type: Long – Breakout Setup
Price is breaking out from a symmetrical triangle near a key support zone. Entry triggered at $85.55 with a clean structure and volume support. Targeting a move toward $89.38, with a tight stop below $85.00.
The setup offers strong risk-to-reward and fits a breakout continuation play after recent bullish structure.
📌 Trade Levels:
Entry: $85.55
Target: $89.38
Stop-Loss: Below $85.00
💡 Educational purpose only — not financial advice.
🔔 Follow @ProfittoPath for daily trade setups & breakdowns.
Estee Lauder | EL | Long at $67.33Reentering Estee Lauder at $67.33 due to the persistence of the Director, Paul Fribourg, buying around $33,000,000 worth of shares between $63-$66 (even after the earnings debacle). While the company had a horrendous outlook for FY2025, the bad news may be already priced in (i.e. cutting 7,000 jobs, weak sales, etc.). A "profit recovery and growth plan" is underway, so buckle up for the high risk of further declines in stock price in the near-term. Personally, a buy and hold at $67.33 with the primary thesis being global expansion (recovering Chinese market) or potential buyout into 2027.
Targets
$80.00
$86.00

Long Trade Idea: EL (Estée Lauder Companies, Inc.)!🧠
📅 Timeframe: 30-Minute
💼 Type: Long Position
📈 Setup: Breakout from rising wedge + bullish continuation
📍 Trade Details:
Entry: $85.12 (breakout confirmation with bullish momentum)
Stop Loss: $83.85 (below wedge support & structure)
Target 1: $86.87 (minor resistance)
Target 2: $89.38 (major resistance / final target)
🔎 Technical Breakdown:
Strong rising wedge breakout with high momentum
Rejection wicks previously — now showing breakout candle through resistance
Structure shifted bullish, with room to run up to $89+
Volume not visible, but price action is clean and controlled
🎯 Risk/Reward Outlook:
Favorable RR > 2:1
Risk is tight; potential upside to strong resistance zones
Great reward for momentum traders

Breakout Setup: $EL !🚨 🚨
📈 Price cracked key resistance at $78.85
🔁 Breakout + Retest confirmed
🎯 Targeting: $83.94
🛡️ Stop Loss: $76.85
📐 Risk/Reward: ~2.5R
🔥 Bullish structure, strong momentum, and volume behind the move.
Is this the start of a bigger reversal? 👀
#EL #BreakoutTrade #SwingSetup #NYSEStocks #ProfittoPath #TechnicalAnalysis

EL (Estée Lauder) Swing Trade Setup — June 15, 2025🔻 EL (Estée Lauder) Swing Trade Setup — June 15, 2025
💡 Ticker: EL
📉 Setup Type: Bearish Swing — Weekly PUT
📅 Expiry: June 20, 2025
⏱ Entry Timing: At Market Open
💬 Confidence: 70%
🧠 Model Insights & Technical Context
Across the board, our four AI models (Grok, Llama, DeepSeek, Gemini) provide the following signals:
✅ Short-Term Weakness:
Price is below all key EMAs (5-min and daily charts).
RSI is low (~30), near oversold but not reversing yet.
MACD is bearish and gaining downward momentum.
✅ Options Sentiment:
Very heavy put open interest at the $65 strike (4,935 contracts).
Max pain at $70 suggests potential price drag upward, but not immediate.
⚠️ Risk Flags:
Oversold conditions might cause a short-term bounce.
Gemini model recommends a $70 call if price holds support at open.
News risk remains (e.g., the death of Leonard Lauder) and volatility is rising (VIX ↑).
✅ Recommended Trade
💼 Strategy: Naked PUT (short bias)
🎯 Strike: $65.00
🕰 Entry Price (Limit): ~$0.65
🎯 Profit Target: ~$0.97 (≈+50%)
🛑 Stop Loss: ~$0.33 (≈–50%)
📆 Expiration: June 20, 2025
📈 Confidence Level: 70%
This setup reflects the dominant bearish view with strong technical momentum and favorable OI at the $65 strike. The trade benefits from liquidity and an attractive risk/reward skew.
🔍 Key Considerations
⚠️ If EL bounces sharply at open and holds above ~$67.30, the Gemini model’s call trade may activate. Monitor early action closely.
📊 News risk and market volatility may distort option pricing. Manage size and slippage carefully.
📉 If price reverses and breaks above $68.50, bearish thesis is invalidated.
💬 What’s your move on EL this week? Bearish into expiration or expecting a mean-reversion bounce?
Drop your thoughts 👇 or follow along in the QS trading room.

Seeing a bullish divergence on the weekly for ELWeekly divergence signaling a possible trend reversal.
Small luxuries commonly do well in a recessionary environment.

EL: "I May Be Early...But I'm Not Wrong"Having a little fun with this one since Burry's EL position is getting so much attention
With that said I see why its in his portfolio
Expect to hold this for 5-10 years to see it to fruition but yeah...I think Burry has another winner on his hands
As always time will tell and price is king

EL | This is Ready for a Move Higher | LONGThe Estee Lauder Companies, Inc. engages in the manufacture of skin care, makeup, fragrance and hair care products. It sells products under Estee Lauder, Clinique, Origins, MAC, Bobbi Brown, La Mer, Jo Malone London, Aveda and Too Faced. Its channels consist of department stores, multi-brand retailers, upscale perfumeries and pharmacies, and prestige salons and spas. The company was founded by Estee Lauder and Joseph Lauder in 1946 and is headquartered in New York, NY.

EL buyEstee Lauder Companies Inc. Stock Analysis (EL) as of May 16, 2025:
Current Price: At 16:00:00 EDT, EL is trading at $65.18, up 2.40% from its opening price of $64.77.
Market Cap: $23.45 Billion USD
Analyst Ratings:
The consensus rating among analysts is "Hold."
Based on ratings from around 27 brokerage firms, the average brokerage recommendation (ABR) is 2.74 (on a scale of 1 to 5, where 1 is Strong Buy and 5 is Strong Sell). This is consistent with the ABR from a week ago (2.74) and slightly improved from a month ago (2.75).
Currently, there are 3 Strong Buy and 1 Buy recommendations. The majority of recommendations are Hold (23). There are 0 Sell or Strong Sell recommendations.
Price Targets:
The average price target from 23 analysts is $67.26.
Price targets range from a low of $56.00 to a high of $100.00.
The average price target suggests a potential upside of approximately 5.64% from the last closing price of $63.67.
One analysis suggests a 17.44% upside potential, while another mentions a more modest 6.8% based on a 1-year price target of $68.00.
Technical Analysis:
Technical indicators present a mixed outlook.
Some sources indicate a "Hold" based on technical indicators, with a Neutral RSI (14) and a Sell MACD.
However, the 5-day and 20-day moving averages are suggested as "Buy," while the 50-day and 200-day moving averages are seen as "Sell."
Investtech indicates a medium-term falling trend channel but notes the price is near a support level of $63.00, which could lead to a positive reaction. They also point to high positive momentum and an overbought RSI in the short term, which might suggest a potential pullback.
Fundamental Analysis:
Revenue: In the second quarter of fiscal year 2025, Estee Lauder's revenue was $4.00 billion, up 19.13% from the previous quarter. However, year-over-year comparisons might be relevant for a broader perspective.
Earnings Per Share (EPS): The latest EPS was -$1.64, significantly below analyst estimates. The next quarter's EPS is estimated at $0.07.
Profitability: While the gross profit margin is impressive (76.10% in Q2 2025), overhead costs led to an overall loss in that quarter. The operating profit margin, pretax profit margin, and net profit margin are considered low or failing in some analyses.
Valuation: Some price-to ratios, such as P/B, P/S, and Price to Free Cash Flow, are considered high. However, the PEG ratio is low. An intrinsic value calculation suggests the stock might be slightly undervalued.
Future Growth: Analysts expect moderate revenue growth in the coming years but stronger growth in EPS.
Key Considerations:
Analyst Sentiment: While the average rating is "Hold," there are still some "Buy" recommendations, and the average price target suggests some upside.
Technical Factors: The mixed technical signals make it difficult to draw a definitive conclusion based solely on technical analysis.
Fundamental Challenges: Recent earnings reports indicate some challenges with profitability despite strong gross margins. Future earnings growth will be crucial.
Market Conditions: The overall market and the performance of the cosmetics industry will influence Estee Lauder's stock price.
Should You Buy EL?
Given the current information, there isn't a clear "Buy" signal. The consensus "Hold" rating reflects the mixed signals from analysts. While there's potential upside based on price targets, the fundamental challenges and mixed technical outlook suggest caution.
Before making any investment decisions, you should:
Conduct thorough independent research.
Carefully consider your own investment goals, risk tolerance, and financial situation.
Review the company's financial statements and future prospects in detail.
Consider seeking advice from a qualified financial advisor.
Keep in mind that the stock market is inherently risky, and past performance is not indicative of future results.

Estee Lauder setting up for a long term rally? (March 5, 2025)A lot of interesting signals developing on NYSE:EL higher timeframe charts here

Stock Of The Day / 02.04.25 / EL02.04.2025 / NYSE:EL #EL
Fundamentals. Earnings report. Estee Lauder beats earnings expectations, but negative forecasts send shares lower.
Technical analysis.
Daily chart: Downtrend. Level 69.78 formed by the gap in November 2024 is ahead.
Premarket: Gap Down on increased volume.
Trading session: A pullback after the initial downward movement was stopped at the level of 74.00. We observe a narrow range and a clear holding of the price below the level. We are considering a short trade to continue the downward movement in case of holding the level of 74.00.
Trading scenario: #Pullback along the trend (#rebound) from the level 74.00
Entry: 73.13 when exit down from the trading range below the level.
Stop: 74.12 we hide it behind the level with a small reserve.
Exit: Close part of the position before the daily level of 69.78. Close the remaining part of the position at a price of 68.50 when the structure of the downtrend is broken.
Risk Rewards: 1/4
P.S. In order to understand the idea behind the Stock Of The Day analysis, read the following information .

Estee Lauder | EL | Long at $63.00On November 13th, 2024, the Director of Estee Lauder NYSE:EL purchased $10,000,000+ worth of shares. From a technical analysis perspective, this makes sense as it almost double entered my "crash" simple move average lines (indicated in gray). On the rare occasion the price double dips these areas, odds are typically in my favor a rally may be ahead (obviously, without unforeseen bad news from the company). While it still may dip into the "crash" simple moving average lines ( GETTEX:50S ), I believe the "Santa Claus" rally is around the corner and we may be close to a near-term bottom for $NYSE:EL. However, this is a very risky play due to the fundamentals of the company - which currently aren't good. But future prospects from NYSE:EL may change the momentum. Thus, at $63.00, NYSE:EL is in my personal buy zone.
Target #1 - $86.00
Target #2 - $100.00
Target #3 - $120.00

weekly time frame promising for ELLooking at the weekly time frame for EL, I see great potential for an upward trend. Very strong support at 61.00 so would stop loss there and enjoy and upward trend to 115 to 120, I expect that by April or May this year. long term profits! long time frames, and forget the rest.

$EL Pefect Psychology of Money Cycle chart NYSE:EL Pefect Psychology of Money Cycle chart
Seen this exact setup with NASDAQ:PYPL and NYSE:BABA and now.... NYSE:EL
Looks like a good buy here none of the less

Estee Lauder (Extended Hours) | Chart & Forecast SummaryKey Indicators On Trade Set Up In General
1. Push Set Up
2. Range Set up
3. Break & Retest Set Up
Notes On Session
# Estee Lauder (Extended Hours)
- Double Formation
* Retracement | Not Numbered | Subdivision 1
* ABC Flat Correction
- Triple Formation
* 118.20 USD | Wave 2 | Extension | Subdivision 2
* Retracement | Numered | 1))
* Cup & Handle Pattern | Daily Time Frame | Subdivision 3
Active Sessions On Relevant Range & Elemented Probabilities;
London(Upwards) - NYC(Downwards)
Conclusion | Trade Plan Execution & Risk Management On Demand;
Overall Consensus | Neutral

EL BUY like the director did!! It's a bargain hereEL director purchased $25 million in stock because its a buy here!! First target after it broke fib resistance today is $78.69 we could see this next week as these lower volume stocks can put a squeeze on

EL Long tradeNYSE:EL
A big player is positioned in stock, director bought a lot of shares. It's a good signal!
It can be the last most important oppotunity in 2024
Open your eyes!
