FASTENALNASDAQ:FAST
Hello, traders.
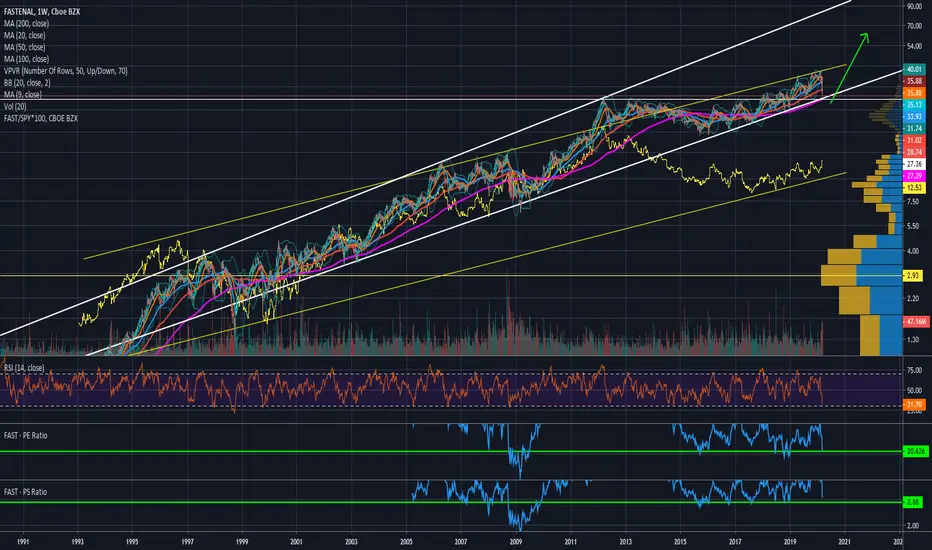
It's time to show you the shares of FASTENAL Co., a member of the S&P500 index. And that's why.
What's on the chart:
1. Since March, the paper has grown by more than 70%.
2. On the chart clearly visible correction waves, but the paper was not allowed into the short zones, so as not to launch a wave of sales.
If you look carefully at the chart, you will see that the first wave of correction 7%, the second wave of 6%, after analyzing all the waves, you will see that the paper has always been bought back.
That is, we have a strong long player in front of us.
3. August 7 growth was stopped at 48.51. This level was confirmed several times.
4. August 18 was made a false breakout (high of the bar: 48.55), but the paper was not allowed go down.
5. At the level of 48.55 is a large limit order. I will consider this when start to trade.
6. On August 21, there was a breakout of the level 48.51.
7. Volumes for further hiking were gathered within 11 days. It is quite normal to go long.
In my trading strategy I will wait for the fixing bar above the level.
I also remember that at 48.55 is a lim. order placed.
It will be great if this order is disassembled and the fixing bar can close higher.
I will enter the long if the close price of the fixing bar will be above the level.
I will place a SL order under the breakout bar.
Trade ideas


$FAST is going to rise todayEarnings intraday trading strategy signal.
Fastenal Company, together with its subsidiaries, engages in the wholesale distribution of industrial and construction supplies.
Today the company announced it had beat sales (1.509B, est. 1.47B) and EPS (0.42, est. 0.36) estimates.
I suppose many traders will close their short positions today due to the good earnings report and potentially upside trend.
So I hypothesize that $FAST price will be rising from the market open to market close.
Due to strategy, the long buy can be from the market open price,
stop-loss — - $1,03 per share
take-profit — market close price.
Do not view this idea as a recommendation for trading or investing. It is published only to introduce my own vision.
Always do your own analysis before making deals. When you use any materials, do not rely on blind trust.
You should remember that isolated deals do not give systematic profit, so trade/invest using a developed strategy.
If you like my content, you can subscribe to the news and receive my fresh ideas.
Thanks for being with me!

FAST looking constructive $FAST is now quite attractively valued and has been outperforming the spy as shown by the yellow fast/spy ratio. Looks like a good support zone down to about $25. Once the market reverses should see strong outperformance. $FAST is another company with a very strong balance sheet with little debt and is consistently profitable.
FASTENALBasiclly publishing a strong trend and having in mind that we dont have to lose hl .
fastenal cuidando de no perder los minimos anteriores una accion muy fuerte

FASTENAL Projection DailyHey people, FASTENAL is in a bullish configuration, it seems to want to go on its resistance the question is how it will break its call price.
Please LIKE & FOLLOW, thank you!


Possible long continuation aheadRetesting to the previous all time high back in 2/20. Looks like it could possibly continue the upward trend tot he all time high. There is some support between 38 and 37.
An ideal entry would be passing 39.00
I am already in the trade, I entered @ 38.89

FAST WEEKLY ACCUMULATION GETTING STRONGER WITH SPX NASDAQ:FAST
FAST - Re accumulation
Weekly Chart for Follow up
Daily look it will consolidate for short term but it looks that its starting to Fuel up and waiting for Entry point and to Join
Good luck


FAST WEEKLYBuyers made a long legged doji on weekly that was at demand in an uptrend.now buyers coming into market for continuation to upside to next level of supply

Broke resistance BUT - might jump back under Just making this update on my previous cart i link below.
Yesterday it broke the 38,02 support and ended at 38,34 - so here was my "buy pos"
but i cancelled it becouse it didnt go further thwn it did , this was a good call, for this morning the Corona Virus came with more bad newa
and that can have impact on the stock market - just looked at the pre-market and so fare in down 0,85 % and that makes it jump under the resistance line again.
i have made this new pre-order
Open trade : 38.34
Set TP : 42.23
Set SL : 36.45
Risk/Reward : 2,06 / 9,45 % gain
This is NOT an investment advice , remember always to do your own reseach.


Fastenal possible inverse Head & Shoulders
Alert set for break above $38.50
Evaluate volume profile before entering any longs to confirm bullish break.
PLEASE GIVE US A LIKE IF YOU APPRECIATE OUR CONTENT, THANK YOU

looking for my buy signal Looking for my buy signal
Golden cross is made 19 Dec
Up trend since jan 2006
Holding the 50 MA / 200 MA
RSI is 50.50 after the small drop this friday.
High volume on the 18 okt 19 befor earnings.
Fundamental analyse :
Positive 3Q earnings
Went from +0,33 in 2018 to +0,37 in 2019
Link : s23.q4cdn.com
Fastenal is many things to many different customers: an expert consultant, a logistics company, a technology provider, and more generally, a distributor of wide-ranging industrial and construction products.
Disclamier :
im waiting for the break up of last resistance at 37.90 befor putting on a buy pos.
open trade : 38
Set TP : 42
Set SL : 35.80
Risk / Reward Ratio : 2,06

Maybe early to get in on FAST but upside will follow- FAST has found support on ER gap and previous high
- Likely to consolidate for a few days before we see a move to the upside
- Overall, trend is long and strong and sellers are exiting
- Look for a jump to $38


FAST Gaps to Previous HighHigh Frequency Traders triggered on FAST news, gapping the stock just slightly above the previous yearly high. The stock is in a slight run upward within the previous white candlestick body. The gains look to sustain.

Congrats to Subscribers! Fastenal up over 15%It is very easy to read price action if you have a reference point. These support/resistance lines are there to help you read where the buyers and sellers are likely to make a stand.
MasterChartsTrading Price Action Indicators show good price levels to enter or exit a trade.
The Blue indicator line serves as a Bullish Trend setter.
If your instrument closes above the Blue line, we think about going Long (buying).
For commodities and Forex, when your trading instrument closes below the Red line, we think about Shorting (selling).
For Stocks, I prefer to use the Yellow line as my Bearish Trend setter (on Daily charts ).
Be sure to hit that Follow button! Please find me on social networks via the link on my profile page for more ideas from MasterCharts!

Fastenal hits all time highEntry level $36.40 = Price target $40 = Stop loss $35.80
Bullish earnings and a change in market sentiment has sent FAST to an new high, we see $40 as the next target.
