Ford about to drive off a cliff?Much like many other stocks on the broader stock market we see some large bearish patterns just looming over the heads of investors. There is no certainty most of these will play out, we all know th FED and pivot any moment and that will cause a large squeeze in the market. However, in the meantime we see what looks to be a large Head & Shoulders on Ford that is sitting on the edge. If the patterns plays out we could see prices as low as $5 in the longer term or below $9 in the short term. Will be monitoring this one closely.
Trade ideas

F daily retest of long day bullish candle at buying zone supportOrder BUY F NYSE Stop 11.94 LMT 11.94 will be automatically canceled at 20230401 01:00:00 EST
F daily retest of long day bullish candle at buying zone support quick 1.2R countertrend.

F FlatLooks like a flat to me.
Stopped at the 50% exactly.
If this is correct, the next big target is 9.79.
I've been short with a stop of 11.87. But 11.89 looks good to me, for now.
A break of 11.89 would mean reevaluation.

QuickTrade 110 : FLong, looking for a close of the double gap up + one more shake to test the ema 250h.
Short, looking for a test of a long term low.

F daily bullish hammer Order BUY F NYSE Stop 12.58 LMT 12.58 will be automatically canceled at 20230401 01:00:00 EST
F daily bullish hammer into wave C of wave 4 downtrend. Countertrend quickie.

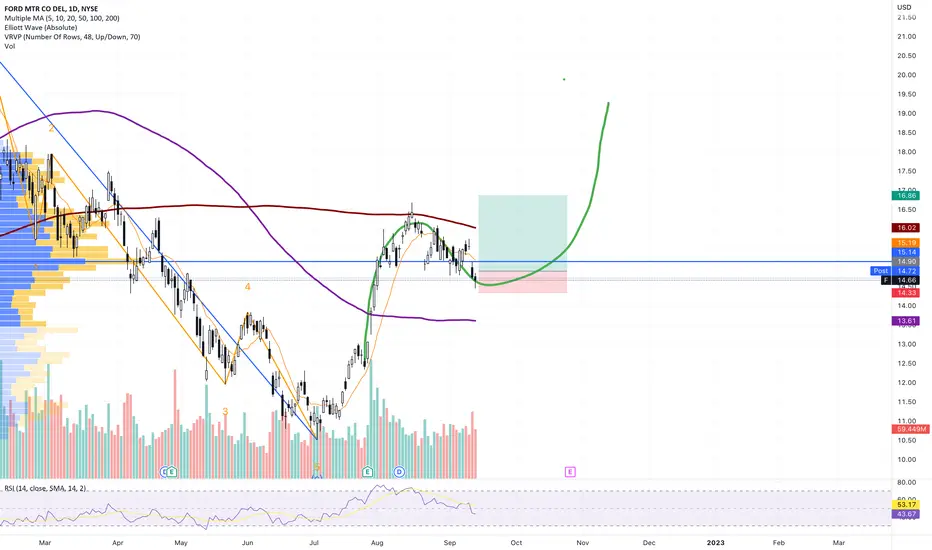
Ford UptrendFord has the potential to move back to the $15.15 mark where many are still holding.
The first mark to make is $12.30 then $12.87 and if it continues through those resistance lines and makes them a new support, it will make a new high to $13.60 and $14.44. This is depending upon $SPY and how the overall market does. This stock is oversold and the MACD is showing that buyers are coming back in control.

Fordin my opinion it is a textbook H&S with neckline tilted down by the weekly, I should have entered before, I'll gradually and increase on breaking neckline
it is very large it seems strange because the target would be around 5, but the trend was down before the covid, without this speculative phase perhaps it would have reached 5 by itself

Ford should bounce from current levelsConfluence of earlier level of 11.30 along with a weekly trendline, shows multiple support. In addition, the high velocity of the move to hit the support level increase the probability of a short term bounce in Ford.
Disclaimer: Not a financial advice.

forecasting FORD MOTOR in WEEKLY chartHello to all investors, according to my previous studies and according to my experience as a trader, I see a good investment opportunity with a high probability of success, the details are reflected in the graph

Where Ford is a buy for meMaking & publishing this mental plan on when to buy Ford stock. Which means I'm starting now, slow & steady.

F MASSIVE BEARISH HEAD AND SHOULDERS (SELL) $$$A head and shoulders pattern is a bearish reversal pattern that indicates that the uptrend has reached its top and that the reversal has begun. As you can see from the weekly chart, this head and shoulders pattern suggests a very negative price action in the following weeks until F finds firm support and bounces off to bullish territory

F - Ford Motor Car CompanyPrice action suggests further downside is in store for Ford.
Price had settled on a weekly basis 1%+ below the countertrend secondary BLUE channel structure.
Price has now settled below the 200, 50 & 20 day SMA's in that order.

$F | Bounce En route? 🚗With Ford reaching support zone levels (as well as key value level) not seen since June and February as well as extreme oversold levels, this may be the call for a reversal here upcoming. I am keeping my eye on this and waiting for a confirmation candle to signify change of sentiment as the bottom band on the bollinger band has been broken.
The market itself, is in shambles but certain stocks sometimes revert to their "own" ways vs. what the rest of the market is doing. We will see if $F will make a move here. 👀

F daily hammers pressure buildingF daily hammers pressure building wave 4 of downtrend gotta be quick.
Buy Stop 12.32 LMT 12.32 GTC
Sell Limit 13.50 GTC
Sell Stop 11.47 GTC

F ThisFord went right for my target, rather than playing out the wedge I had expected.
Now it has printed a Dragonfly on the 1D, and I expect it to reverse.
It narrowly missed the 75 and nudged past the 1.618 on log scale (not linear), hitting the wave 3 target I had expected in a previous idea (but I had expected this to take longer, and to form a wedge; but no wedge, just collapse).
BUT one more dip on Monday to complete the minuette wave 3 is likely. It could be complete here. But I expect a slight dip and then rise into resistance. Probably intraday.
The last dip here could fill the gap below. But I think that gets filled on the next wave down.
There’s a lot of resistance to fight through to reach that 50%. It might not get there.
The red resistance band will be tough.
I’ll short it if it gets to the 50%. Hold approaching earnings and cut before. Probably.
Stop: 13.61.
If it doesn’t stop there, I expect it quick ascension to fill overhead gaps.
Shorting the 50 is pretty great r/r. Tight stop.
If it just melts down from here?
I guess I’ll wait and long the 2 and then short the 3.
I don’t think it melts down from here. It needs a relief wave first.
___________________________________________________________________
Oh yeah, not meant as advice in any way for anyone.
I just intend to track my personal decisions over time.

$F PLAY (Week of 9/26)Broke through the $12.19 support with room to fall to demand zone around $11.17. Watching puts below $11.7 and calls above $12.45,

F Head and Shoulders SHORTFord had great earnings and revenue beats in July however inflation
is eroding the purchasing power while Ford raised the price of its flagship
EV, the Lightning by $8000+ and supply chain issues persist.
The 2H Chart shows a head and shoulders pattern with price currently
sitting at the trigger area at a time when the general markets are
"challenged".
Shown on the chart are the mid-Fibonacci levels on the retracement
of the uptrend which started July 5th and ended about August 16th.
Thye may suggest that F could downtrend into targets in the range of
14.3 to 13.05 over the typical slow and weak month of September.
In consideration of this, I will go flat on call options and watch for
Ford's further trend.

F bullish hammer on daily at the bottom of the S curve restCatching the bottom of the rest of S curve on daily F. A bit concerned about the volume spike (should be low) and earning coming up. The rest is cool.

Ford - more pain to comeFor me it is showing a clear head and shoulders pattern. This would indicate a continued bearish trend. The blue line shows head to shoulder line price movement which should give price target for the drop - marked by the grey horizontal area. Bottom line is that the floor is sub $3


Ford stock down big 10%+ and on most active list $f #ford Ford warns investors of $1billion in costs related supply chain issues. Big move in the stock over 10% so far. Makes me wonder if any other car makers are affected. What would you think, yay or nay?
