Ford Motor's Resilience in 2023: Navigating Problems & Prospects
Ford Motor has emerged as a resilient force, reporting its best annual auto sales in the United States since 2020. The Detroit automaker's success in 2023 can be attributed to sustained demand for its crossover SUVs and pickup trucks, reflecting the prevailing trend of American consumers favoring larger vehicles for their safety and utility.
A Year of Triumph Despite Headwinds:
1. Robust Sales Performance:
Ford Motor's vehicle sales witnessed a notable uptick, rising by 7.1% to 1.99 million units in 2023. While this figure represents a slight dip from the 2 million units achieved in 2020, it signals a commendable rebound in the face of market challenges.
2. Consumer Shift to Larger Vehicles:
The American automotive landscape has seen a distinct shift towards larger vehicles, such as crossover SUVs and pickup trucks, at the expense of sedans and hatchbacks. Ford's strategic emphasis on these segments aligns seamlessly with consumer preferences, contributing to its robust sales performance.
3. Electrification Success:
Ford's foray into the electric vehicle (EV) market has proven successful, with sales of its EV models, including the F-150 Lightning pickup truck and Mustang Mach-E crossover, surging by nearly 18% to 72,608 units. The company's EV models now account for a noteworthy 3.6% of its total sales, showcasing a growing appetite for electrified options among consumers.
4. Hybrid Momentum:
In addition to its electric offerings, Ford's hybrid vehicle sales experienced a remarkable growth of more than 25%, reaching 133,743 units and constituting about 7% of its total sales. This signals an effective dual-strategy approach by the automaker, catering to both electric and hybrid preferences in the market.
Industry Dynamics and Challenges:
1. Market Trends:
The broader U.S. new vehicle sales market concluded the year at around 15.5 million units, with electrified vehicles, including hybrids, making up nearly 17%. This underscores the industry's gradual shift towards cleaner and more sustainable transportation options.
2. Consumer Caution Amidst Interest Rates:
Analysts have raised concerns about the potential impact of high-interest rates on consumer appetite for new vehicles in the future. Ford's ability to navigate this challenge will be critical, as economic factors continue to play a pivotal role in shaping the automotive landscape.
Ford's Market Position and Technical Analysis:
Market Standing:
Despite the challenges, Ford Motor solidified its position as the third-largest automaker by sales in the United States, trailing behind industry giants General Motors and Toyota. This underscores Ford's enduring presence and competitiveness in a dynamic market.
Technical Analysis
While the stock has faced challenges, breaking through support at $11.70, it is essential to note that Ford has broken the ceiling of the falling trend in the medium long term. This suggests a slower initial falling rate, and an established break predicts a further decline.
Conclusion:
In summary, Ford Motor's performance in 2023 showcases resilience, adaptability, and strategic foresight in navigating an ever-evolving automotive landscape. The success in the sales of larger vehicles, coupled with a strong showing in both electric and hybrid segments, positions Ford well for the future. However, the company must remain vigilant amidst economic uncertainties, particularly concerning interest rates, and continue to innovate to stay at the forefront of the rapidly changing automotive industry. As consumers increasingly embrace sustainable and technologically advanced options, Ford's commitment to electrification could be a key driver of its future success.
Trade ideas

fordif we see the picture we will find a gap between 11.28 11.49 and a lot of support like ema 100with blue color and ema 50 with orange color
so can begun accumulate in this area zone
targets are
12.10$
12.50$
12.87$
13.20$

Ford Motors: Bearish Rejection of Previous .618 Support ZoneFord Motors in the face of continuously Rising Debts and Negative Free Cash Flows has been rejected from the 61.8% Fibonacci retrace, which previously acted as support and now seems likely to continue down significantly. If I were to target how low I think it could go, I'd say $8.65-$6.00 seem like likely targets.

Short in Ford
"I have recently initiated a short position on Ford stock as the price has reached a significant supply zone. Through comprehensive technical analysis and market observation, I have identified this zone as a key resistance level where selling pressure is expected to intensify, potentially leading to a downward price movement.
This trading decision is based on the belief that the price will decline as the supply exceeds demand within this zone. Furthermore, I have observed additional bearish indicators that support my decision to take a short position.
As a diligent trader, I will closely monitor the price action, market sentiment, and relevant fundamental factors to effectively manage my position and make necessary adjustments as the trade progresses. Implementing a robust risk management strategy is crucial to safeguard my capital and optimize potential profits.
Please note that trading stocks, including Ford, involves risks, and careful consideration is essential. I highly recommend conducting thorough research, developing a sound risk management plan, and, if necessary, seeking guidance from a qualified financial professional before making any investment decisions.
Kindly note that the above text is for informational purposes only and should not be considered as financial advice. It is always advisable to seek professional advice and conduct thorough analysis before making any financial transactions."

FORD stops building Electric CarsSaw this coming last year just by looking at the technical analysis. Remember that the "fundamentals" and bundled into the Technicals.

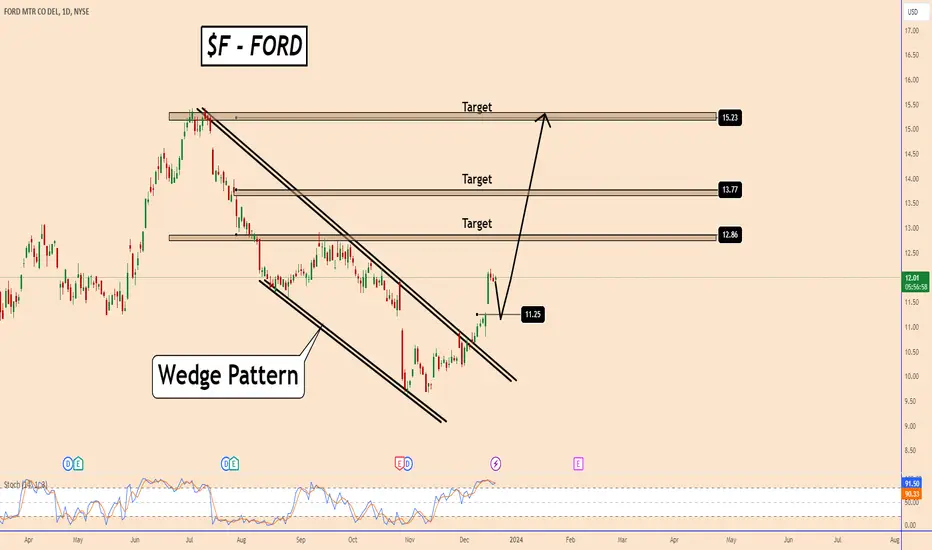
FORD: Time To Recover The Lost ValueFORD: Time To Recover The Lost Value
I will share with you only the technical outlook for NYSE:F -FORD.
The price reached $9.6 at the end of October 2023.
This area was very old and was last tested in January 2021 or almost 2 years ago.
The price broke out of a large daily wedge pattern and looks set to recover again.
Even if the price tests 11 - 11.50 the picture already changed and NASDAQ:FORD price should rise again.
The correction moment is supported also by the Stochastic indicator which is showing for overbought conditions.
However, the price may also continue to rise from the market price.
You may find more details in the chart!
Thank you and Good Luck!
Ticker symbol -F- up trend.Double bottom. Gap fill. trend brake out . What's next will ticker symbol -F- continue up or will it break down?

F LongFord has been respecting the pitchfork and is in a great buying zone. 15% stop but the R:R is around 8:1. Small size with the stop just outside of the previous low. Could very possibly be an edge of the market here and if it turns out to be so we will have caught the next trend at its earliest stage.

F - Is it going to be a good Christmas with Ford?
Is it time for a reversal for NYSE:F ?
Since early 2022, Ford's Price Performance has not been pretty good for their investor.
In the recent stages, the price has formed a consistent Downtrend Channel since July 2022.
Potential Bullish Divergence from its weekly chart MACD Oscillator might hint us at a reversal but surely need trend reversal confirmation from the daily chart.
If the price cannot break $10.64 as its neckline in an imaginary double bottom potential, then we need to at least see any bullish divergence potential in the daily chart from the oscillator.
For bullish divergence to appear, the price needs to go lower than $9.63 but the oscillator keeps making a higher low.
If the price can break $10.64, the nearest target is the double bottom pattern target at $11.61
You may also manage your risk for entry when the price breaks the minor downtrend as shown in the picture below:
Performance-wise, in the last 20 years, December only has a 40% rate of Positive Return with only a 20% winning rate in the last 10 years.
There are still 2 weeks in November, and it has 67% winning history since 20 years ago and 73% winning history in the last 10 years.
I'd probably go Long for this opportunity until the end of November 2023.

Ford gonna dump i thinkford stock not gonna do so great. sales are slumping, trucks are sitting on lots for longer than 300 days. union wages just went up. ev credit of $7,500 is gonna end going into Jan 2024. mustang is slated to be stopped in 2028. big f

stock of the car manufacturer FordIn a downward trend for a long time and now trying to break the trend line if you succeed and with the support of trading volume you will bring a nice move up
The market seems to have calmed down from Tesla's electric truck competitor because of its price

Ford Slides After New Profit Forecast, UAW Strike-Cost TallyFord pegged the cost of the six-week UAW strikes at $1.7 billion, more than rival GM's $1.1 billion estimate, while issuing an updated 2023 profit forecast.
Ford Motor (NYSE: F) - shares moved lower Thursday after the carmaker followed General Motors (GM) - Get Free Report in reinstating its full-year profit forecasts while noting it will lose around $1.7 billion from the United Auto Workers strike that ended late last month.
Ford said it sees adjusted full-year profit in the region of $10 billion to $10.5 billion, down from its July estimate of between $11 billion and $12 billion. Free cash flow should improve to between $5 billion and $5.5 billion.
The group reached a deal with the UAW on October 26 that will see members receive a 25% pay increase, including an initial boost of around 11% and a further 30% increase in cost-of-living adjustment payments. Ford said the contract would add $8.8 billion in costs over the 4 1/2-year contract.
GM said the six-week UAW strike would would clip around $1.1 billion from the group's bottom line. But as at Ford, GM said it would ultimately improve free cash flows thanks in part to strike-related shutdowns at various facilities around the country.
GM said it saw full-year adjusted profit in the region of $11.7 billion to $12.7 billion, down from its prior forecast of $12 billion to $14 billion. Diluted earnings, GM said, would likely come in between $7.20 and $7.70 a share, compared with its prior range of between $7.15 and $8.15 per share.
The carmaker also said it would boost its quarterly dividend by 33%, to 12 cents a share, starting in 2024 while immediately retiring $6.8 billion in GM stock through its new $10 billion buyback.

Ford = T-bills on roids right nowFord at 9.50 is a very good value play for short term or long term.
Either way I see a run up to the 15$ level and a pull back or chop back up to the high levels it was previously.
I have been building a position with profits from the last week.

Ford - is the bottom in?Hello Friends 😁
The breakout of Ford NYSE:F from the triangle confirms for me that we are in a Wave E and thus in an A-B-C-D-E correction. Wave E has also completed Wave 2, and I expect that it marks the low of the correction for Ford.
I am very curious on how it develops 👀
Bye 🫡

FORD MOTOR CO (F) 1M NYSE:F FORD MOTOR CO (F) 1M
### Current Situation:
- **Stock Price:** $9.84
- **Moving Averages:** Below the 50-day, 100-day, and 200-day Moving Averages (MA)
- **Volume:** 508 million
- **Relative Strength Index (RSI):** Between 50.00 and 40.00
- **Moving Average Convergence Divergence (MACD):** Signals below the histogram
### Analysis:
1. **Price and Moving Averages:**
- The stock trading below the 50-day, 100-day, and 200-day MAs typically indicates a bearish trend.
- This positioning suggests a lack of upward momentum and possibly a bearish sentiment among investors.
- These MAs might act as resistance levels if the stock tries to move upwards.
2. **Volume:**
- A high trading volume of 508 million can indicate strong interest in the stock. However, the interpretation depends on the price movement context. High volume with a price decline can signal strong selling pressure.
3. **Relative Strength Index (RSI):**
- An RSI between 50 and 40 is often considered a neutral zone. However, trending towards 40 can indicate that the stock is approaching the oversold territory, which sometimes precedes a potential upward reversal.
- It's important to watch for whether the RSI crosses below 40, as it could reinforce the bearish trend.
4. **Moving Average Convergence Divergence (MACD):**
- MACD signals being below the histogram, especially if the MACD line is trending downwards, suggests bearish momentum.
- This might indicate that the downward trend is strong and could continue in the short term.
### Implications and Potential Strategies:
- **Short-Term Traders:**
- There might be opportunities for short-selling, given the bearish indicators.
- Watch for any bullish signals or a reversal pattern as an entry point for buy positions.
- **Long-Term Investors:**
- It's essential to consider fundamental factors alongside these technical indicators.
- If the fundamentals are strong, this bearish trend could present a buying opportunity. However, caution is advised until there are signs of trend reversal.
- **Risk Management:**
- Given the bearish indicators, risk management is crucial. Setting stop-loss orders can help mitigate potential losses.
### Conclusion:
The technical analysis suggests a bearish trend for Ford Motors stock in the short term, with several indicators pointing to downward momentum. It's crucial for investors to monitor upcoming price movements and news that might affect the stock. Also, integrating this technical analysis with a fundamental analysis of Ford Motors and the broader market conditions is essential for a well-rounded investment decision.
Remember, investing in the stock market involves risks, and this analysis does not constitute financial advice. It's always advisable to consult with a financial advisor before making investment decisions.

$F / FORD PEG Trade IdeaNYSE:F (Ford) Simplified Trading Blueprint
Why Trade Ford: Quick Points
High volume: Lots of trading after earnings report.
Price dropped below $10: Big deal for traders.
Bearish signs: Technical cues predict more drops.
Key Levels to Watch:
Immediate: $10.00 (critical psychological barrier)
Below: $9.56, $9.11, $8.41
Special Note: $10.20 zone (major make-or-break area)
How to Trade: Step-by-Step
Set Up for Success:
Add an Anchored VWAP on the chart, starting from the earnings moment.
When to Jump In:
Price dips below $10? Go short (sell, expecting to buy back cheaper).
But: If it's heading toward the VWAP, pause. Wait for a clear sign.
Protecting Your Capital:
Set a stop loss at the VWAP level shown on a 1-minute chart (e.g., was $10.24 last Friday).
Cashing In: The Smart Way:
First target: $9.56. Hits it? Great! Sell half to lock in profits.
Move your stop loss to where you entered the trade (break even). You're now playing risk-free!
Holding On for More?
Still got half your position? Watch those lower levels ($9.11, $8.41) for more profit-taking.
What If Things Change?
Price climbs above the VWAP or starts hovering around $10.20? Be alert! Big decisions happen here.
If it starts breaking through the bearish patterns, that's the market telling you something new.
Golden Rules: Keep These in Mind
Trading's not about certainties; it's about playing the odds smartly.
Stick to the plan, but be ready to adapt. Conditions change fast.
Most importantly, don't risk more than you can afford to lose. There's always another trade.

F Ford Motor Company Options Ahead of EarningsIf you haven`t bought F here:
or sold before the previous earnings:
Then analyzing the options chain and the chart patterns of F Ford Motor Company prior to the earnings report this week,
I would consider purchasing the 11.50usd strike price Puts with
an expiration date of 2023-10-27,
for a premium of approximately $0.31.
If these options prove to be profitable prior to the earnings release, I would sell at least half of them.
Looking forward to read your opinion about it.

F 5/13/2023F
F me? No F you!
Daily chart analysis
The current Ford chart has a very familiar look to it. If you pull the BTCUSD and look at the period between Dec. 2017 – Nov. 2018, you will see the noticeable similarities.
You have a Parabolic move to higher prices, a crash back down, following by price forming a descending triangle with lower highs into support level.
The BTCUSD descending triangle broke down and price continued crash to lower prices. I am expecting the same to happen here.
Downtrend + Descending Triangle (Bearish pattern) = Short trade. This will be my cue to enter trade short.
Entry: 11.67
Stoploss: 13.20 (-13.11%)
Target: 6.00 (+48.59%)*, 3.71 RR Ratio
*Initial target is 6.00 but price could go as low as 4.75

Long Entry, excellent buying opportunityI know the whole UAW strike is a thing, but technical analysis-wise this is an excellent entry point. Write puts, buy calls do whatever.
Use a stoploss please
thanks

$F: Going sub 11.34 would be the kiss of deathI think NYSE:F offers a very low risk short opportunity here, it merely needs to break under $11.34 to cascade down into a waterfall decline...
Technical chart targets are clear, and indicate a substantial drop can take place, aided by declining fundamentals in the shape of UAW strikes and a rising trend in Union bargaining power, combined with rising costs for materials and declining sales in the face of NASDAQ:TSLA demolishing legacy competition make this a compelling short.
In short: a sh#tstorm coming for ICE makers. We could see many bankruptcies in legacy automakers.
Best of luck if taking the trade.
Cheers,
Ivan Labrie.

Ford's (F) Q3 Earnings to Get a Boost From Blue and Pro SegmentsFord F is set to release its third-quarter 2023 results on Oct 26, after the closing bell. The focal point of the auto giant’s earnings release will be its global wholesale volumes from the Ford Blue and Ford Pro segments.
Q2 Highlights
Ford reported adjusted earnings of 72 cents per share for second-quarter 2023, which beat the Zacks Consensus Estimate of 51 cents and increased from 68 cents recorded in the year-ago quarter. Higher-than-expected automotive revenues resulted in the outperformance. The company’s consolidated second-quarter revenues came in at $44,954 million, rising 11.8% year over year.
In the second quarter, total wholesale volume in the Ford Blue and Ford Pro segments increased 7% year over year to 720,000 units and 8% year over year to 365,000, respectively. EBIT from Ford Blue and Pro units came in at $2,308 million and $2,391 million, respectively.
Ford reported adjusted free cash flow (FCF) of $2,919 million during the quarter. It had cash and cash equivalents of $26,406 million as of Jun 30, 2023. Long-term debt, excluding Ford Credit, totaled $19.17 billion at the end of the second quarter of 2023.
Factors at Play
While Ford Blue focuses on the firm’s legacy gas-powered business, Ford Pro deals with commercial vehicles and services. Expected higher year-over-year growth in global wholesale shipments and adjusted EBIT from these segments are likely to have positively impacted Ford’s upcoming results.
Our estimate for global wholesale shipments from Ford Blue and Ford Pro segments is pegged at 750,000 and 382,000 units, suggesting a year-over-year uptick of 1.2% and 19%, respectively. Our forecast for third-quarter Ford Blue and Ford Pro adjusted EBIT implies an uptick of 6.2% and a whopping 370.1% on a year-over-year basis.
The combination of Ford Pro's strong order books and the successful launch of the all-new Super Duty set the stage for promising results for the Ford Pro segment. In the quarter under discussion, Ford's commercial vans, led by the Transit van, continued to perform strongly. Transit van sales surged by 28.3%, with 34,006 vans sold, maintaining its position as America's top-selling commercial van. Ford E-Series vans also saw a 13.4% increase in the third quarter. Ford held the top spot in commercial sales, with a 40.5% market share, up 2.1% from the previous year. The Ford Pro segment is expected to have benefited from high demand for E-Transit vans. In the third quarter, the California Vanpool Authority (CalVans) announced the purchase of over 400 new Ford E-Transit vans through Model 1, a leading electric school bus distributor, expanding its fleet by 40% and reducing its fuel and CO2 emissions in California.
Ford Blue segment is set to reflect benefits from high ICE-powered vehicles, which rose 5.4% year over year to 444,681 units in the third quarter of 2023. Notably, the 2024 Ford Mustang debuted in August and for the third quarter, it recorded 9,844 sales, with the first full month of sales occurring in September. Notably, 67% of the Mustang's third-quarter sales, equating to 6,575 units, were realized in September.
Overall Earnings & Revenue Projections
Our proven model predicts an earnings beat for Ford as it has the right combination of a positive Earnings ESP and a favorable Zacks Rank. You can uncover the best stocks to buy or sell before they’re reported with our Earnings ESP Filter.
The company has an Earnings ESP of +14.57% as the Most Accurate Estimate is pegged 6 cents higher than the Zacks Consensus Estimate. F currently carries a Zacks Rank #3 (Hold).

FORD, F, to target 11.95, 12.1 soonFORD , NYSE, on the 30-min chart is showing a positive signal for rebound to 11.95, and then target 12.1 soon.
RSI technical indicator is in the buy area
The red Stop Loss line (support line) should be considered.

