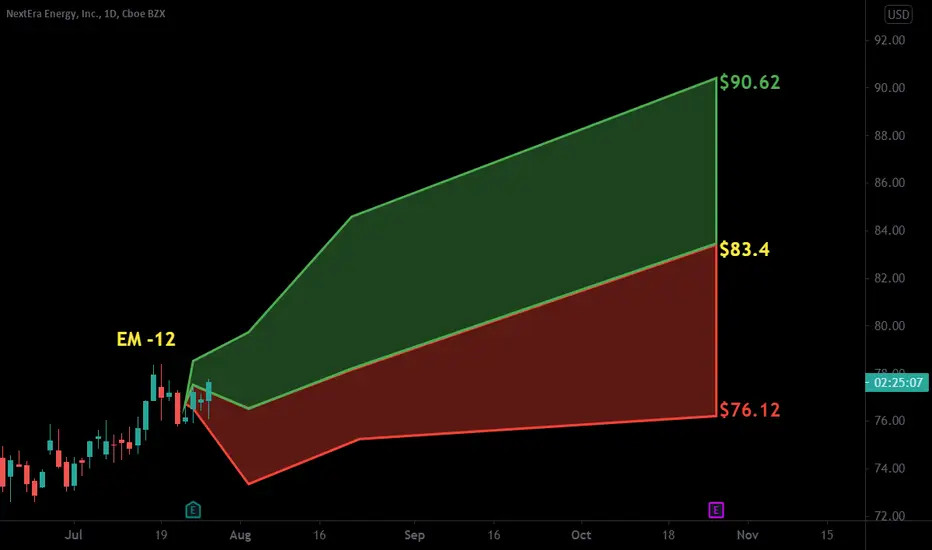
$NEE with a Bullish outlook following its earnings #Stocks The PEAD projected a Bullish outlook for $NEE after a Positive Under reaction following its earnings release placing the stock in drift A with an expected accuracy of 77.78%.
If you would like to see the Drift for another stock please message us. Also click on the Like Button if this was useful and follow us or join us.
Trade ideas


NextEra Energy (NEE) Ascending ChannelNEE was operating in an ascending channel until September 17, 2021. Technical Analysis for NEE is hard to pinpoint due to energy sector volatility.

NEE Daily TimeframeSNIPER STRATEGY (new version)
It works ALMOST ON ANY CHART.
It produces Weak, Medium and Strong signals based on consisting elements.
NOT ALL TARGETS CAN BE ACHIEVED, let's make that clear.
TARGETS OR ENTRY PRICES ARE STRONG SUPPORT AND RESISTANCE LEVELS.
ENTRY PRICE BLACK COLOR
TARGETS GREEN COLOR
STOP LOSS RED COLOR
DO NOT USE THIS STROTEGY FOR LEVERAGED TRADING.
It will not give you the whole wave like any other strategy out there but it will give you a huge part of the wave.
The BEST TIMEFRAMES for this strategy are Daily, Weekly and Monthly however it can work on any timeframe.
Consider those points and you will have a huge advantage in the market.
There is a lot more about this strategy.
It can predict possible target and also give you almost exact buy or sell time on the spot.
I am developing it even more so stay tuned and start to follow me for more signals and forecasts.
START BELIEVING AND GOOD LUCK
HADIMOZAYAN

NEE Wave 5 Continuation NEE, a renewable clean energy leader completed wave 4 and is moving towards a continuation after possible rejection at resistance and a continued push toward PT 100

Cup and HandleNEE is not quite to long entry level of 87.79. Golden cross below as the 50 crossed up and through both the 100 and the 200 SMA. Price is way above the 50 SMA, and price is sometimes drawn a bit closer to this moving average.
Price has been over the upper Bollinger band but has dropped back inside and now pushing over the top band today showing heavy buying pressure. Price tends to return to the interior of the bands eventually.
This pattern is only valid over long entry level as there will likely be resistance there.
Negative volume is very high.
No recommendation. NEE's cohort NEP is also moving.

NEEHigh rick of a pullback, but shouldn't go too deep down, unless consistently breaks 20ema and Fibo

NEE PUT opportunityWe are seeing a text book setup of bearishness on NEE. Buying momentum has been decreasing, Willy oscillator indicating a sell, and while the weis wave also displaying a lack of buying volume showing a lack of interest towards the long side on NEE. We are seeing a Fibonacci cluster around 78-80 allowing for a safe exit on NEE puts.
Bearish Signals
-Squeeze indicator
-Willy Oscillator
-Weis Wave
Price Target
-78-80

Triangle Breakout & Earnings PlayHave been watching NEE for quite some time now as it has earnings coming up on 7/23', personally am bullish-
- Symmetrical triangle
- Bollinger Bands squeezing
- EMAs curling (not pictured)
- Spike in buyer volume EOD on Friday
- UOA- Unusual Options Activity (Bullish Sweep, January 2023' $100 strike)
PT1- $79.15
PT2- $80.25
PT3- $81.50+

NextEra Energy looks like its in need of a retracementNEE looks like a really interesting stock at the moment. Based on the quant signals it looks like its in need of a retracement before any meaningful upward move thereafter. The company appears to have a relatively strong balance sheet and provides a range of services within the renewable energy sector including power generation from wind, solar and natural gas. Could this be a stock to hold for the next 3-5 years?
Thematically lets just say that renewable/clean energy continues to be a growing industry globally. What fascinates me it how cheap and readily accessible the technology should be in the next 10 years. Someone or a group of monopolistic companies will need to lead that drive. NEE looks like it could be one of those players.
To be clear i think a short term retracement is on the cards based purely on the quant signals. Beyond that i think it could be a great company to hold in one's portfolio. For that reason my investment strategy is "Neutral" as it consider both the down and the upside over different time frames.
Please like and follow. Please also share your views on the trading ideas and whether or not you find them to be of any value to you as a trader.
Please note, this idea is shared for educational and discussion purposes only and should not result in speculative investment decisions in any asset class.

$NEE with a Bullish outlook following its earnings #Stocks The PEAD projected a Bullish outlook for $NEE after a Positive under reaction following its earnings release placing the stock in drift A
If you would like to see the Drift for another stock please message us. Also click on the Like Button if this was useful and follow us or join us.


3 drivers pattern on NEE intraday swing off bounce or breakout Interesting scenarios for Monday at opening .
Possible 3 drivers pattern.
Cheers.

$NEE BreakoutNextEra Energy shares have broken that key resistance trendline which indicates a breakout to the upside. I am a strong believer in clean energy this year! Good Luck!


Energy Sector $NEE$NEE nice action today re-took all SMA and close above the 50SMA a close above $75.85 will signal a higher move $78 target.
Playing this set up with a option call contract. Earnings 7/28
NYSE:NEE

NEE Bullish BreakoutVery nice trend line breakout with perfect MACD alignment.
Love the small retracement bar gathering energy before the next pop.
Buy entry above today's high of $73.60


NEE Approaching Another Double Bottom with Bullish Divergance?Read the chart.
Looks like NEE could hit a double bottom indicating a reversal and possibly an uptrend. We might see this push towards the $80 resistance line.
On the RSI their appears to be a weak bullish hidden divergence. I only say weak because it isnt that drastic of a "higher low" on the price chart or that big of a delta (difference in change) on the RSI.
But price the next few days could help guide us for an easy swing trade. from $71.50 to $80.
Me personally I buy longer expiration options somewhat deep in the money for stocks like this that have good fundamentals and outlook.


