General Mills - Bearish RS & Trends = Continuation Lower to $37The bearish DailyPlay we chose for Wednesday, May 23rd is General Mills (GIS). GIS is part of the Consumer Staples Sector (XLP). Over the last month, XLP has experienced a 1.53% move lower and its 1m and 6m trend turned bearish yesterday and recently bounced lower off its $50 resistance level.
General Mills' 1m and 6m trends turned bearish on 4/18 and recently bounced lower off its $44 resistance level. With a technical score of 1 (out of 10), GIS is a weak stock that will likely trend lower.
As a stop loss, if GIS was to trade above $44 for multiple days, this would invalidate our analysis and suggest getting out of the trade.
OptionsPlay Trade Idea:
Buy to Open 1 GIS Jul 20 37.5/42.5 Put Vertical @ $169 - app.optionsplay.com
Cost: $169
Max Reward: $331
Max Risk: $169
POP: 40.61%
Breakeven: $40.81
Trade ideas

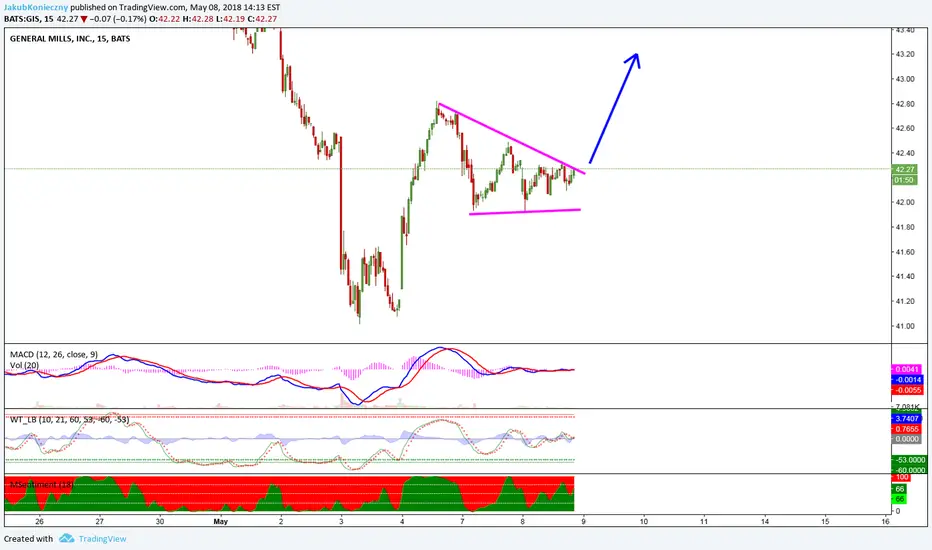
General Mills (NYSE: GIS) May 7, 2018GIS is a dividend fortress. The company has been in business for over a 100 years. Due to missed earnings, I believe that the stock has been oversold. This seems to be a good entry point before the next earnings report.


General Mills Climbing up those hills A bullish bet is placed on General Mills (GIS: 58.43$):
1) Bounced off support level at 57.75$;
2) EMA 50 crossed above EMA 200;
3) RSI correcting at lower levels while price at higher ones ( check Black arrows). Indicator that price is in a hurry to resume the uptrend.
Target Price: 60.10$ then 61.30$
Stop level: a 2 days close below 57.75$ and or a 2% Intra Day below it at 56.60$

GIS Creating New WK Demand ZonesFresh WK Demand zone now available on GIS, will be looking to go long if price retraces to there.
Long bias on a stock that is not at all time high's, hard to find right now :)
Happy Trading All!

General Mills: Short Again, or a Looming Breakout?#stock is looking up. Can it clear $58.50 for Bullish turn? $XLP #trading

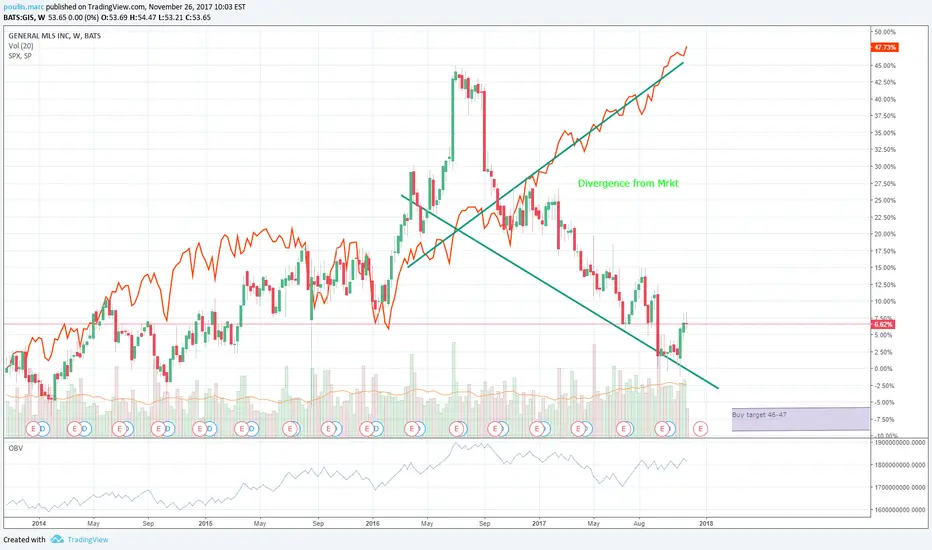
GIS - Divergence from S&P500GIS is a stock I like for it's stability and dividend, I have owned it since 2009 and will continue to hold as long as the dividend (3.7%) remains stable.
The chart shows a divergence that are linked to the fundamentals of the company. Future Growth is negative and Management appears to be wallowing.
The positive signs:
Ichimoku 4/5 +
rumors of take over from Nestley (premature),
stable on-balance-volume
very little insider trading
ROE is outstanding
The negative:
P/B is above 7, I would like to see it below 5.
My target price for adding is $46 - $47, and I will hold long .

Short at the Teal line, or bottoming action? ..General Mills could be bottoming. $XLP #consumer #staples

Stochastic Divergence TL BounceGIS has moved down a parallel channel to trend line support. The stochastic divergence is signaling a move back up that should happen at the end of this consolidation period.
Buy: 52.00
Stop: 51.00 (Trend Line)
Target: 53.22 - 54.97 (2.35% - 5.71%)


Long term investment! Lets hope price come to my target! good stock to buy for long term investment.. price is around 50% Fib


Sell GIS her...stop at 57.24 ....aim for a 5 to 1 trade marketprofile based breakout to the downside


GIS - POTENTIAL BOTTOMMultiple Signals of a potential bottom from one of my dBFIs on the DAILY chart
Awaiting confirmation (close above sma14).Signal valid for 2 weeks.

$GIS 57.65 , will TL from weekchart HOLD? Wait to see.General Mills $57.65 , will TL from weekchart HOLD? Wait to see. News: Fitch put General Mills BBB+ outlook on negative outlook from stable

