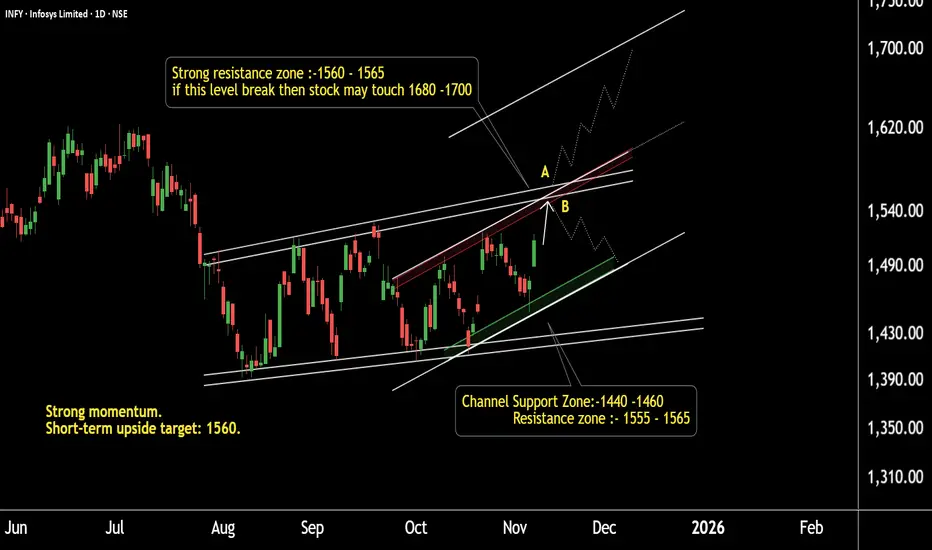
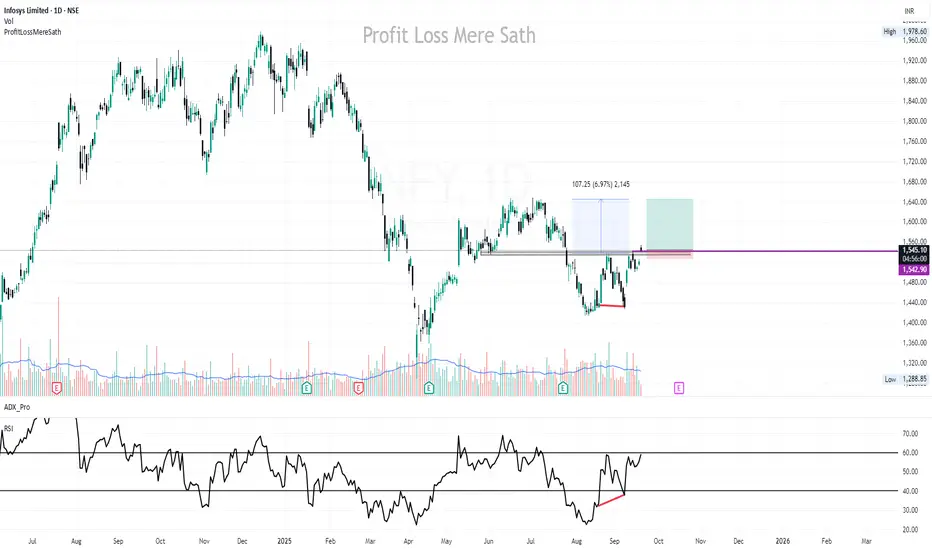
INFY Battle Zone: Levels That Decide the TrendThis is the daily timeframe chart of INFY.
The stock has a strong support zone near 1410 and 1440.
It is facing major resistance within the short-term and mid-term channel around 1555–1565.
Currently, INFY is trading near 1520, and the ongoing move may extend toward 1560.
If the stock fails to b
Key facts today
Next report date
—
Report period
—
EPS estimate
—
Revenue estimate
—
0.672 EUR
2.92 B EUR
17.82 B EUR
4.15 B
About Infosys Limited
Sector
Industry
CEO
Salil S. Parekh
Website
Headquarters
Bangalore
Founded
1981
ISIN
US4567881085
FIGI
BBG000JZ2C75
Infosys Ltd. is a digital services and consulting company, which engages in the provision of end-to-end business solutions. It operates through the following segments: Financial Services, Retail, Communication; Energy, Utilities, Resources, and Services; Manufacturing, Hi-Tech, Life Sciences, and All Other. The company was founded by Dinesh Krishnan Swamy, Senapathy Gopalakrishnan, Narayana Ramarao Nagavara Murthy, Raghavan N. S., Ashok Arora, Nandan M. Nilekani, and S. D. Shibulal on July 2, 1981 and is headquartered in Bangalore, India.
Related stocks
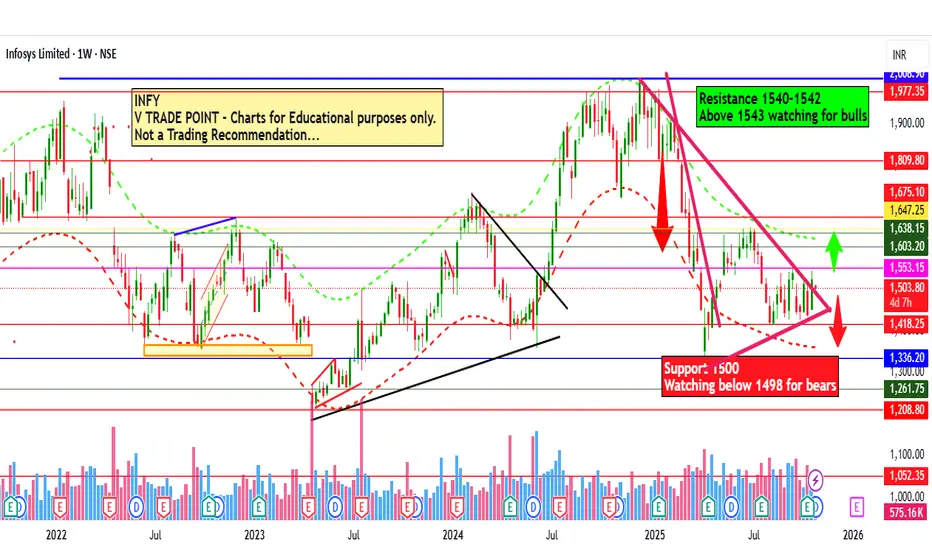
Infosys Ltd for 27th Oct #INFY Infosys Ltd for 27th Oct #INFY
Resistance 1540 Watching above 1542 for upside momentum.
Support area 1500 Below 1520 gnoring upside momentum for intraday
Watching below 1498 for downside movement...
Above 1520 ignoring downside move for intraday
Charts for Educational purposes only.
Please foll
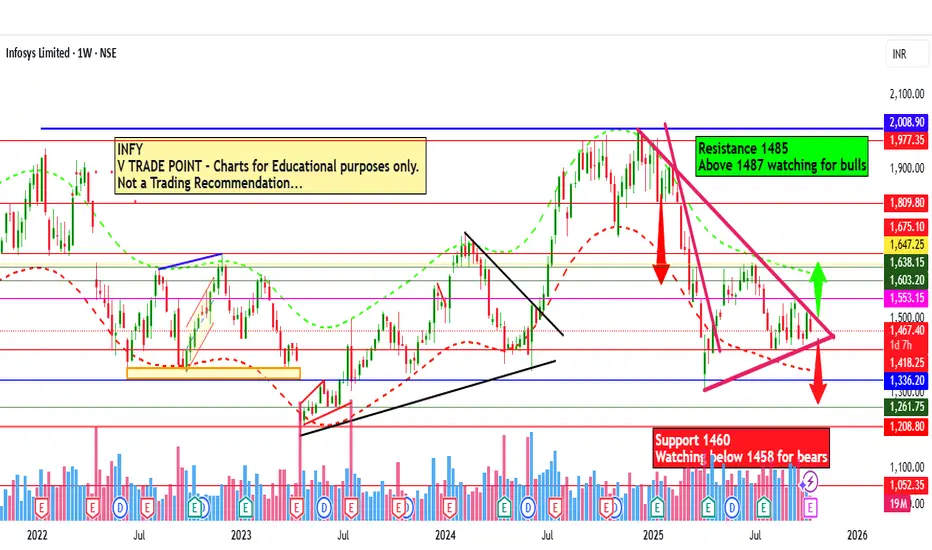
Infosys Ltd for 16th Oct #INFY Infosys Ltd for 16th Oct #INFY
Resistance 1485 Watching above 1487 for upside momentum.
Support area 1460 Below 1460 gnoring upside momentum for intraday
Watching below 1458 for downside movement...
Above 1480-1485 gnoring downside move for intraday
Charts for Educational purposes only.
Please f
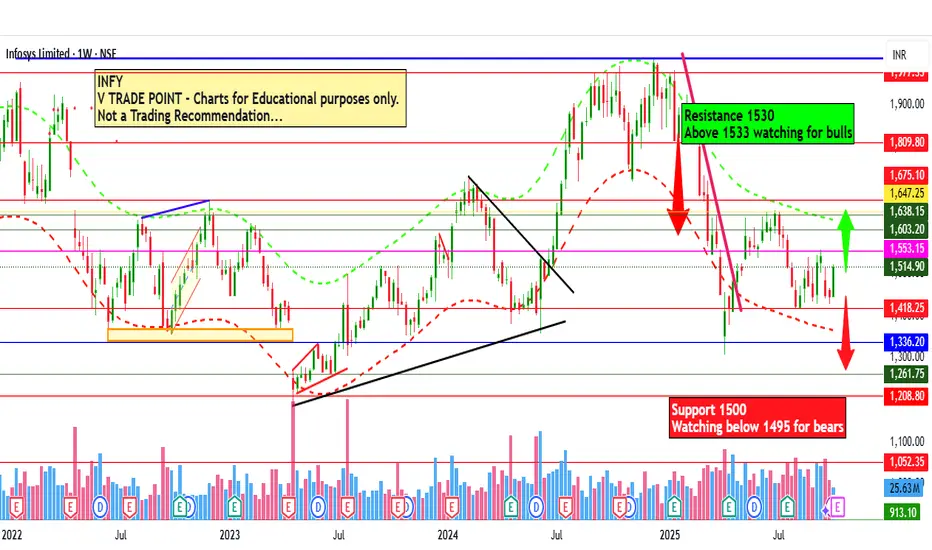
Infosys Ltd for 13th Oct #INFY Infosys Ltd for 13th Oct #INFY
Resistance 1530 Watching above 1533 for upside momentum.
Support area 1500 Below 1515 gnoring upside momentum for intraday
Watching below 1495 for downside movement...
Above 1520 ignoring downside move for intraday
Charts for Educational purposes only.
Please follo
Infosys Ltd for 9th Oct #INFY Infosys Ltd for 9th Oct #INFY
Resistance 1500 Watching above 1503 for upside momentum.
Support area 1480 Below 1480 gnoring upside momentum for intraday
Watching below 1478 for downside movement...
Above 1500 gnoring downside move for intraday
Charts for Educational purposes only.
Please follow

INFY Turning Bullish: IT Giant Ready for the Next Leg UpINFOSYS — 1 Hour Timeframe Analysis
INFY is showing strong momentum after respecting its support zone around 1400–1420. The stock has rebounded well and is now approaching its resistance zone near 1580–1590.
The Supertrend indicator is displaying a positive bias, while the MACD has confirmed a bul

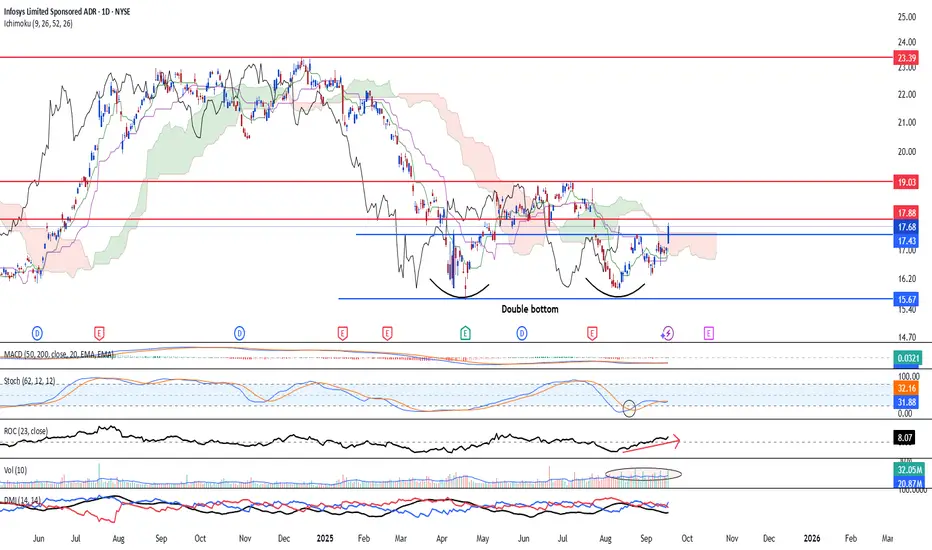
INFY | Buy @LTP | RSI Divergence & Dbl Bottom |Buy @ LTP | RSI Divergence & Dbl Bottom | SL below 1535 on closing basis | 1st Target 1650
Disclaimer:
This is not financial advice. Please do your own research or consult with a financial advisor before making any investment decisions. Investments in stocks can be risky and may result in loss o
Double bottom in play potentially for InfosyNYSE:INFY has formed a double bottom formation and on the 2nd bottom, the stock has formed an internal pair of higher high and low, indicating bullish pressure may be back. Ichimoku has shown two out of three bullish crossover and candle has closed above leading span A, just pending a kumo twist to
Review and plan for 11th September 2025Nifty future and banknifty future analysis and intraday plan.
Stock ideas for intraday.
This video is for information/education purpose only. you are 100% responsible for any actions you take by reading/viewing this post.
please consult your financial advisor before taking any action.
----Vi

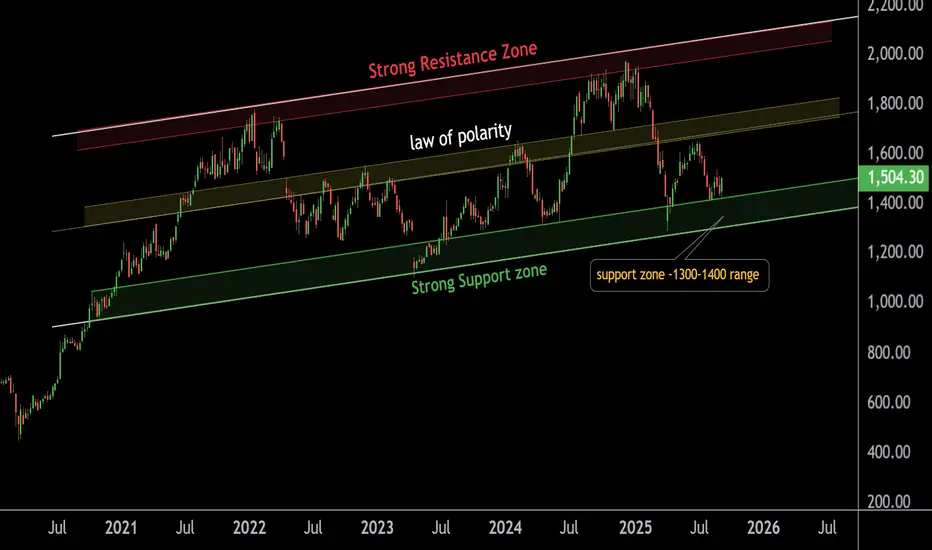
Infosys Holding Strong at Powerful Support – Big Move AheadThis is the weekly chart of Infosys (INFY).
INFY is currently trading within an ascending parallel channel, with a strong support zone in the ₹1300–₹1400 range.
The stock has shown a bounce from this level, offering traders and investors a favorable opportunity to accumulate.
If this support sus
See all ideas
An aggregate view of professional's ratings.
Neutral
SellBuy
Strong sellStrong buy
Strong sellSellNeutralBuyStrong buy
Neutral
SellBuy
Strong sellStrong buy
Strong sellSellNeutralBuyStrong buy
Neutral
SellBuy
Strong sellStrong buy
Strong sellSellNeutralBuyStrong buy
Displays a symbol's price movements over previous years to identify recurring trends.
Curated watchlists where IOY is featured.

Indian stocks: Racing ahead
46 No. of Symbols
See all sparks