double top/three drivesWatching for intraday reversal blowoff top to 272.50 - 274 on Monday here to complete the inv H&S pattern and retest the double top. A reversal followed by a close below 271.50 would absolutely confirm the theory. A close above 275 would invalidate it.
PT is 250 at the .618 retrace by possibly as soon as the following Monday. Fundamentals are based on the Fed tanking the markets this Tues/Wed as expectations for a rate cut are severely dashed. Almost all daily momentum indicators are showing bearish divergence so if not this week then just a matter of time. I think this stock will hit 250 before Aug opex.
ITU trade ideas

INTU just exited resistance If INTU holds above resistance opportunity to sell spread above zone. Bullish on company and industry overall

aiming the fifth waveI think theres a chance that the fifth wave is over given the we are at the bottom of the pitchfork and there is divergence in 15 min time frame , so i think of aiming the fifth wave, at the top of the pitchfork

aiming for wave 4we are at the top of the pitchfork, i think theres a good chance foe aiming for wave 4 to happen now. id be more confident in this trade if there were diversions present. well see

$INTU AS LONG AS THERE IS TAXES, INTUIT WILL THRIVE.Poor and unfortunate timing brought about the selling in NASDAQ:INTU Thursday. Post results the market has drove the stock higher in the after hours Wednesday, as the company beat on earnings and revenue and then raised full year guidance. This rally was short lived as the market had a horrendous day of selling on high volume. If the market stabilises we will look at a possible long entry into the stock.
COMPANY DESCRIPTION
Intuit, Inc. is a financial management and compliance platform company, which engages in the provision of business and financial management solutions. It operates through the following segments: Small Business and Self-Employed; Consumer; and Strategic Partner. The Small Business and Self-Employed segment offers QuickBooks financial and business management online services and desktop software, payroll solutions, payment processing solutions, and financing for small businesses. The Consumer segment includes do-it-yourself and assisted TurboTax income tax preparation products and services. The Strategic Partner segment comprises professional tax offerings, which include Lacerte, ProSeries, ProFile, and ProConnect Tax Online among professional accountants.


INTU: Sort opportunityAn intraday high potential, Back Tested Sort Analysis.
We ll try to enter into the correction of the uptrend movement.
DETAILS ON THE CHART
NOTE: Entry range area above the entry point, is calculated upon 80% of the recorded pullback back tested past performances
DISCLAIMER: This is a technical analysis study, not an advice or recommendation to invest money on.


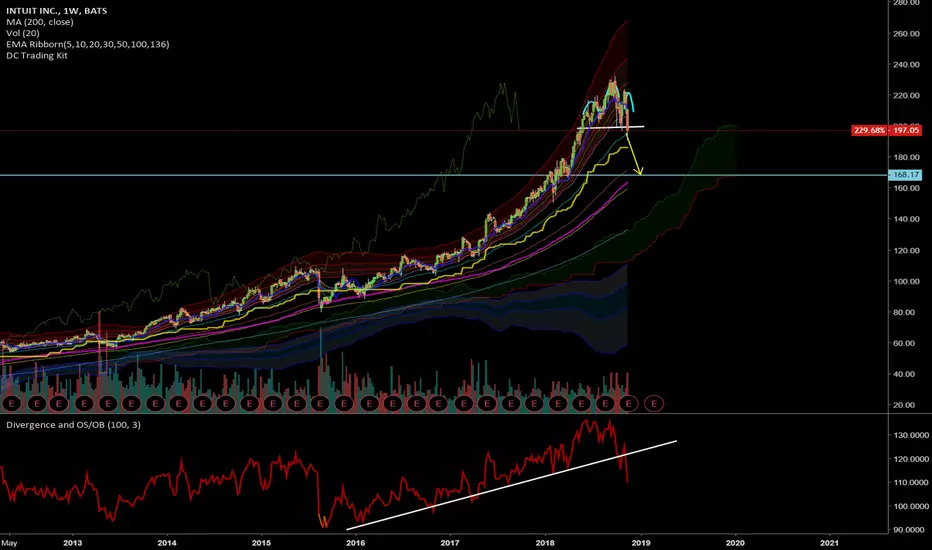
Short INTUWeekly breakdown both indicator and trendline. Retesting broken trendline now, initiate short, TP ~168
$INTU Short Setup$INTU just broke support with 2.40 times average volume.
More downside could follow.


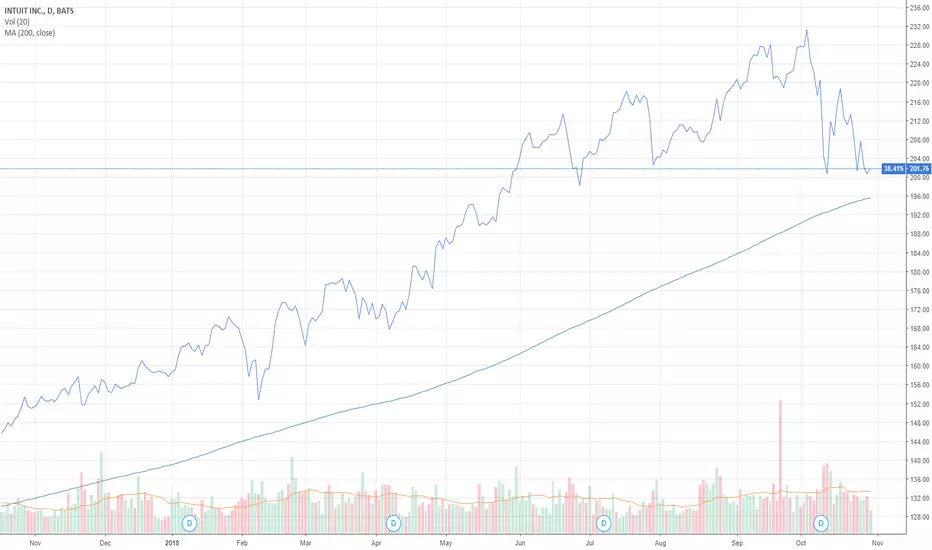
INTU holding its 200dmaINTU has a strong history of growing dividends since 2011. This pullback, with the market, is still holding its 200dma. The long-term uptrend is still intact.
Disclosure: long INTU

INTU Short Setup PossiblePossible breakdown on INTU if SPY continues its downtrend. May fall below neckline and if the bounce back is weak there is a good short setup.

Intuit Inc - LongStrong upward trend with high momentum.
Price is consolitating, however, buyers seem to be strong (i.a. recent downward candlestick has deep lower shadow). Therefore speculating on upward break with strong momentum.
If price does come back to 119.50 a long position will be taken.


INTU – LIKELY TO HIT FRESH HIGHThe “Bullish Harami Cross” implies that the buyers are in control, Stock is trading firmly above the 20-day and 40-day MA lines, A buy signal appears in the MACD indicator, Potential uptrend above the 50 pts on the 14-day RSI indicator: Price may break above the USD220.


INTU Ascending Triangle + New CEO- Days ago Intuit has a new CEO and weathered a significant org change without the stock taking a hit
- Resistance ~$217
- Break above resistance could push the stock into new highs

