$MCHP Ready to Break Downtrend?NASDAQ:MCHP is heavy into automotive chips along with many other industries as well. When looking at the chart I see that we have a longer-term double bottom formation that put into play an Undercut and Rally on Nov 2nd, which was the earnings date. That is technically still in play.
It looks like it will break out of the downtrend line today where I have an alert. I like the accumulation volume before and after earnings. NASDAQ:MCHP has regained the faster moving averages but is still below the 50 DMA in red and the 40-week MA in white. The MACD turned up just 3 days ago.
Lastly, NASDAQ:MCHP has either been reiterated or upgraded to either “Buy” or “Outperform” by at least 4 different analysts in the last few days. The average price target is $101.
Ideas, not investing / trading advice. Comments always welcome. Thanks for looking.
Trade ideas

Microchip Technology Incorporated at support levelMicrochips are ever needed for hardware development companies so Microchip Technology Incorporated is pretty sure investment especially as MCHP is at 10 months up slopping support line now - best moment for accumulation.
Recommended entry price: 77.50
Target price 1: 89.00
Target price 2: 100.00
Stop loss: 75.00

MACD Buy. Retest Support. Target Next Resistance1. MACD Buy.
2. Retest Support.
3. Target Next Resistance

Rise RetracedThe rise since June 23rd has been retraced by about 40 %. This level is the range of the first quarter of the year tops and the high of June 15th. I can imagine that from here we may see another race for further highs.

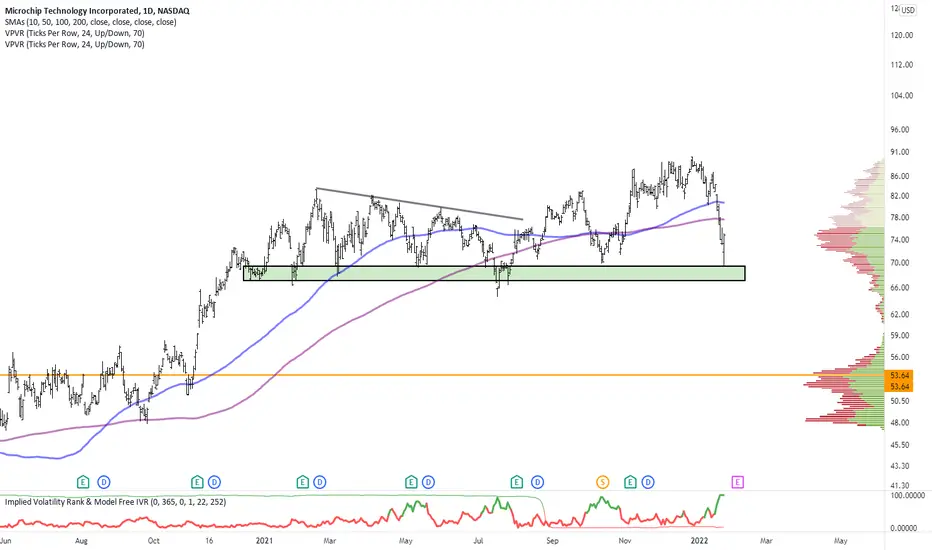
Microchip (MCHP): Next mover; big base breakout watchThis is a copy&paste from a Bank of America Global Research Note:
"MCHP is a semiconductor devices stock that is forming late 2021 into mid 2023 big base. A decisive breakout above resistance at 87-88 and the late 2021 high a 90 would confirm this bullish setup and favor further upside to pattern counts at 104 and 120. Until then, rising 13, 26 and 40-week MAs near 79 to 75 underpin this bullish setup ahead of chart support at 71-70. MCHP is also building a big base relative to the SPX, which is bullish."

SasanSeifi 💁♂️MCHP/ 1D ⏭ $85 ? OR NEW HIGH ?🤔 LET'S SEE✌❗❗HI TRADERS ✌The possible scenario of MCHP is specified.As you can see, it is an upward trend from the range of $55. It is currently in the range of $82. We can expect that the price will grow to the range of $85 if it stabilizes above the support range of $79/$77. According to the formed HIGH and LOW, if the trend is still upward, the possibility of a new HIGH in the long-term view can be considered. We have to see how the price will react to the $85 resistance range.
Note that price stabilization above the $90 range is very important for a new HIGH.
let's see...
❎ (DYOR)...⚠⚜
WHAT DO YOU THINK ABOUT THIS ANALYSIS? I will be glad to know your idea 🙂✌
IF you like my analysis please LIKE and comment 🙏✌

$MCHP with a Bullish outlook following its earnings #Stocks The PEAD projected a bullish outlook for $MCHP after a Negative over reaction following its earnings release placing the stock in drift C.
Its $STM turn to outperformWhenever I find two stocks acting well I always want to buy the best but, how to know this?
Both are forming a shark pattern in the weekly chart, and both are from the same industry, semiconductors.
So how to choose? For me, a simple ratio will do it. It will show which one is outperforming the other.
In this case NYSE:STM is being buyed more aggressively than NASDAQ:MCHP .
I'll wait for the breakout above $51 to get in and use the previous weekly lows for the stop loss.
The thing is that if STM breaks out but NASDAQ:MCHP then something might be wrong.
Always keep an eye on how related stocks behave.

$MCHP Technical Analysis: Stock at Yearly and Monthly HighsYearly High
Stock price is at yearly highs.
Monthly High
Stock price is at monthly highs.
Above Bollinger Band
Price is above the upper 14 day bollinger band. This is mostly a reversal signals
as price has overextended and might come down.
Pivot Machine Gun (PMG)
When price makes continued highs for 5 days. This is a bearish reversal signal
only if price starts to break the low of the last day's candle.
Pocket Pivot
The volume on the green candle today was higher than the volume on any red candles over the last few weeks.
This can signify institutional accumulation.
Parabolic Rise
The stock has stayed above the upper bollinger band for 3 straight days.
Stochastics Overbought
Stochastics value is above 80.

MCHP - Momentum stalling with gap belowMicrochip Technology - Short Term - We look to Sell at 74.14 (stop at 80.98)
Momentum is stalling with the posting of new highs and indicates bearish divergence. Bearish divergence is expected to cap gains. Although the bulls are in control, the stalling positive momentum indicates a turnaround is possible. We look for a temporary move lower. We have a Gap open at 68.66 from 08/11 to 10/11.
Our profit targets will be 55.31 and 48.12
Resistance: 78.04 / 80.00 / 89.58
Support: 68.60 / 55.31 / 47.84
Please be advised that the information presented on TradingView is provided to Vantage (‘Vantage Global Limited’, ‘we’) by a third-party provider (‘Signal Centre’). Please be reminded that you are solely responsible for the trading decisions on your account. There is a very high degree of risk involved in trading. Any information and/or content is intended entirely for research, educational and informational purposes only and does not constitute investment or consultation advice or investment strategy. The information is not tailored to the investment needs of any specific person and therefore does not involve a consideration of any of the investment objectives, financial situation or needs of any viewer that may receive it. Kindly also note that past performance is not a reliable indicator of future results. Actual results may differ materially from those anticipated in forward-looking or past performance statements. We assume no liability as to the accuracy or completeness of any of the information and/or content provided herein and the Company cannot be held responsible for any omission, mistake nor for any loss or damage including without limitation to any loss of profit which may arise from reliance on any information supplied by Signal Centre.

MCHP: Retest of breakout zone?!Microchip Technolog y
Short Term - We look to Buy at 65.63 (stop at 62.70)
Broken out of the triangle formation to the upside. A lower correction is expected. Reverse trend line support comes in at 64.00. Support could prove difficult to breakdown. Dip buying offers good risk/reward.
Our profit targets will be 73.30 and 78.00
Resistance: 74.00 / 90.00 / 120.00
Support: 64.00 / 54.50 / 45.00
Please be advised that the information presented on TradingView is provided to Vantage (‘Vantage Global Limited’, ‘we’) by a third-party provider (‘Signal Centre’). Please be reminded that you are solely responsible for the trading decisions on your account. There is a very high degree of risk involved in trading. Any information and/or content is intended entirely for research, educational and informational purposes only and does not constitute investment or consultation advice or investment strategy. The information is not tailored to the investment needs of any specific person and therefore does not involve a consideration of any of the investment objectives, financial situation or needs of any viewer that may receive it. Kindly also note that past performance is not a reliable indicator of future results. Actual results may differ materially from those anticipated in forward-looking or past performance statements. We assume no liability as to the accuracy or completeness of any of the information and/or content provided herein and the Company cannot be held responsible for any omission, mistake nor for any loss or damage including without limitation to any loss of profit which may arise from reliance on any information supplied by Signal Centre.

$MCHP with a Bullish outlook following its earnings #Stocks The PEAD projected a Bullish outlook for $MCHP after a Positive Under reaction following its earnings release placing the stock in drift A with an expected accuracy of 45.45%.
Let’s share ideas!It is a classic flat pattern. A clear text-book Elliott wave corrective pattern.
Confirmation - consolidation at the top of the structure before the break-out, as well as the break of a flat corrective channel.
Shall we exchange more similar set-ups that you may have identified? Here in the comments section.
Push a like button and follow the post to get notifications, when new ideas appear.
Have a nice week, friends!
Trade safe!

Gap Leading to Channel BreakWith the MACD and Stoch flashing signals of bullish divergence and a gap that has not been filled, it seems likely that MCHP is getting ready to test its channel upper bound. To reach the channel upper bound it must clear another previously two unfilled gaps, the 21EMA and 63EMA.
We are also seeing a cross in the 21Mom, Stoch crossing over sold and the MACD preparing to cross its over sold.
If todays close is above yesterdays we will also see the candle pattern Three White Soliders. Though this pattern tends to warn that the majority of the bullish move is over and waiting for a throwback might be wise.

$MCHP with a Bullish outlook following its earnings #Stocks The PEAD projected a Bullish outlook for $MCHP after a Positive over reaction following its earnings release placing the stock in drift B with an expected accuracy of 83.33%.
Rectangle/Thrusting CandleNeutral pattern until a trendline is broken.
There appears to be a smaller rectangle inside a larger rectangle.
Price is at a resistance level today.
A thrusting candle pattern is formed when a long red candle is followed by a green candle. The green candle closes above the black candle's close, but it doesn't close above the midpoint of the red candle's real body. In the past, this pattern has been known as a bearish continuation pattern, but can also serve as a bullish pattern in some instances. So basically, this candle pattern needs confirmation for sure.
If the green candle did close above the midpoint of the red candle, it would be called a piercing candle.
A piercing pattern is a two-day, candlestick price pattern that marks a potential short-term reversal from a downward trend to an upward trend. The pattern includes the first day opening near the high and closing near the low with an average or larger-sized trading range. The piercing candle pattern is the bullish version of the Bearish Dark Cloud Cover pattern where a red candle closes half way of more (without engulfing) the prior green candle.
No recommendation.
Short percent is less than 1% with 2.1 days to cover.

MICROCHIP TECH (MCHP) Long TradeGood relative strength, insider buying aggressively, breakout confirming consolidation/correction coming to an end and setting up an initial run to $86 for NASDAQ:MCHP


MCHP LONG - Buy Entry - D1 ChartMCHP LONG - Buy Entry - D1 Chart
Buy @ Market
Symbol: MCHP - Microchip Technology Inc
Timeframe: D1
Type: BUY
Entry Price: Buy @ Market
Last High - Resistance @ 88.98
Resistance @ 87.69
Pivot Point Yearly @ 80.36
Resistance becomes Support @ 77.00
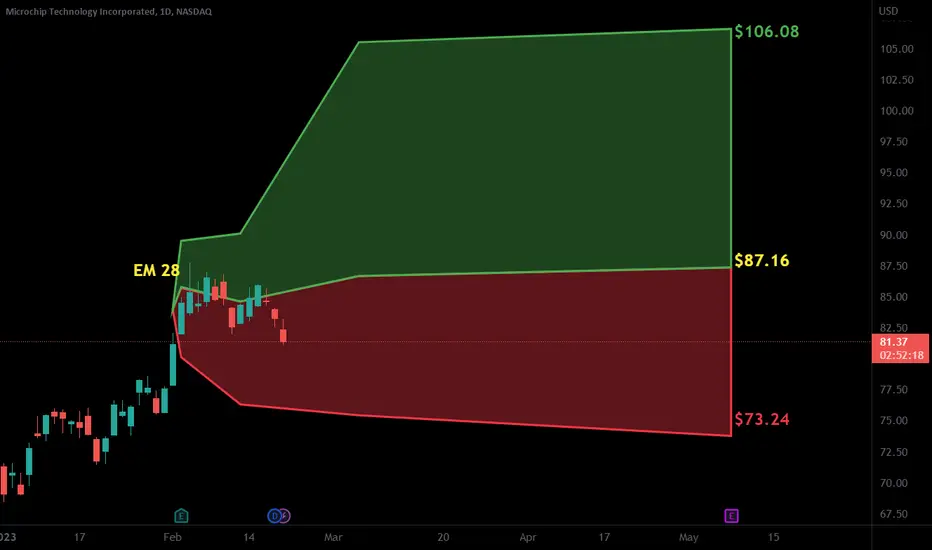
Support @ 73.64
✅ If you liked this analysis, please consider Following and giving it a Thumbs Up 👍
✅ If you have any feedback or questions, please leave a comment below as I answer each comment 💬
✅ Wishing you enjoyable successful trading 🙏

MCHP longMicrochip looks solid. Adjusted Op Er Growth of 17.9%. Blended P/E currently 17.40. Div of 1.27% that sits at about 18% payout ratio. 40 billion dollar market cap. Peg ratio 0.96
MCHP: Consolidation.Consolidation could be broken higher with a minimum target in the region of 200.

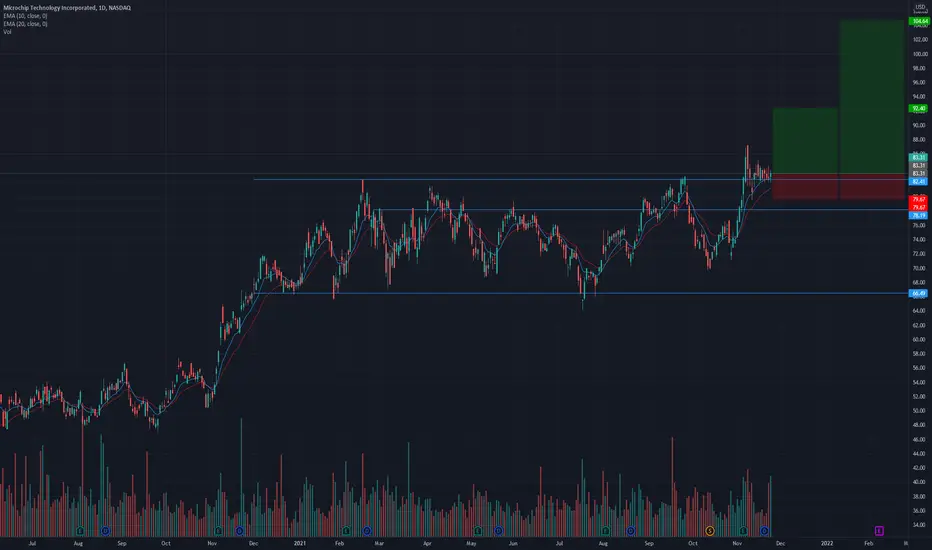
MCHP ready to move higher?* Exceptional earnings
* Very strong up trend
* High 3-month relative strength in the Tech sector
* Broke out of an 11 month range on November 4th
* Since the breakout it has been consolidating above the broken level making it a new support
* Maximum probable ROI would be 25.60% if the trade goes in our favor
Trade Idea:
* Now's a great time to enter as the price is really close to the broken level and the volume shows institutional interest after 2 weeks of tight consolidation.
* If you're looking for a slight discount you can look to buy near the $82.40 area as that has been serving as support for the past ~13 days
* Consider taking partial profits at $92.40
Caution:
* A daily close below $82.41 could put this idea in trouble.
* Consider exiting the trade early if the price make 4 consecutive lower lows on a daily basis
MCHP LongConsolidation Breakout + retest
Entry 83.6
Stop 81.3
Target 94
Risk management is much more important than a good entry point.
I am not a PRO trader.
In my trading plan, the Max Risk of each short term trade should be less than 1% of an account.
