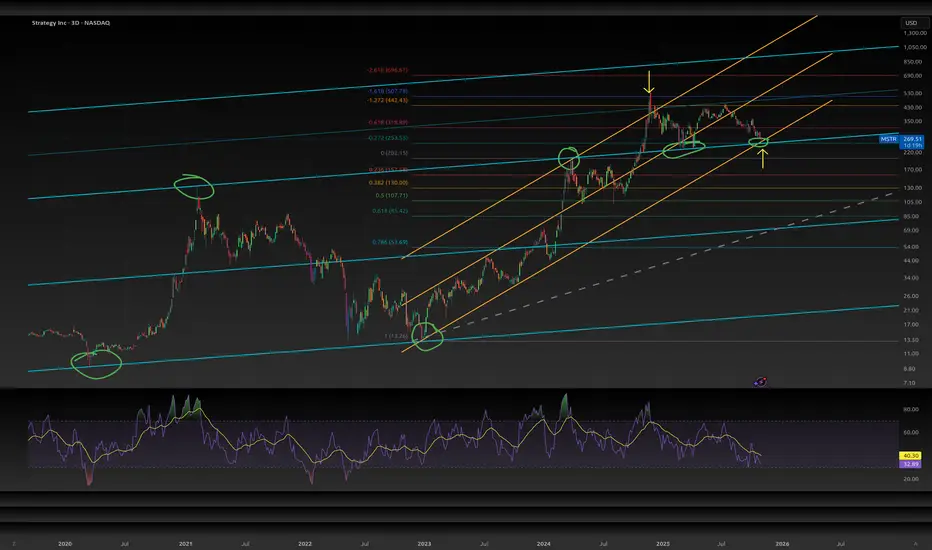
MSTR is on a point of significant confluenceMSTR is on a point of three major confluences. To lose this level would mean we are going much lower. However, I expect at least a significant bounce from here.
we have the blue channel that previously acted as resistance and recently turned into support.
we have the current orange channel
we have the -.272 fib level, after hitting the -1.618 Nov 2024
RSI also looks like a bottoming pattern, but that needs to play out some more to be confident.
I would not be surprised if we retest the underside of the -.618 around $315 in short order. If we lose this level, it could get really nasty to the downside.
Trade ideas
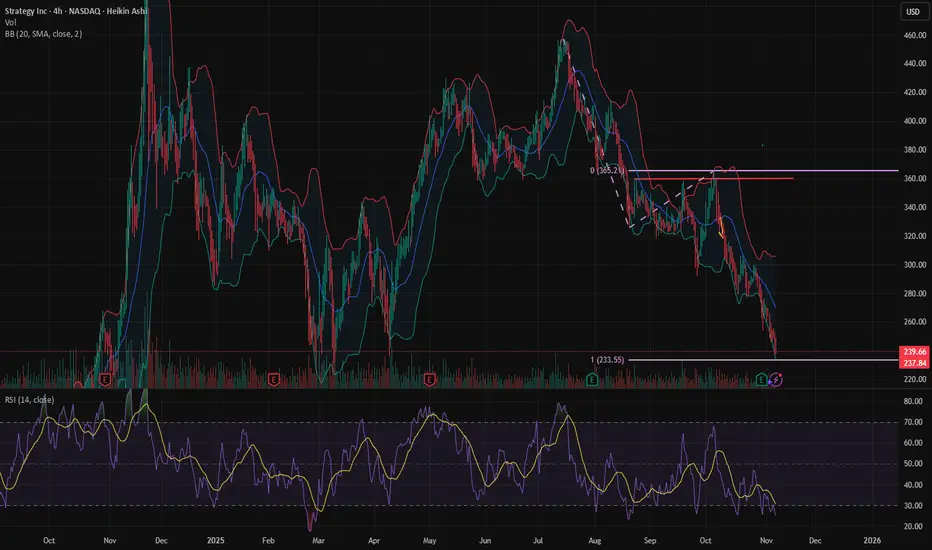
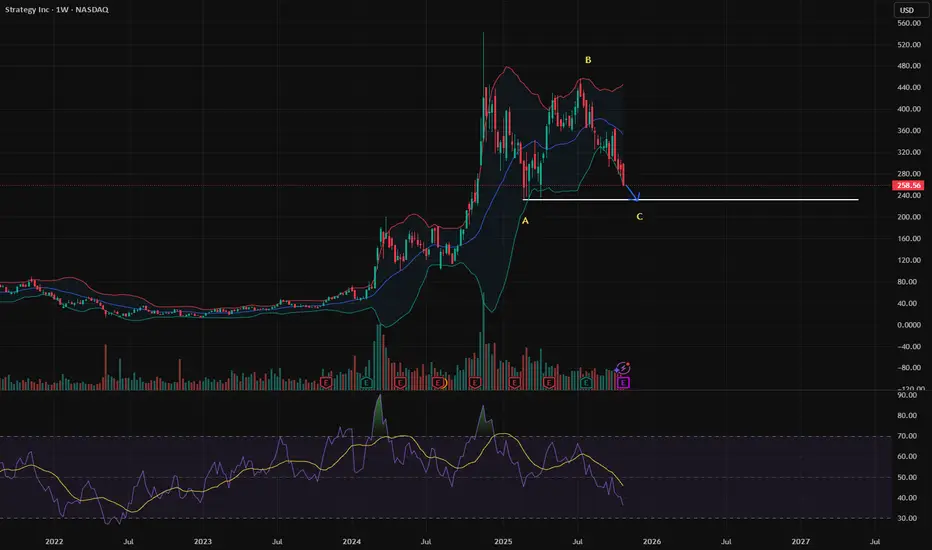
$MSTR: AB = CD target almost reachedNASDAQ:MSTR : the AB = CD targets $233 and today's low is $236.86. Very close. If NASDAQ:MSTR can bounce here, or fake breakdown to 233 or lower than bounce back, it would be good for Bitcoin. I don't own NASDAQ:MSTR shares and don't plan to trade this name. I'm looking at NASDAQ:MSTR as another data point to gauge bitcoin.
MSTR further downside but looking exhaustedNASDAQ:MSTR Price continues range bound in a complex wave 4 correction, notoriously hard to analyse. The trend is down but looks exhausted.
Wave Y can complete any time in this flat correction pattern but is approaching the previous swing low and the 0.236 Fibonnacci retracement.
Daily RSI has printed bullish divergence but price continues lower. IF pice breaks down further the next target is $185 where price may find a bottom.
Recovering the daily 200EMA is the first goal.

History Seems to Be Repeating on MSTR
Lately, I’ve been noticing something interesting on MicroStrategy (MSTR) — the price action appears to be forming a structure very similar to what we saw earlier in the chart.
⸻
🟨 Repeating Consolidation Zones
Looking back, the first highlighted zone (around early 2024) shows how price moved sideways for a while after a strong rally. That consolidation eventually resolved in a sharp move upward once momentum returned.
Now, if we look at the current structure (mid-to-late 2024 into 2025), the setup looks quite familiar. After another strong upward phase, price has again been consolidating in a broad range roughly between $250 and $450.
⸻
🧩 Observing the Fractal Behavior
This kind of repeated structure—where a period of consolidation follows a strong expansion—often suggests that market participants are adjusting to previous volatility and finding equilibrium before the next major phase.
While past movements don’t predict future outcomes, it’s interesting to note how similar the rhythm of this current range is compared to the previous one. It almost feels like the market is “echoing” its earlier behavior.
⸻
🔍 Key Points I’m Watching
• The lower area of this range (around $230–$250) has acted as an important zone of interest before.
• The upper boundary near $425–$450 has repeatedly capped upward movement.
• How price behaves between these levels may give insight into the broader structure of the trend.
⸻
🕰️ Final Thoughts
This analysis isn’t a prediction or a recommendation — just an observation of how patterns sometimes reappear in the market.
Whether or not this current range resolves in a similar way to the last one remains to be seen, but the repetition in structure and timing is fascinating from a technical perspective.
Markets often rhyme, and MSTR might just be showing another verse of a familiar song. 🎵

MicroStrategyBitcoin.
Still lots of downside left on the table for Saylor's MicroStrategy.
More time required before any type of lower risk entry point morphs into existence.

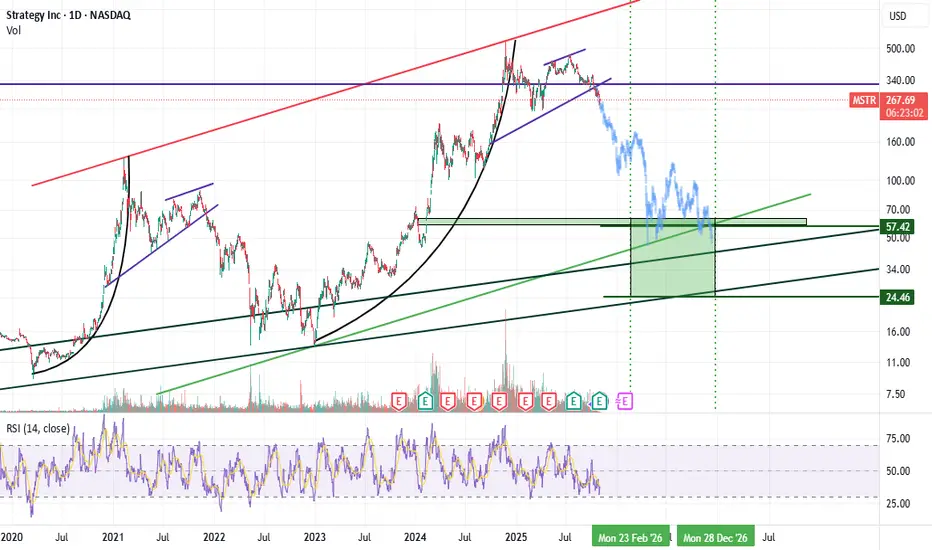
$MSTR still bullish at supportstrategy has lately been underperforming compared with simular assets. It's stuck in this arc and the diagonal line. When it finds support and breaks the arc you will teleport to the next arc. This gets invalidated when breaking to the downside!


$MSTR - Some Temporary Bottom PossibleNot a bad place to pick up some MSTR if you've been looking to purchase shares. Overall, it remains a high-volatility, high-convexity speculative play tied directly to Bitcoin’s trajectory.
Disclaimer:
I do not provide personal investment advice and I am not a qualified licensed investment advisor. I am an amateur investor.
All information found here, including any ideas, opinions, views, predictions, forecasts, commentaries, suggestions, or stock picks, expressed or implied herein, are for informational, entertainment or educational purposes only and should not be construed as personal investment advice. While the information provided is believed to be accurate, it may include errors or inaccuracies. I will not and cannot be held liable for any actions you take as a result of anything you read here.
Conduct your own due diligence, or consult a licensed financial advisor or broker before making any and all investment decisions. Any investments, trades, speculations, or decisions made on the basis of any information found on here, expressed or implied herein, are committed at your own risk, financial or otherwise.
Feel free to give us a follow and shoot us a like for more analysis updates
Inflation & CPI Trends Across Major Economies1. What Inflation and CPI Represent
Inflation represents the rate at which the general level of prices increases over time. It shows how much the purchasing power of money declines—meaning the same amount of money buys fewer goods and services. The Consumer Price Index (CPI) is one of the most widely used indicators to measure inflation. CPI tracks the price changes of a "basket" of essential goods and services such as food, housing, healthcare, education, transportation, energy, and other everyday items.
Most central banks aim to keep inflation around 2%, believing this level balances economic growth and price stability. Too little inflation risks deflation, while too much inflation destroys purchasing power and can destabilize an economy.
2. United States – Inflation Led by Services and Wages
The U.S. has experienced significant inflationary fluctuations in recent years. After rising sharply due to pandemic-related supply disruptions, labor shortages, and aggressive fiscal stimulus, inflation began to cool. However, the U.S. economy also faced persistent services inflation, driven by rising wages, rent growth, and strong consumer spending.
The Federal Reserve uses the CPI and its preferred measure, the PCE index, to assess inflation pressure. To control inflation, the Fed raised interest rates aggressively. Cooling inflation in the U.S. is heavily influenced by:
Stabilization of supply chains
Declines in energy prices
Slower wage growth
Softening consumer demand
Still, services and housing costs often remain elevated, making full normalization slower. The U.S. inflation trend has major global implications because of the dollar’s role in global trade and finance.
3. Eurozone – Energy Prices and Weak Growth Dynamics
Inflation in the Eurozone has been heavily affected by energy price shocks, particularly due to geopolitical tensions and disruption of natural gas supply. When energy prices surged, CPI reached decades-high levels. As energy prices normalized, inflation cooled significantly.
However, inflation dynamics in Europe differ from the U.S. because of:
Weak GDP growth
Higher dependence on imported energy
Slower wage gains
Fragmented labor markets across member countries
While headline inflation eased, core inflation—which excludes volatile items like food and energy—sometimes remained elevated. The European Central Bank (ECB) aims for a 2% target, but must balance inflation control with the region’s fragile economic growth, making policy decisions more challenging.
4. United Kingdom – Stubbornly High Inflation Pressures
The UK experienced one of the highest inflation rates among developed economies due to a combination of factors:
Brexit-induced supply chain disruptions
Declines in labor supply
High food and energy prices
Strong services inflation
The Bank of England faced a difficult environment: inflation stayed high even as economic growth weakened. Food inflation and rising rents were particularly sticky. Although inflation eventually began easing, services inflation and wage pressures remained key challenges. The UK’s unique mix of structural and cyclical inflation forces continues to make inflation management more difficult compared with the U.S. or Eurozone.
5. Japan – Moving From Deflation to Inflation
Japan historically struggled with deflationary pressures for decades. However, global supply chain disruptions, higher import prices, and a weaker yen pushed Japan’s inflation upward more recently. Japanese inflation trends differ from the West:
Price rises are often driven by cost-push rather than demand-pull factors
Wage growth tends to be modest
Consumer behavior is highly price-sensitive
Firms are reluctant to raise prices
The Bank of Japan maintained ultra-loose monetary policy longer than other central banks due to its long deflation history. Inflation rising closer to the BOJ’s target was seen as a structural shift, but sustainability remains uncertain. Japan’s inflation is typically lower and more fragile than Western economies.
6. China – Low Inflation and Risk of Deflation
Unlike the West, China’s inflation trends have been very subdued. Several factors contribute to China’s low CPI:
Weak domestic demand
Property market slowdown
Falling producer prices
Slow wages growth
Consumers increasing savings rather than spending
At times, China even faces deflationary pressures, especially in the manufacturing sector. China’s CPI is heavily influenced by food prices, particularly pork, which can cause short-term volatility but not persistent inflation. The People’s Bank of China typically uses supportive monetary policy, contrasting sharply with the tightening cycles in Western countries.
China’s low inflation is a sign of economic softness rather than stability, impacting global trade demand and commodity markets.
7. India – Balancing Growth and Inflation
India's inflation trends often revolve around food, fuel, and commodity prices, which make CPI more volatile compared with advanced economies. Seasonal factors, monsoon quality, and global oil prices heavily influence inflation in India. Food inflation—especially vegetables, cereals, and pulses—plays a significant role.
The Reserve Bank of India targets a 4% inflation midpoint. Despite fluctuations, India often manages inflation reasonably due to:
Strong supply-side interventions
Government food subsidies
A diversified economy
A growing services sector
However, persistent food shocks and high global oil prices can challenge India’s inflation stability.
8. Emerging Markets – More Volatility, Higher CPI Pressures
Emerging markets such as Brazil, Turkey, South Africa, and Indonesia often face higher and more volatile inflation due to:
Exchange rate fluctuations
High dependence on imported fuel and food
Political instability
Limited monetary policy credibility
Lower household income buffers
Turkey has experienced hyperinflation-like conditions at times due to unorthodox monetary policy, while Brazil and others use very high interest rates to stabilize inflation.
Inflation management in emerging markets is fundamentally more complex, with structural challenges and external shocks playing a larger role.
9. Global Trends – What Unites and What Differentiates
Several global inflation themes have emerged:
Common Factors Across Economies
Supply chain disruptions
Energy and commodity price volatility
Labor market shifts
Climate-related food supply issues
Geopolitical tensions
Key Differences
Advanced economies face wage-driven services inflation.
China and Japan face weak demand and deflation risks.
Emerging markets face currency-driven inflation shocks.
Central banks globally aim for price stability but must balance inflation control with economic growth. Fiscal policies, demographics, globalization trends, and technological innovation also shape long-term inflation trajectories.
Conclusion
Inflation and CPI trends across major economies are shaped by a mix of global and domestic forces. While the U.S. and Europe focus on cooling services inflation, Japan and China deal with the opposite challenge: ensuring demand is strong enough to prevent deflation. Emerging markets juggle inflation volatility due to external shocks. Understanding these regional differences is essential for investors, businesses, and policymakers to navigate an interconnected global economic landscape.

Target shownI think we have a great target here before bulls step in. Wallstreet may be telegraphing what it thinks about bitcoin.
Risk is letting out air bigtime today.

Forward and Future Forex Trading1. Understanding Forex Derivatives
A derivative is a financial contract whose value is derived from the performance of an underlying asset—in this case, a currency pair. In forex trading, derivatives such as forwards, futures, options, and swaps are used to hedge currency risks or to speculate on currency price movements. The purpose is to manage exchange rate volatility that can impact trade, investment returns, or the cost of imported and exported goods.
2. What is a Forward Forex Contract?
A forward contract in forex is a customized agreement between two parties to exchange a specific amount of one currency for another at a predetermined rate (known as the forward rate) on a specified future date.
For example, suppose an Indian importer expects to pay $1 million to a U.S. supplier in three months. If the current USD/INR rate is ₹83, and the importer fears that the rupee may depreciate to ₹85, they can enter into a forward contract with a bank to buy $1 million at ₹83.50 after three months. Regardless of the market rate at that time, the importer will pay ₹83.50 per dollar, thus avoiding potential losses from exchange rate volatility.
Key Characteristics of Forward Contracts:
Customization: The contract size, maturity date, and exchange rate are negotiated between the buyer and seller.
No Exchange Trading: Forwards are traded over-the-counter (OTC), typically between banks, corporations, or financial institutions.
Settlement: The exchange of currencies occurs on the agreed future date.
No Initial Margin: Usually, no upfront margin is required; settlement happens only at maturity.
3. What is a Forex Futures Contract?
A forex futures contract is a standardized agreement to buy or sell a specific amount of currency at a future date and a predetermined rate. Unlike forwards, futures are traded on regulated exchanges such as the Chicago Mercantile Exchange (CME) or Intercontinental Exchange (ICE).
For instance, a trader may buy a Euro FX Futures contract to purchase euros and sell U.S. dollars at a fixed exchange rate three months from now. These contracts are marked to market daily, meaning profits and losses are settled at the end of each trading day.
Key Characteristics of Futures Contracts:
Standardization: Futures have fixed contract sizes, maturity dates, and settlement procedures.
Exchange-Traded: Traded on organized exchanges under regulatory supervision.
Daily Settlement: Open positions are marked to market daily, and margin adjustments are made accordingly.
Margins and Clearing Houses: Traders deposit an initial margin and maintain a variation margin to cover potential losses. Clearing houses guarantee the trade, reducing counterparty risk.
4. Forward vs. Future Forex Contracts – Key Differences
Feature Forward Contract Futures Contract
Trading Venue Over-the-counter (OTC) Organized exchanges (e.g., CME)
Customization Fully customizable Standardized
Counterparty Risk Higher (no clearing house) Lower (clearing house guarantees)
Liquidity Lower Higher
Margin Requirement Usually none Required (initial and variation)
Settlement At maturity Daily mark-to-market
Flexibility High Limited due to standardization
Use Case Hedging by corporations Speculation and hedging by traders
In essence, forwards are tailored instruments suited for businesses with specific needs, while futures cater more to traders and investors who prefer liquidity, transparency, and regulatory oversight.
5. Purpose and Applications
A. Hedging
Corporations use forwards and futures to hedge foreign exchange exposure from imports, exports, loans, or investments.
Example: An Indian IT firm expecting USD inflows may sell dollars forward to lock in the current exchange rate and protect against rupee appreciation.
B. Speculation
Traders and investors use futures to profit from expected currency movements.
Example: A trader expecting the euro to strengthen may buy euro futures contracts.
C. Arbitrage
Arbitrageurs exploit differences in currency prices between spot, forward, and futures markets to earn risk-free profits.
Example: Covered interest arbitrage ensures alignment between interest rates and forward premiums.
D. Portfolio Diversification
Forex futures allow institutional investors to gain exposure to foreign currencies, balancing risk in their investment portfolios.
6. Advantages of Forward and Future Forex Contracts
Forwards:
Tailored contracts that meet exact needs.
Useful for long-term hedging.
No upfront margin or daily cash flow requirement.
Futures:
Highly liquid and easily tradable.
Reduced counterparty risk due to clearing houses.
Transparent pricing and regulated environment.
Ideal for short-term trading or speculation.
7. Disadvantages and Risks
Forwards:
High counterparty risk.
Illiquid—difficult to exit before maturity.
No daily marking to market; losses can accumulate unnoticed.
Futures:
Less flexibility due to standardization.
Requires margin deposits, tying up capital.
Daily settlement can create cash flow challenges.
Speculative positions can amplify losses.
8. Market Participants
The key participants in forward and future forex trading include:
Commercial Banks – act as counterparties in forward contracts.
Corporations – hedge foreign exchange risk.
Hedge Funds & Institutional Investors – speculate using futures.
Central Banks – use forwards/futures for currency stabilization.
Retail Traders – participate in exchange-traded futures for short-term gains.
9. Real-World Examples
Forward Example:
A Japanese exporter expecting $5 million from a U.S. buyer in six months locks in the JPY/USD forward rate to avoid yen appreciation losses.
Futures Example:
A currency trader on CME buys British Pound futures anticipating a rise in GBP against USD. If GBP strengthens, the trader profits as the futures contract gains value.
10. Global Forex Forward and Futures Markets
The forward market is vast, largely dominated by interbank transactions. According to the Bank for International Settlements (BIS), forwards account for over $1 trillion in daily turnover globally.
The futures market, while smaller, is growing rapidly due to transparency and accessibility. Leading exchanges like CME, Euronext, and SGX offer a wide range of currency futures, including EUR/USD, GBP/USD, USD/JPY, and emerging market pairs such as USD/INR.
Conclusion
Both forward and future forex trading play critical roles in the international financial system. Forwards provide flexibility and customization, making them ideal for corporations seeking to hedge long-term currency risks. Futures, on the other hand, offer liquidity, transparency, and regulatory safety, making them attractive for traders and investors.
In today’s volatile global economy, where exchange rates can fluctuate due to geopolitical tensions, monetary policies, or economic shocks, these instruments are indispensable tools for managing currency exposure and optimizing financial strategies. The choice between forwards and futures ultimately depends on the trader’s objectives, risk appetite, and the nature of their exposure. Together, they ensure that global trade and investment can proceed with reduced uncertainty and enhanced financial stability.
Challenges and Risks in Global Investing1. Introduction to Global Investing
Global investing refers to the practice of allocating capital across international markets, including stocks, bonds, mutual funds, and other financial instruments from different countries. While it offers opportunities to capture growth from emerging economies and diversification benefits, it also exposes investors to risks that stem from global interdependence. These risks may arise due to variations in political systems, market maturity, taxation, and macroeconomic conditions. Therefore, a well-informed global investor must carefully assess the potential threats and rewards before investing abroad.
2. Currency Risk
One of the most significant challenges in global investing is currency risk or exchange rate risk. When investors hold assets denominated in foreign currencies, fluctuations in exchange rates can affect investment returns.
For example, if an Indian investor invests in U.S. stocks and the Indian rupee strengthens against the U.S. dollar, the investor’s returns in rupee terms will decrease even if the stock’s price rises in dollar terms. Similarly, if the rupee weakens, the investor may benefit from favorable exchange rate movements.
Currency volatility is influenced by inflation, interest rate differentials, trade balances, and geopolitical factors. Investors can mitigate this risk through hedging strategies, such as currency futures or options, but these come with additional costs and complexities.
3. Political and Geopolitical Risks
Political instability is another major challenge in global investing. Changes in government, social unrest, corruption, or political uncertainty can severely affect the performance of investments in certain countries.
For example, political tensions between countries can lead to trade restrictions, sanctions, or expropriation of assets, directly impacting multinational companies. The Russia-Ukraine conflict in recent years, for instance, has led to economic sanctions that affected investors with exposure to those regions.
Similarly, sudden policy changes such as nationalization of industries, tax reforms, or foreign investment restrictions can negatively impact returns. Hence, political risk assessment is crucial when investing in developing or politically unstable nations.
4. Economic and Market Risks
Different economies move through cycles of expansion and contraction at varying times. This creates economic risk, which can impact the performance of international investments.
Emerging markets often offer high growth potential but may also experience sharp downturns due to weak economic structures, inflationary pressures, or currency devaluations. Developed markets, on the other hand, may provide stability but lower growth prospects.
Moreover, global market risks—such as recessions, interest rate hikes, or financial crises—can have widespread effects. The 2008 Global Financial Crisis demonstrated how interconnected financial markets are, as a collapse in the U.S. housing market triggered a worldwide recession.
5. Regulatory and Legal Risks
Each country operates under its own regulatory framework, which governs business practices, financial reporting, and investor protections. Differences in accounting standards, disclosure requirements, and corporate governance practices can pose serious challenges for global investors.
For example, while the U.S. follows GAAP (Generally Accepted Accounting Principles), many other countries use IFRS (International Financial Reporting Standards). These variations can make it difficult to compare companies across borders.
Legal systems in some countries may also lack transparency or enforceability. In extreme cases, investors may face fraud, corruption, or lack of legal recourse when disputes arise. Therefore, understanding the local legal and regulatory landscape is essential before making any international investment.
6. Cultural and Communication Barriers
Cultural differences play a subtle but significant role in global investing. Business practices, negotiation styles, corporate culture, and consumer behavior vary across regions. Misunderstanding these cultural nuances can lead to poor investment decisions.
For instance, a company operating successfully in the U.S. might not achieve the same results in Japan or India due to differences in consumer preferences, labor laws, or management styles. Similarly, language barriers can lead to misinterpretation of financial information or communication errors with local partners and institutions.
Investors need to account for these soft factors when analyzing global markets to ensure that cultural misalignment does not undermine business potential.
7. Liquidity Risk
Liquidity risk arises when investors are unable to buy or sell an asset quickly without affecting its price. In many foreign markets—especially in developing nations—financial instruments are less liquid than in major global exchanges.
For example, while shares on the New York Stock Exchange (NYSE) can be traded almost instantly, stocks listed on smaller exchanges in emerging economies may take days or weeks to execute. This can pose problems during times of market stress when investors need to exit positions quickly.
Investors must, therefore, assess the liquidity levels of foreign markets before investing and avoid overexposure to illiquid assets.
8. Information and Transparency Challenges
Access to reliable and timely information is a cornerstone of sound investment decisions. However, in many countries, financial transparency and disclosure standards are not as rigorous as in developed markets.
Incomplete or inaccurate data can lead to mispricing of assets and poor investment choices. Furthermore, language differences, lack of research coverage, and limited access to company executives can make it difficult for foreign investors to fully understand the market environment.
Global investors often rely on local analysts, financial news, or international advisory firms to bridge this information gap.
9. Taxation and Repatriation Issues
Each country has its own tax laws, including capital gains tax, dividend tax, and withholding tax. Navigating these differences can be complicated, especially when double taxation treaties are not in place.
Additionally, repatriating profits from foreign investments can be difficult due to restrictions on currency transfers or unfavorable exchange rate conditions. Investors must consult international tax experts and understand cross-border tax implications to avoid unexpected liabilities.
10. Technological and Cybersecurity Risks
As global investing increasingly relies on digital platforms, cybersecurity threats have become a significant concern. Online trading platforms, digital banking systems, and financial data networks are all vulnerable to hacking and data breaches.
Moreover, technological disparities between countries may also impact efficiency and transparency. In less developed markets, outdated trading infrastructure or lack of digital safeguards can increase operational risks.
Investors must prioritize cybersecurity and ensure their brokers or financial institutions follow robust digital protection standards.
11. Environmental, Social, and Governance (ESG) Risks
The growing importance of ESG factors in global investing introduces another dimension of risk. Companies that fail to comply with environmental regulations, labor rights, or ethical practices may face boycotts, fines, or reputational damage.
Investors must evaluate not only financial performance but also the sustainability practices of international firms. Ignoring ESG considerations can result in long-term losses as global markets increasingly reward responsible and transparent businesses.
12. Global Systemic Risks
Certain risks, such as pandemics, climate change, and global recessions, affect the entire world simultaneously. The COVID-19 pandemic, for instance, caused massive disruptions across industries and countries, showing that no market is entirely insulated from global shocks.
Such systemic risks highlight the importance of maintaining flexibility, diversification, and proper risk management strategies in global portfolios.
13. Strategies to Mitigate Global Investment Risks
While global investing carries challenges, investors can manage these risks through prudent strategies:
Diversification: Spreading investments across regions, sectors, and asset classes reduces exposure to any single market.
Hedging: Using derivatives like options or futures to protect against currency or commodity price fluctuations.
Research and Due Diligence: Conducting in-depth analysis of political, economic, and financial environments before investing.
Professional Guidance: Consulting international fund managers or advisors with local expertise.
Regular Monitoring: Continuously tracking geopolitical and economic developments that may impact returns.
14. Conclusion
Global investing offers immense opportunities for wealth creation and diversification, but it comes with complex challenges and risks. Factors such as currency volatility, political instability, regulatory differences, and global crises can significantly impact investment outcomes. Successful global investors must adopt a disciplined approach that combines research, diversification, and risk management. By understanding and navigating these challenges wisely, investors can unlock the full potential of global markets while safeguarding their capital against unforeseen global shocks.

$MSTR: Monthly down trend...GM lads, looks like we have a fully confirmed monthly down trend in $MSTR...this likely is bad news for all of crypto.
Stay safe out there...
Cheers,
Ivan Labrie.

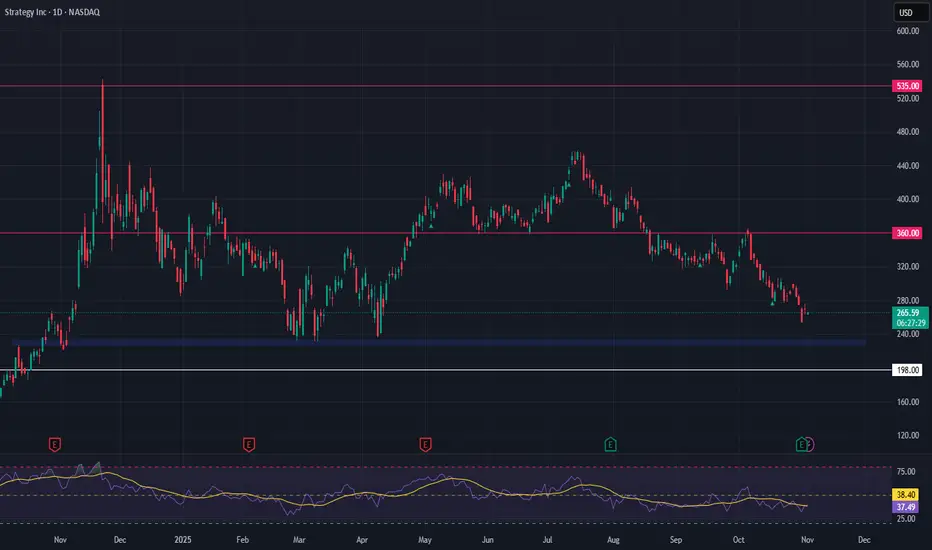
Strategy Inc (MSTR) – High-Beta Bitcoin Proxy at Key SupportStrategy Inc NASDAQ:MSTR has delivered another strong quarterly report, underscoring its continued commitment to aggressive Bitcoin accumulation. With over 158,000 BTC on the books, MSTR has firmly positioned itself as a leveraged proxy for Bitcoin, offering equity traders indirect crypto exposure. This bold balance sheet strategy has also pushed MSTR into alignment with S&P 500 inclusion criteria — a potential catalyst if index inclusion materializes.
Technically, the stock is now retesting a key support zone between $228 and $233. This level has historically held well and may offer a high-conviction entry for those anticipating a BTC rebound. Should Bitcoin aim for new highs, MSTR could respond with outsized upside, though traders must account for the volatility and downside risks that come with crypto-correlated equities.
🎯 Trade Setup:
Entry Zone: $228 – $233
Take Profit Targets: $360 and $535
Stop Loss: $198
This setup offers a high-risk, high-reward opportunity. As always, manage position size carefully and watch BTC price action for confirmation.
S&P 500 Inclusion QuantSignals V3 Screener 2025-11-01S&P 500 Inclusion QuantSignals V3 Screener 2025-11-01
🎯 S&P 500 Inclusion QuantSignals V3 Screener - 2025-11-01
Elite AI-powered S&P 500 inclusion candidate scanner
---
📊 S&P 500 Inclusion Criteria
• Market Cap: $14B+ (current threshold)
• Profitability: 4+ consecutive profitable quarters
• Public Float: 50%+ of shares publicly traded
• Liquidity: Adequate trading volume
• Sector Balance: Committee considers sector weights
🔥 Top Inclusion Candidates
📈 NYSE:BRK.B - Inclusion Score: 53/100
Confidence: 60.0% | Risk: Medium
Market Cap: $47.8B | Profitable Qtrs: 4 | Float: 65%
Days to Rebalance: 60 | Price: $477.54
Key Factors:
• 💰 Well Above Threshold ($47.8B, +15.0 pts)
• ✅ Meets Profitability (4Q, +7.0 pts)
• 🌐 Good Public Float (65%, +6.0 pts)
• 💧 Good Liquidity (1.5M vol, +3.0 pts)
• 📊 Sector Balanced (+0.0%, +2.0 pts)
📈 NYSE:TSM - Inclusion Score: 47/100
Confidence: 60.0% | Risk: Medium
Market Cap: $30.0B | Profitable Qtrs: 4 | Float: 65%
Days to Rebalance: 60 | Price: $300.43
Key Factors:
• 💰 Well Above Threshold ($30.0B, +15.0 pts)
• ✅ Meets Profitability (4Q, +7.0 pts)
• 🌐 Good Public Float (65%, +6.0 pts)
• 💧 Good Liquidity (1.5M vol, +3.0 pts)
• 📊 Sector Balanced (+0.0%, +2.0 pts)
📈 NYSE:SPOT - Inclusion Score: 44/100
Confidence: 45.0% | Risk: Medium
Market Cap: $65.5B | Profitable Qtrs: 4 | Float: 65%
Days to Rebalance: 60 | Price: $655.32
Key Factors:
• 💰 Well Above Threshold ($65.5B, +15.0 pts)
• ✅ Meets Profitability (4Q, +7.0 pts)
• 🌐 Good Public Float (65%, +6.0 pts)
• 💧 Good Liquidity (1.5M vol, +3.0 pts)
• 📊 Sector Balanced (+0.0%, +2.0 pts)
📈 NYSE:BABA - Inclusion Score: 40/100
Confidence: 45.0% | Risk: Medium
Market Cap: $17.0B | Profitable Qtrs: 4 | Float: 65%
Days to Rebalance: 60 | Price: $170.43
Key Factors:
• 💵 Meets Threshold ($17.0B, +8.0 pts)
• ✅ Meets Profitability
Image
(4Q, +7.0 pts)
• 🌐 Good Public Float (65%, +6.0 pts)
• 💧 Good Liquidity (1.5M vol, +3.0 pts)
• 📊 Sector Balanced (+0.0%, +2.0 pts)
Conflicts:
• ⚠️ High volatility (53%)
📈 NASDAQ:MSTR - Inclusion Score: 30/100
Confidence: 45.0% | Risk: Medium
Market Cap: $27.0B | Profitable Qtrs: 4 | Float: 65%
Days to Rebalance: 60 | Price: $269.51
Key Factors:
• 💰 Strong Market Cap ($27.0B, +12.0 pts)
• ✅ Meets Profitability (4Q, +7.0 pts)
• 🌐 Good Public Float (65%, +6.0 pts)
• 💧 Good Liquidity (1.5M vol, +3.0 pts)
• 📊 Sector Balanced (+0.0%, +2.0 pts)
Conflicts:
• ⚠️ Weak price action (-30.8%)
• ⚠️ High volatility (56%)
• ⚠️ CONFLICT: Recent price collapse (-25.1%, -10 pts)
---
💡 S&P 500 Inclusion Impact
• Passive Inflows: $12-15T tracks S&P 500, forces systematic buying
• Average Pop: 5-8% on announcement day
• Sustained Premium: Inclusion often creates lasting demand
• Index Rebalancing: Quarterly reviews create windows of opportunity
⚠️ Risk Management
• Inclusion is not guaranteed - these are probabilistic candidates
• Committee decisions can be unpredictable
• Use proper position sizing (max 2-5% per position)
• Set stop losses 10-15% below entry
💡 Remember: Buy the rumor, sell the news. Consider taking profits post-announcement.

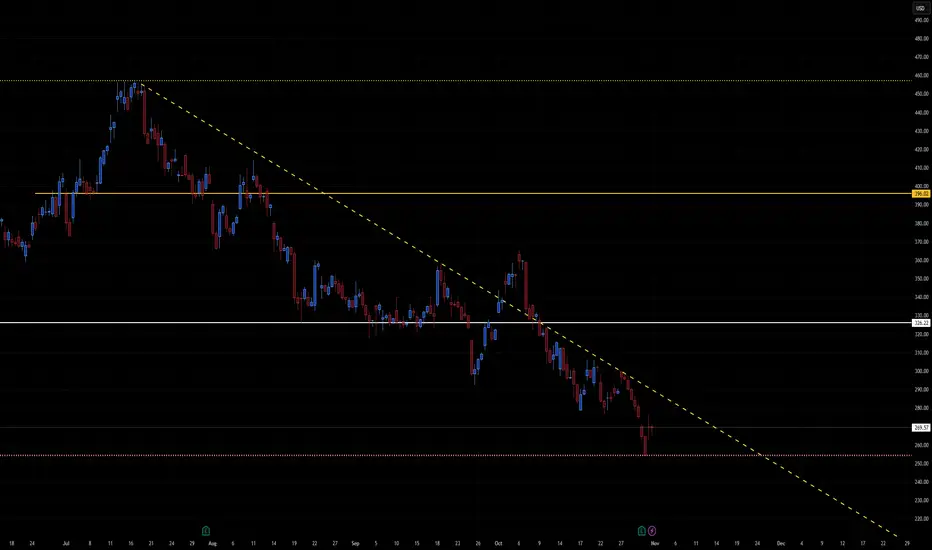
MSTR clear trendline well behaved chartA long-term descending trendline (yellow dashed line) acting as dynamic resistance since July highs.
Major horizontal support around 265 USD (recent low and yellow dotted line).
Resistance levels near 325 USD and 395–400 USD.
Overall pattern: extended downtrend with lower highs and lower lows, but price nearing a strong confluence zone (trendline + horizontal support).
This setup suggests MSTR is in a make-or-break area — either a short-term reversal bounce or continuation to new lows.
📈 Bullish Scenario
Setup:
Price has reached oversold levels near 265, aligning with historical support. A technical bounce is possible if Bitcoin stabilizes or rallies, given MSTR’s correlation.
Confirmation Triggers:
Close above 280–285 USD (short-term confirmation).
Break and close above descending trendline (~295–300).
Short-Term Targets:
325 USD — former support turned resistance.
395–400 USD — key horizontal level and top of prior range.
Bullish Catalysts:
Bitcoin recovery or strength toward $70K+.
Institutional or ETF-related flows benefiting BTC proxies.
Technical short-covering rally.
Invalidation:
Daily close below 260 USD with strong volume.
Probability: Moderate (~40%), as reversal setups often require confirmation after long downtrends.
📉 Bearish Scenario
Setup:
Price continues to respect descending resistance and fails to reclaim 285–295 zone, maintaining downward momentum.
Confirmation Triggers:
Breakdown below 265 USD support.
Expansion in sell volume below that level.
Short-Term Targets:
250–255 USD → minor horizontal level (recent pivot area).
230–235 USD → next structural support.
210–215 USD → measured move from current descending channel.
Bearish Catalysts:
Bitcoin correction below $65K.
Continued macro tightening or risk-off environment.
Market rejection of BTC-linked equities.
Invalidation:
Breakout above 300 USD with sustained buying pressure.
Probability: Slightly higher (~60%) as trend remains clearly bearish.
⚖️ Neutral / Accumulation View
If MSTR remains range-bound between 265 and 300, this indicates accumulation before next major move.
Expect choppy price action with short squeezes and weak rallies until a breakout direction emerges.
🧩 Summary Table
Bias Confirmation Target Zone Invalidation Notes
Bullish Close > 300 325 → 395 <260 Trendline breakout
Bearish Close < 265 250 → 230 >300 Trend continuation
Neutral Range 265–300 — — Sideways accumulation
🕒 2–3 Week Projection
Bullish path: Bounce from 265 → breakout above 300 → target 325–330 by mid-November.
Bearish path: Fail at 285–295 → breakdown below 265 → slide to 235 by mid/late November.
Trade Alert: $MSTR NOV 28 2025 $270 CALLS – +118% Profit TargetEnter: NASDAQ:MSTR Calls
Strike Price: $270
Expiry Date: NOV 28 2025
Buy in Price: $17.53 - $18.95
Sell Price: $38.22
Profit : +118% (Turn every $1 into $2.18)
Want Profitable Real-Time Options Alerts?

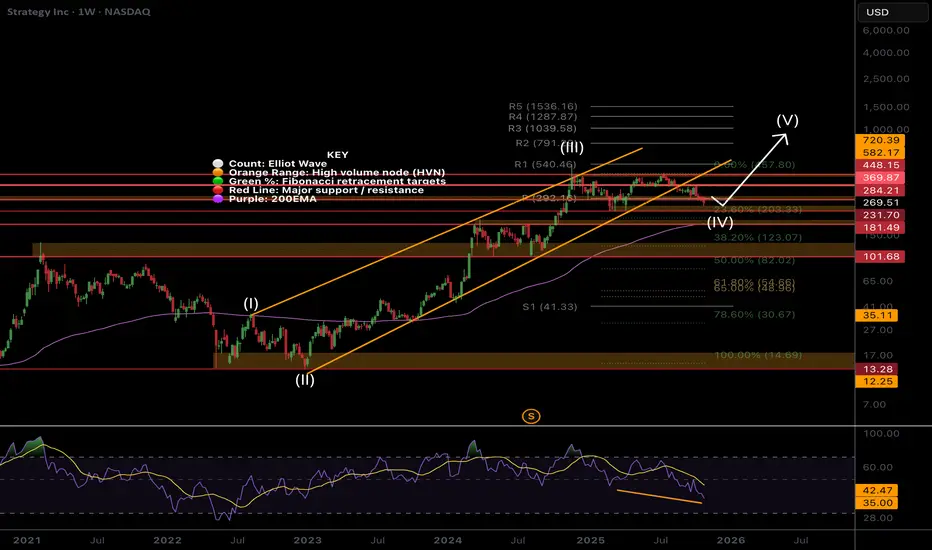
MSTR weekly bull divergence on low sentimentSentiment is low, the asset is hated and misunderstood by TradFi and retail. It’s a recipe for a bottom!
Price is still in a wave (IV) which are expected to be long and drawn out, driving investors into shallow capitulation through boredom into patient hands. I don’t expect wave (V) to kick in until Bitcoin moves. Wave (V) has an expected target of the R3 daily pivot at $1039 but will overextend if Bitcoin does.
Price has fallen out of the lower channel boundary and sitting below the weekly pivot, still above the weekly 200EMA so the outlook is bullish. Wave (4) may complete at the 0.236 Fibonacci retracement at $230. For now I am waiting to see what happens before entering. Good opportunities are setting up.
🎯 Terminal target for the business cycle could see prices as high as $1000 based on Fibonacci extensions
📈 Weekly RSI has bullish divergence
👉 Analysis is invalidated if we close back below $82
MSTR bearish , going way downBTC cycle is over or almost over - may not get the blow off top everyone is expecting. If that is the case MSTR will go to min 50-60 area if not lower.
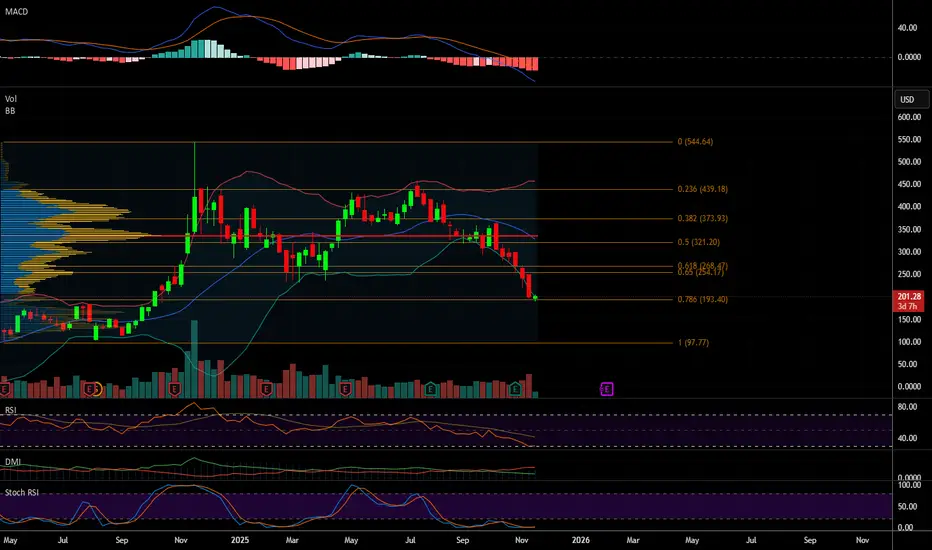
$MSTR: ABC correction targeting $230 range.NASDAQ:MSTR : this A-B-C correction is on its last leg. However, Elliot Wave theory suggests C wave usually finishes beyond A wave, which would take NASDAQ:MSTR to $230 range.
Strategy Inc. (MSTR)The stock is tied to the performance of Bitcoin, however, there seems to be a significant divergence in recent months. Handle with care.

Super high Reward Risk Ratio in MSTRAt 267, MSTR is at its long term trend line support.
As per ELliot wave it shows the end of corrective waves. Highly profitable entry setup with just 5% risk as stop loss.

272.30This channel is not providing individualized trading or investment advice, nor is it a banking service, brokerage service, trading service, investment service or money management service
